The Multimodal Presentation Dashboard
Michael Johnston
AT&T Labs Research180 Park Ave Florham Park, NJ
johnston @research.
att.com
Patrick Ehlen
CSLI Stanford UniversityPalo Alto, CA
ehlen@csli. stanford.edu
David Gibbon
AT&T Labs Research180 Park Ave Florham Park, NJ
dcg@research. att.com
Zhu Liu
AT&T Labs Research180 Park Ave Florham Park, NJ
zliu@research. att.com
Abstract
The multimodal presentation dashboard al-lows users to control and browse presenta-tion content such as slides and diagrams through a multimodal interface that sup-ports speech and pen input. In addition to control commands (e.g. “take me to slide 10”), the system allows multimodal search over content collections. For example, if the user says “get me a slide about internet telephony,” the system will present a ranked series of candidate slides that they can then select among using voice, pen, or a wireless remote. As presentations are loaded, their content is analyzed and lan-guage and understanding models are built dynamically. This approach frees the user from the constraints of linear order allow-ing for a more dynamic and responsive presentation style.
1
Introduction
Anthropologists have long informed us that the way we work—whether reading, writing, or giving a presentation—is tightly bound to the tools we use. Web browsers and word processors changed the way we read and write from linear to nonlinear activities, though the linear approach to giving a presentation to a roomful of people has evolved little since the days of Mylar sheets and notecards, thanks to presentation software that reinforces—or even further entrenches—a linear bias in our no-tion of what “giving a presentano-tion” means to us. While today’s presentations may be prettier and flashier, the spontaneity once afforded by holding a stack of easily re-arrangeable sheets has been lost.
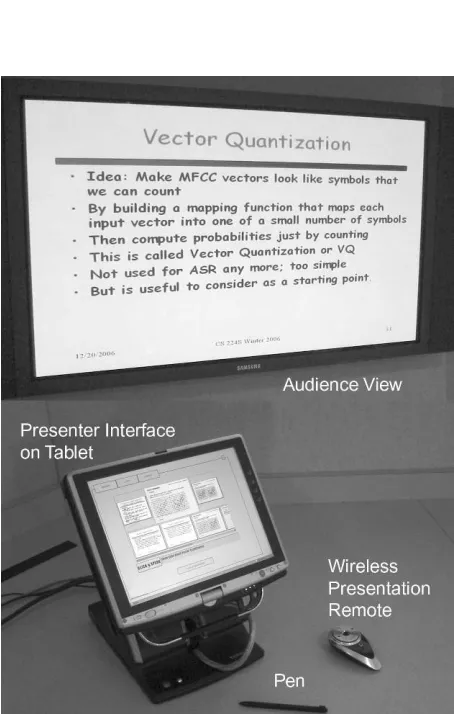
Figure 1 Presentation dashboard in action
Instead, a question from the audience or a change in plan at the podium results in a whizzing-by of all the wrong slides as the presenter sweats through an awkward silence while hammering an arrow key to track down the right one. In theory there are “search” functions that presenters could use to find another slide in the same presentation, or even in another presentation on the same machine, though none of the authors of this paper has ever seen a presenter do this. A likely reason is that these search functions are designed for desktop
nomics rather than for standing at a podium or walking around the room, making them even more disruptive to the flow of a presentation than frantic arrow key hammering.
In some utopian future, we envision presenters who are unhindered by limitations imposed by their presentation tools, and who again possess, as Aristotle counseled, “all available means of per-suasion” at the tips of their fingers—or their tongues. They enjoy freeform interactions with their audiences, and benefit from random access to their own content with no arrow hammering and no disruption in flow. Their tools help to expand their possible actions rather than limiting them. We are hardly alone in this vision.
In that spirit, many tools have been developed of late—both within and outside of research labs— with the aim of helping people work more effec-tively when they are involved in those assemblies of minds of mutual interest we often call “meet-ings.” Tools that capture the content of meetings, perform semantic understanding, and provide a browsable summary promise to free meeting par-ticipants from the cognitive constraints of worrying about trying to record and recall what happened when a meeting takes place (e.g., Ehlen, Purver & Niekrasz, 2007; Tucker & Whittaker, 2005).
Presentations are a kind of meeting, and several presentation tools have also sought to free present-ers from similar constraints. For example, many off-the-shelf products provide speech interfaces to presentation software. These often replace the lin-ear arrow key with the voice, offering command-based navigation along a one-dimensional vector of slides by allowing a presenter to say “next slide please” or “go to the last slide.”
A notable exception is the Jabberwocky inter-face to PowerPoint (Franklin, Bradshaw & Hammond, 1999; 2000), which aims to follow along with a presenter’s talk—like a human assis-tant might do—and switch to the appropriate slide when the presenter seems to be talking about it. Using a method similar to topic modeling, words spoken by the presenter are compared to a prob-ability distribution of words across slides. Jabber-wocky changes to a different slide when a sufficient probability mass has been reached to justify the assumption that the speaker is now talk-ing about a different slide from the one that’s al-ready showing.
A similar effort (Rogina & Schaaf, 2002) uses words extracted from a presentation to augment a class-based language model and attempt automatic tracking of a presentation as it takes place. This intelligent meeting room system then aligns the presenter’s spoken words with parts of a presenta-tion, hoping to determine when a presenter has moved on to a new slide.
A major drawback of this “machine-initiative” approach to presentation assistance is that a pre-senter must speak enough words associated with a new slide for a sufficient probability mass to be reached before the slide is changed. The resulting delay is likely to make an audience feel like the presentation assistant is rather dim-witted. And any errors that change slides before the presenter is ready can be embarrassing and disruptive in front of potentially important audiences.
So, in fashioning our own presentation control interface, we chose to allow the presenter to retain full initiative in changing slides, while offering a smarter and more flexible way to navigate through a presentation than the single degree of freedom afforded by arrow keys that simply traverse a pre-determined order. The result is the Multimodal Presentation Dashboard, a presentation interface that integrates command-based control with prob-abilistic, content-based search. Our method starts with a context-free grammar of speech commands, but embeds a stochastic language model generated from the presenter’s slide deck content so a pre-senter can request any slide from the deck—or even a large set of decks—just by asking for its contents. Potentially ambiguous results are re-solved multimodally, as we will explain.
2
Multimodal interface for interactive
presentations
2.1 Setup configuration
Though the dashboard offers many setup configu-rations, the preferred arrangement uses a single PC with two displays (Figure 1). Here, the dashboard is running on a tablet PC with a large monitor as a second external display. On the tablet, the dashboard UI is visible only to the presenter. On the external display, the audience sees the current slide, as they would with a normal presentation.
The presenter can interact with the dashboard using either the microphone onboard the tablet PC, or, preferably, a wireless microphone. A wireless remote functions as a presentation control, which can be used to manually change slides in the tradi-tional manner, and also provides a “push to talk” button to tell the dashboard when to listen. A wire-less microphone combined with the wirewire-less pres-entation control and voice selection mode (see Section 2.3) allows a presenter to stroll around the room or stage completely untethered.
2.2 Presenter UI
The presenter’s primary control of the system is through the presenter UI, a graphical user interface augmented with speech and pen input. The inter-face has three main screens: a presentation panel for controlling an ongoing presentation (Figure 2), a loader panel for selecting a set of presentations to load (Figure 4), and a control panel for adjusting system settings and bundling shareable index and grammar models. The user can select among the panels using the tabs at the top left.
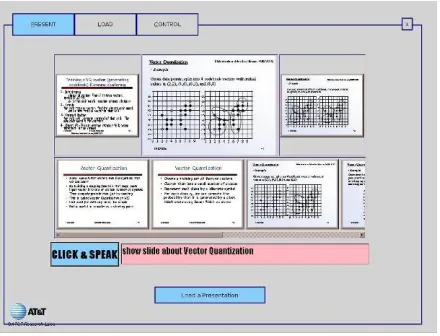
Figure 2 The presentation panel
The presentation panel has three distinct functional areas from top to bottom. The first row shows the current slide, along with thumbnails of the previ-ous and next slides to provide context. The user can navigate to the next or previous slide by click-ing on these thumbnails. The next row shows a scrolling list of search results from content-based queries. The last row contains interaction informa-tion. There is a click & speak button for activating the speech recognizer and a feedback window that displays recognized speech.
Some user commands are independent of the content of slide decks, as with basic commands for slide navigation:
- “next slide please”
- “go back”
- “last slide”
In practice, however, navigation to next and previ-ous slides is much easier using buttons on the wire-less control. The presenter can also ask for slides by position number, allowing random access:
- “take me to slide 10”
- “slide 4 please”
But not many presenters can remember the posi-tion numbers of some 40 or 50 slides, we’d guess, so we added content-based search, a better method of random access slide retrieval by simply saying key words or phrases from the desired slide, e.g.:
- “slides about internet telephony”
- “get me the slide with the system architecture”
- “2006 highlights”
- “budget plan, please”
When the presenter gives this kind of request, the system identifies any slides that match the query and displays them in a rank ordered list in the mid-dle row of the presenter’s panel. The presenter can then scroll through the list of thumbnails and click one to display it to the audience.
2.3 Voice selection mode
Alternatively, the presenter may sacrifice discre-tion for mobility and use a “voice selecdiscre-tion mode,” which lets the presenter roam freely throughout the auditorium while making and resolving content-based queries in plain view of the audience. In this mode, if a presenter issues a content-based query (e.g., “shows slides about multimodal access”), thumbnails of the slides returned by the query ap-pear as a dynamically-generated interactive “chooser” slide (Figure 3) in the main presentation viewed by the audience. The presenter can then select the desired slide by voice (e.g., “slide three”) or by using the previous, next, and select controls on the wireless remote. If more than six slides are returned by the query, multiple chooser slides are generated with six thumbnails to each slide, which can be navigated with the remote.
While voice selection mode allows the presenter greater mobility, it has the drawback of allowing the audience to see thumbnails of every slide re-turned by a content-based query, regardless of whether the presenter intended for them to be seen. Hence this mode is more risky, but also more im-pressive!
Figure 3 Chooser slide for voice selection mode
2.4 Compiling deck sets
Sometimes a presenter wishes to have access to more than one presentation deck at a time, in order to respond to unexpected questions or comments, or to indulge in a whimsical tangent. We respond to this wish by allowing the presenter to compile a
deck set, which is, quite simply, a user-defined bundle of multiple presentations that can all be
searched at once, with their slides available for display when the user issues a query. In fact, this option makes it easy for a presenter to follow spon-taneous tangents by switching from one presenta-tion to another, navigating through the alternate deck for a while, and then returning to the original presentation, all without ever walking to the po-dium or disrupting the flow of a presentation by stopping and searching through files.
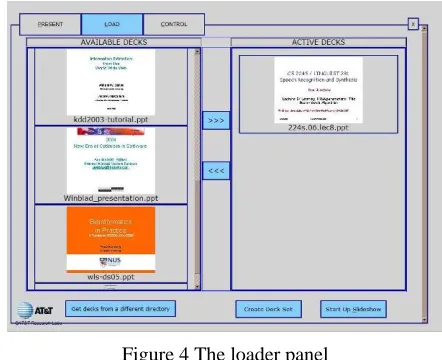
Deck sets are compiled in the loader panel (Fig-ure 4), which provides a graphical browser for se-lecting a set of active decks from the file system. When a deck set is chosen, the system builds ASR and language understanding models and a retrieval index for all the slides in the deck set. A compiled deck set is also portable, with all of the grammar and understanding model files stored in a single archive that can be transferred via e-mail or thumb drive and speedily loaded on another machine.
A common use of deck sets is to combine a main presentation with a series of other slide decks that provide background information and detail for answering questions and expanding points, so the presenter can adapt to the interests of the audience.
Figure 4 The loader panel
3
Multimodal architecture
and a graphical user interface client. The graphical UI runs in a web browser and controls PowerPoint via its COM interface.
We first describe the compilation architecture, which builds models and performs indexing when the user selects a series of decks to activate. We then describe the runtime architecture that operates when the user gives a presentation using the sys-tem. In Section 3.3, we provide more detail on the slide indexing mechanism and in Section 3.4 we describe a mechanism used to determine key-phrases from the slide deck that are used on a drop down menu and for determining relevancy.
3.1 Compilation architecture
In a sense, the presentation dashboard uses neither static nor dynamic grammars; the grammars com-piled with each deck set lie somewhere in-between those two concepts. Command-based speech inter-faces often fare best when they rely on the predict-ability of a fixed, context-free grammar, while interfaces that require broader vocabulary coverage and a wider range of syntax are better off leverag-ing the flexibility of stochastic language models. To get the best of both worlds for our ASR model, we use a context-free command “wrapper” to a stochastic language model (c.f. Wang & Acero 2003). This is coupled to the understanding mechanism using a transducer with a loop over the content words extracted from the slides.
This combined grammar is best thought of as a fixed, context-free template which contains an em-bedded SLM of dynamic slide contents. Our method allows a static background grammar and understanding model to happily co-exist with a dynamic grammar component which is compiled on the fly when presentations are loaded, enabling custom, content-based queries.
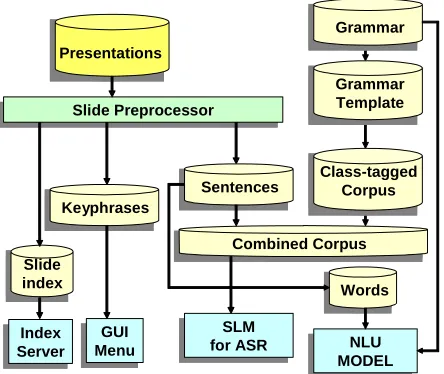
When a user designates a presentation deck set and compiles it, the slides in the set are processed to create the combined grammar by composing an SLM training corpus based on the slide content.
First, a slide preprocessor extracts sentences, ti-tles, and captions from each slide of each deck, and normalizes the text by converting numerals and symbols to strings, Unicode to ASCII, etc. These
content phrases are then used to compose (1) a combined corpus to use for training an SLM for speech recognition, and (2) a finite-state transducer
to use for multimodal natural language understand-ing (Johnston & Bangalore 2005).
Combined Corpus Presentations
Slide index
Keyphrases Slide PreprocessorSlide Preprocessor
Sentences
Figure 5 Compilation architecture
To create a combined corpus for the SLM, the con-tent phrases extracted from slides are iterated over and folded into a static template of corpus classes. For instance, the template entry,
<POLITE> <SHOWCON> <CONTENT_PHRASE>
could generate the phrase “please show the slide about <CONTENT_PHRASE>” for each content phrase—as well as many others. These templates are currently manually written but could poten-tially be induced from data as it becomes available.
The content corpus is appended to a command corpus of static command classes that generate phrases like “next slide please” or “go back to the last one.” Since the number of these command phrases remains constant for every grammar while the number of content phrases depends on how many phrases are extracted from the deck set, a weighting factor is needed to ensure the number of examples of both content and command phrases is balanced in the SLM training data. The resulting combined corpus is used to build a stochastic lan-guage model that can handle variations on com-mands and slide content.
In parallel to the combined corpus, a stack of slide content words is compiled for the finite state understanding machine. Phrases extracted for the combined corpus are represented as a terminal _CWORD class. (Terminals for tapes in each gram-mar class are separated by colons, in the format
repre-sented as ε) For example, the phrase “internet telephony” on a slide would appear in the under-standing grammar like so:
_CWORD internet:internet _CWORD telephony:telephony
These content word classes are then “looped” in the FSM (Figure 6) into a flexible understanding model of potential slide content results using only a few grammar rules, like:
_CONTENT _CWORD _CONTENT _CONTENT _CWORD
The SLM and the finite-state understanding ma-chine now work together to extract plausible mean-ings from dynamic and inexact speech queries.
Figure 6 Understanding FSM
To provide an example of how this combined ap-proach to understanding comes together in the run-ning system, let’s say a presenter’s slide contains the title “Report for Third Quarter” and she asks for it by saying, “put up the third quarter report slide.” Though she asks for the slide with language that doesn’t match the phrase on the slide, our for-giving stochastic model might return a speech re-sult like, “put up third quarter report mine.” The speech result is then mapped to the finite-state grammar, which catches “third quarter report mine” as a possible content phrase, and returns, “third,quarter,report,mine” as a con-tent-based meaning result. That result is then used for information retrieval and ranking to determine which slides best match the query (Section 3.3).
3.2
Runtime architecture
A primary goal of the presentation dashboard was that it should run standalone on a single laptop. A tablet PC works best for selecting slides with a pen, though a mouse or touch screen can also be used for input. We also developed a networked version of the dashboard system where indexing, compilation, speech recognition, and understand-ing are all network services accessed over HTTP and SIP, so any web browser-based client can log in, upload a presentation, and present without
in-stalling software aside from PowerPoint and a SIP plug-in. However, our focus in this paper is on the tablet PC standalone version.
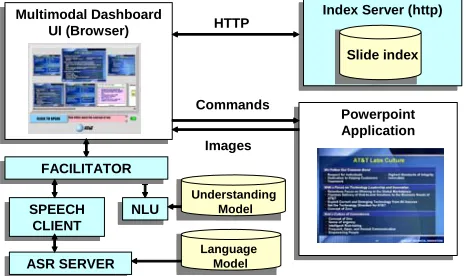
ASR SERVERASR SERVER Multimodal Dashboard
UI (Browser) Multimodal Dashboard
UI (Browser)
NLUNLU
Powerpoint Application Powerpoint Application Index Server (http)Index Server (http)
Language Model
Slide index HTTP
Commands
Images
FACILITATORFACILITATOR
SPEECH CLIENT SPEECH
CLIENT
Understanding Model
Figure 7 Multimodal architecture
The multimodal user interface client is browser-based, using dynamic HTML and Javascript. Inter-net Explorer provides COM access to the Power-Point object model, which reveals slide content and controls the presentation. Speech recognition, un-derstanding, and compilation components are ac-cessed through a java-based facilitator via a socket connection provided by an ActiveX control on the client page (Figure 7). When the user presses or taps the click & speak button, a message is sent to the Speech client, which sends audio to the ASR Server. The recognizer’s speech result is processed by the NLU component using a finite-state trans-ducer to translate from the input string to an XML meaning representation. When the multimodal UI receives XML for simple commands like “first slide” or “take me to slide ten,” it calls the appro-priate function through the PowerPoint API. For content-based search commands, an SQL query is constructed and issued to the index server as an HTTP query. When the results are returned, mul-timodal thumbnail images of each slide appear in the middle row of the UI presenter panel. The user can then review the choices and switch to the ap-propriate slide by clicking on it—or, in voice se-lection mode, by announcing or selecting a slide shown in the dynamically-generated chooser slide.
fails, the system resorts to an OR query and shows slides which have any of the query terms.
3.3
Information retrieval
When the slide preprocessor extracts text from a presentation, it retains the document structure as much as possible and stores this in a set of hier-archal XML documents. The structure includes global document metadata such as creation date and title, as well as more detailed data such as slide titles. It also includes information about whether the text was part of a bullet list or text box. With this structure, queries can be executed against the entire text or against specified textual attributes (e.g. “show me the chart titled ‘project budget’”).
For small document collections, XPath queries can search the entire collection with good response time, providing a stateless search method. But as the collection of presentation decks to be searched grows, a traditional inverted index information re-trieval system achieves better response times. We use a full text retrieval system that employs stem-ming, proximity search, and term weighting, and supports either a simplified query syntax or SQL. Global metadata can also constrain queries. Incre-mental indexing ensures that new presentation decks cause the index to update automatically without being rebuilt from scratch.
3.4
Key phrase extraction
Key phrases and keywords are widely used for in-dexing and retrieving documents in large data-bases. For presentation slides, they can also help rank a slide’s relevance to a query. We extract a list of key phrases with importance scores for each slide deck, and phrases from a set of decks are merged and ranked based on their scores.
A popular approach to selecting keywords from a document within a corpus is to find keywords that frequently occur in one document but seldom occur in others, based on term frequency-inverse document frequency (TF-IDF). Our task is slightly different, since we wish to choose key phrases for a single document (the slide deck), independent of other documents. So our approach uses term fre-quency-inverse term probability (TF-ITP), which expresses the probability of a term calculated over a general language rather than a set of documents.
Assuming a term Tk occurs tfk times in a docu-ment, and its term probability is tpk, the TF-ITP of
Tk is defined as, wTk = tfk / tpk. This method can be extended to assign an importance score to each phrase. For a phrase Fk = {T1 T2 T3 … TN}, which contains a sequence of N terms, assuming it ap-pears ffk times in a document, its importance score,
ISk, is defined as,
∑
=
=
Ni i
k k
T
ff
IS
1
.
To extract a set of key phrases, we first segment the document into sentences based on punctuation and some heuristics. A Porter stemming algorithm (Porter 1980) eliminates word variations, and phrases up to N=4 terms long are extracted, remov-ing any that start or end with noise words. An im-portance score ranks each phrase, where term probabilities are estimated from transcripts of 600 hours of broadcast news data. A term that is out of the vocabulary with a term frequency of more than 2 is given a default term probability value, defined as the minimum term probability in the vocabulary. Phrases with high scores are chosen as key phrases, eliminating any phrases that are contained in other phrases with higher scores. For an overall list of key phrases in a set of documents, we merge individual key phrase lists and sum the importance scores for key phrases that recur in different lists, keeping the top 10 phrases.
4
Performance and future work
The dashboard is fully implemented, and has been used by staff and management in our lab for inter-nal presentations and talks. It can handle large decks and collections (100s to 1000s of slides). A tablet PC with a Pentium M 1.6Ghz processor and 1GB of RAM will compile a presentation of 50 slides—with ASR, understanding models, and slide index—in under 30 seconds.
We also hope to extend current retrieval meth-ods to operate at the level of concepts, rather than words and phrases, so a request to show “slides about mortgages” might return a slide titled “home loans.” Thesauri, gazetteers, and lexicons like WordNet will help achieve this. Analyzing non-textual elements like tables and charts could also allow a user to say, “get the slide with the network architecture diagram.” And, while we now use a fixed lexicon of common abbreviations, an auto-mated analysis based on web search and other techniques could identify likely expansions.
5
Conclusion
Our goal with the multimodal presentation dashboard was to create a meeting/presentation assistance tool that would change how people be-have, inspiring presenters to expand the methods they use to interact with audiences and with their own material. To this end, our dashboard runs on a single laptop, leaves the initiative in the hands of the presenter, and allows slides from multiple pres-entations to be dynamically retrieved from any-where in the room. Our assistant requires no “intelligent room”; only an intelligent presenter, who may now offer the audience a presentation that is as dynamic or as dull as imagination allows.
As Tufte (2006) reminds us in his analysis of how PowerPoint presentations may have precipi-tated the Columbia shuttle tragedy, the way infor-mation is presented can have a profound—even life-threatening—impact on the decisions we make. With the multimodal presentation dashboard, we hope to free future presenters from that single, arrow-key dimension, offering access to presentation slides and diagrams in any order, using a diverse combination of modes. Presenters can now pay more attention to the needs of their audiences than to the rigid determinism of a fixed presentation. Whether they will break free of the linear presentation style imposed by current tech-nology if given a chance remains to be seen.
References
Patrick Ehlen, Matthew Purver, and John Niekrasz. 2007. A meeting browser that learns. In Proceedings of the AAAI Spring Symposium on Interaction Chal-lenges for Intelligent Assistants.
David Franklin, Shannon Bradshaw, and Kristian Hammond. 1999. Beyond “Next slide, please”: The
use of content and speech in multi-modal control. In Working Notes of the AAAI-99 Workshop on Intelli-gent Information Systems.
David Franklin, Shannon Bradshaw, and Kristian Hammond. 2000. Jabberwocky: You don't have to be a rocket scientist to change slides for a hydrogen combustion lecture. In Proceedings of Intelligent User Interfaces 2000 (IUI-2000).
Vincent Goffin, Cyril Allauzen, Enrico Bocchieri, Dilek Hakkani-Tür, Andrej Ljolje, Sarangarajan Partha-sarathy, Mazin Rahim, Giuseppe Riccardi, and Murat Saraclar. 2005. The AT&T WATSON speech recog-nizer. In Proceedings of ICASSP.
Michael Johnston, Srinivas Bangalore, Guna Vasireddy, Amanda Stent, Patrick Ehlen, Marilyn Walker, Steve Whittaker, Preetam Maloor. 2002. MATCH: An Ar-chitecture for Multimodal Dialogue Systems. In Pro-ceedings of the 40th ACL. 376-383.
Michael Johnston and Srinivas Bangalore. 2005. Finite-state multimodal integration and understanding. Journal of Natural Language Engineering. 11.2, pp. 159-187, Cambridge University Press.
Martin F. Porter. 1980. An algorithm for suffix strip-ping, Program, 14, 130-137.
Ivica Rogina and Thomas Schaaf. 2002. Lecture and presentation tracking in an intelligent meeting room. In Proceedings of the 4th IEEE International Confer-ence on Multimodal Interfaces. 47-52.
Simon Tucker and Steve Whittaker. 2005. Accessing multimodal meeting data: Systems, problems and possibilities. In Samy Bengio and Hervé Bourlard (Eds.) Lecture Notes in Computer Science, 3361, 1-11
Edward Tufte. 2006. The Cognitive Style of PowerPoint. Graphics Press, Cheshire, CT.
Ye-Yi Wang and Alex Acero. 2003. Combination of CFG and N-gram Modeling in Semantic Grammar Learning. Proceedings of Eurospeech conference, Geneva, Switzerland.