Bioaerosols in the lungs of subjects with different ages-part 1:
deposition modeling
Robert Sturm
Department of Materials Science and Physics, Division of Physics and Biophysics, University of Salzburg, Salzburg, Austria Correspondence to: Dr. Robert Sturm. Brunnleitenweg 41, A-5061 Elsbethen, Austria. Email: sturm_rob@hotmail.com.
Background: In this contribution the inhalation and deposition of bioaerosols including particles with various shapes and sizes were investigated for probands with different ages (1, 5, 15 and 20 y). The study should help to increase our knowledge with regard to the behavior of variably shaped and sized particles in lungs being subject to different developmental stages.
Methods: Simulation of particle transport and deposition in single structures of the respiratory tract was conducted by using a stochastic model of the tracheobronchial tree and well-validated analytical and empirical deposition formulae. Possible effects of particle geometry on deposition were taken into consideration by application of the aerodynamic diameter concept. Age-dependent lung morphometry and breathing parameters were computed by using appropriate scaling factors.
Results: Theoretical simulations came to the result that bioparticle deposition in infants and children clearly differs from that in adolescents and adults insofar as the amount of deposited mass exhibits a positive correlation with age. Nose breathing results in higher extrathoracic deposition rates than mouth breathing and, as a consequence of that, lower particle amounts are enabled to enter the lung structures after passing the nasal airways. Under sitting breathing conditions highest alveolar deposition rates were calculated for particles adopting aerodynamic diameters of 10 nm and 4 µm, respectively.
Conclusions: The study comes to the conclusion that bioparticles have a lower chance to reach the alveoli in infants’ and children’s lungs, but show a higher alveolar deposition probability in the lungs of adolescents and adults. Despite of this circumstance also young subjects may increasingly suffer from biogenic particle burden, when they are subject to a long-term exposure to certain bioaerosols.
Keywords: Bioaerosol; deposition; stochastic model; lung; age groups
Submitted Apr 14, 2016. Accepted for publication Apr 25, 2016. doi: 10.21037/atm.2016.05.62
View this article at: http://dx.doi.org/10.21037/atm.2016.05.62
Introduction
General characteristics of bioaerosols
According to our present knowledge bioaerosols include all solid and liquid particles of biological origin which are distributed in the ambient air. Main sources of such bioparticles transported in the atmosphere are, on the one hand, plants, from which pollen, endospores, leaf fragments or other biological components are released. On the other hand, also animals releasing small hairs, feathers or droplets of diverse body fluids may be regarded as sources of biogenic particles. Even humans themselves act as producers of
bioaerosols, when they undergo intense sweating, coughing or sneezing. A third group of bioparticles,which is essential in this context, includes all kinds of microorganisms such as bacteria, fungi, protozoa, viruses, and algae (1-3). As demonstrated by current research (4,5,6), industries manufacturing biogenic substances like wood or cotton may produce high concentrations of airborne particulate matter, if the organic raw materials are subjected to extensive mechanical treatment. Such organic dusts were found to represent remarkable environmental burdens (Figure 1).
less than 0.2 µm, whereas most bacteria, spores, and fungal cells fall within a size category ranging from 0.25 to 60 µm. Pollen originating from diverse gymno- and angiosperms vary in size between 5 and 300 µm, and multicellular complexes such as hairs and plant fragments may reach sizes of 1 mm and more. Concerning airborne cell fragments and cell colonies, sizes ranging from several nanometers to hundreds of micrometers are observed (1-3,7,8). Geometries of biogenic particles generally include perfect or close-to-perfect spheres (e.g., liquid droplets, spores, coccal bacteria, some pollen), rod-like or fibrous shapes (bacilli, hairs), and disk- or platelet-like shapes (organic dusts, plant fragments). Exact determination of particulate geometries is enabled by application of advanced optical techniques (1-3).
Under hygienic aspects bioaerosols have continuously gained relevance during the past decades. In general,
bioparticles inhaled from the ambient air may induce several types of insufficiencies. First, some pathogenic microorganisms may cause infectious diseases such as Legionnaire’s disease or Pontiac fever; second, specific constituents of biogenic particles may act as triggers of hypersensitivity or allergic diseases (asthma, allergic rhinitis, extrinsic allergic alveolitis, humidifier fever) (8,9); and third, toxic substances of natural origin (e.g., β-1,3-glucans, mycotoxins) may induce respective toxic reactions in the body (6,10). Chronic exposure to endotoxins or mycotoxins may among other result in bronchitis, asthma, organic dust toxic syndrome (ODTS) or toxic alveolitis (6,10-12).
Main objectives of the present study
[image:2.595.120.499.86.440.2]For studying the hygienic effects of biogenic particles in the Figure 1 Scheme illustrating the human respiratory tract as well as particles of biological origin which have the potential to be taken up into the lungs.
viruses, bacteria
Cell fragments, hairs, etc.
Spor
es,
pollen
Biogenic
human respiratory tract as comprehensively as possible, the exact transport and deposition behavior of such particulate substances in single lung structures has to be well understood. Another essential requirement for fulfilling this ambitious aim is the knowledge of intersubject variabilities concerning intrapulmonary bioaerosol inhalation and interaction of particles with diverse lung epithelia. In this context, investigation of the behavior of biogenic particles in lungs belonging to different developmental stages is of immense value.
In the present contribution lung deposition of variably sized and shaped bioparticles is theoretically approximated for subjects with different ages. Besides infants (1 year), children (5 years), and adolescents (15 years), also adults (20 years) are included in this computational study. It is hypothesized that particle deposition in young probands completely differs from that in adults, so that possible hygienic consequences have to be discussed separately for each age group.
Methods
Basic features of the lung model
The mathematical model used for bioaerosol transport and deposition in the human respiratory tract is based on a stochastic structure of the tracheobronchial tree. This lung architecture, however, is mainly characterized by differences of the bronchial morphometry within a given airway generation and, thus, represents an advanced evolutionary stage with respect to deterministic structures. Asymmetry and randomness of the tracheobronchial tree is produced by the random selection of airway geometric parameters (length, diameter, branching angle of bifurcating tubes, gravity angle) from related probability density functions (13-15).
Simulation of particle transport and deposition within the stochastically generated lung structure is founded on the random walk principle, with each inhaled particle following its individual transport path. At each airway bifurcation, a random determination of whether the particle enters the major or minor daughter tube is executed by consideration of respective air-flow distributions. These are based on the hypothesis that flow splitting is proportional to distal air volume (13). Computation of particle deposition in a given airway tube is supposed to reflect the average deposition behavior of a high number (e.g., 10,000) of particles. In order to appropriately infer from a single deposition event to the entirety of inspired particles, the Monte Carlo technique as
well as the method of statistical weights are used (13-15). Concerning a quantification of particle deposition in single airway tubes and spherical alveolar structures, four main deposition mechanisms (Brownian motion, gravitational settling, inertial impaction, and interception) are distinguished. These mechanisms are theoretically approximated by both analytical and empirical formulae (13,16,17), which are summarized in Table 1. For an increased accuracy with regard to particle deposition in the extrathoracic and upper bronchial airways the equations of Cohen and Asgharian (18), Ingham (19), Stahlhofen et al. (20) as well as Cheng et al. (21) have been additionally used. Particle transport and deposition computations have been conducted by assuming all bronchial airway lengths and diameters to be scaled down to a standard FRC value of 3,300 mL. By inhalation of the tidal volume bronchial dimensions are believed to remain unaffected, whereas alveolar dimensions are subject to an anisotropic increase.
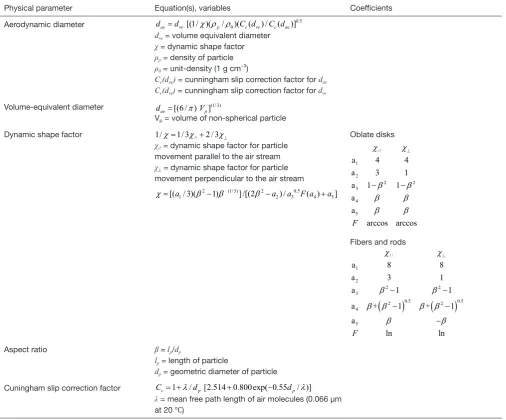
Theoretical approach to nonspherical particle behavior As mentioned in the introduction, most biogenic particles clearly deviate from ideal spherical shape, so that geometry-specific corrections have to be applied. These include the use of the aerodynamic diameter concept, where nonspherical particles are replaced by unit-density (1 g·cm−3) spheres with fully identical aerodynamic properties (22-30). The formula of the aerodynamic diameter listed in Table 2 includes several parameters which require a more detailed description. The dynamic shape factor, χ, represents the ratio of the drag force exerting on the nonspherical particle to the respective force exerting on a sphere with identical volume. Computation of this parameter may be carried out according to different equations, whose applicability depends on the aspect ratio, β, of the particles. Orientation of the particle relative to the inhaled air stream is expressed by a subdivision of the dynamic shape factor into a component aligned parallel to the streamlines, χ//, and a component aligned perpendicular
to the stream lines, χ⊥. For the simulation of random particle orientation χ// and χ⊥ are mathematically combined to the
parameter χr. In general, the dynamic shape factor adopts
values greater than 1 for particles with aspect ratios greater or smaller than 1. In the case of spherical particles χ//, χ⊥,
and, as a consequence of that, also χr uniformly amount to 1.
The Cunningham slip correction factor, CC, is required for
molecular regime. Therefore, this factor adopts high values for particles, whose sizes are smaller than the mean free path of air molecules (0.066 µm at 20℃), but approximates to 1 in the case of particles belonging to the micrometer scale (22-30).
Concerning to the equations listed in Table 2, aerodynamic diameters of highly anisometric particles (long fibers or thin platelets) with unit-density are always smaller than the related volume-equivalent diameters. If, on the other hand, values for particle density exceed those for the dynamic shape factor, aerodynamic diameter commonly adopts higher values than volume-equivalent diameter (22,23). In order to get a better impression of the aerodynamic diameter and its dependence on the cylindric particle diameter (note: fibers and platelets are assumed to take the shape of elongated and highly oblate cylinders) and aspect ratio, the reader is kindly
referred to Figure 2. This diagram will help to obtain a better understanding with regard to the following figures.
Lung scaling procedure
[image:4.595.46.549.97.476.2]In order to carry out appropriate deposition calculations for bioparticles inhaled by subjects with different ages, respective lung scaling procedures have been applied. These are based on a scaling factor which may be determined with the help of various empirical formulae (30-32). As exhibited in Table 3, the scaling factor is subject to an continuous increase from infants (SF =0.353) to adults (SF =0.840). As a consequence of this, also essential lung volumes (functional residual capacity, tidal volume) are characterized by significant enhancements. The same becomes true for breath-cycle time and the duration of breath-hold between inhalation and Table 1 Deposition equations used for the theoretical study and description of the parameters included in the formulae (12-16)
Mechanism Equation(s), variables Coefficients
Cylindrical tubes
Brownian motion pd= −1
∑
aiexp(
−b x ai)
− 4exp(
−b x4 2/3)
2/ 2
x LD R v=
D = diffusion coefficient
R = radius of the tube
L = length of the tube
v = mean flow velocity
a1 =0.819, b1 =7.32
a2 =0.098, b2 =44.61
a3 =0.033, b3 =114.0
a4 =0.051, b4 =79.31
Sedimentation 1 exp[ (4 2 cos ) /(9 )]
s
p = − − gC r Lρ ϕ πµRv
g = Acceleration of gravity (9.81 m s-2)
φ = Angle of tube relative to gravity
ρ = Density of the particle
C = cunningham slip correction factor
r = radius of the particle μ = viscosity of the fluid
Inertial impaction 1 (2 / )cos (1 ) (1/ )sin[2cos (1 )] for 1
i
p = − π − ΘSt + π − ΘSt Θ <St
1 for 1
i
p = Θ >St
Θ = branching angle
St = stokes number
Interception pint=a exp[ exp(− b c St− )] a =0.888, b =1.653, c =4.777
Alveolar spaces (uniform distribution of particles in the air, ideal alveolar mixing)
Brownian motion 1 (6 / ) (1/ ) exp(2 2 2 2 / )2
d
p = − π n −Dnπ t R
n = runs from 1 to ∞
D = diffusion coefficient
t = time
R = alveolar radius
Sedimentation 0.5( / 2 ) [3 ( / 2 ) ] 2 2 /
s s s s
p = u t R − u t R if t< R u
1 if 2 /
s s
p = t≥ R u
exhalation phase, whereas breathing frequency, representing the reciprocal of breath-cycle time, executes a remarkable decrease from infants to adults (31,32).
Results
Total and regional deposition of bioparticles in the lungs of subjects with different ages
Deposition computations were conducted by assuming a mean particle density of 0.75 g·cm−3 and aerodynamic
particle diameters ranging from 1 nm to 10 µm. In order to obtain more detailed information on particle behavior in the human respiratory tract, (I) a sitting breathing scenario was supposed (31) and (II) bioaerosol uptake through the nasal and oral path was simulated separately. By definition, total deposition corresponds to the number of inhaled particles subtracted with the number of exhaled particles (Ninh.–Nexh.). For calculation of regional deposition fractions
[image:5.595.47.554.102.522.2]the respiratory tract was subdivided into three main compartments, namely the extrathoracic compartment, the tracheobronchial compartment, and the alveolar Table 2 Mathematical formuale used for the description of possible influences of the particle geometry and size on deposition
Physical parameter Equation(s), variables Coefficients
Aerodynamic diameter 0.5
0
[(1/ )( / )( ( ) / ( )]
ae ve p c ve c ae
d =d χ ρ ρ C d C d
dve = volume equivalent diameter
χ = dynamic shape factor
ρp = density of particle ρ0 = unit-density (1 g cm−3)
Cc(dae) = cunningham slip correction factor for dae
Cc(dve) = cunningham slip correction factor for dve
Volume-equivalent diameter [(6 / ) ](1/3)
ae p
d = π V
Vp = volume of non-spherical particle
Dynamic shape factor 1/χ=1/ 3χ//+2 / 3χ⊥
χ// = dynamic shape factor for particle
movement parallel to the air stream
χ⊥ = dynamic shape factor for particle
movement perpendicular to the air stream
2 (1/3) 2 0.5
1 2 3 4 5
[( / 3)(a 1) ]/[(2 a) /a F a( ) a]
χ= β − β β − +
Oblate disks
(
)
(
)
// 1 2 3 4 5 // 2 2 2 2 0.5 0.5 1 2 2 4 2 3 5 4 4 3 1 1 1 arccos ar a a a a a a a a ccos 8 8 3 1 1 1+ 1 + 1
ln a a ln F F χ χ β β β β β β χ χ β β
β β β β
β β ⊥ ⊥ − − − − − − −
Fibers and rods
(
)
(
)
// 1 2 3 4 5 // 2 2 2 2 0.5 0.5 1 2 2 4 2 3 5 4 4 3 1 1 1 arccos ar a a a a a a a a ccos 8 8 3 1 1 1+ 1 + 1
ln a a ln F F χ χ β β β β β β χ χ β β
β β β β
β β ⊥ ⊥ − − − − − − −
Aspect ratio β = lp/dp
lp = length of particle
dp = geometric diameter of particle
Cuningham slip correction factor Cc= +1 λ/ [2.514 0.800exp( 0.55 / )]dp + − dp λ
λ = mean free path length of air molecules (0.066 µm
compartment.
Starting with the nose breathing scenario (Figure 3), partly significant differences between the studied age groups may be observed. Dependence of total deposition on particle size may be commonly decribed by U-shaped functions which become wider with decreasing age of the probands. In general, total deposition of infants (1 year) falls below that of adults (20 years) by 15–30%. Total deposition of children (5 years) is 5–10% higher than that of infants, whereas total deposition of adolescents (15 years) is already very similar to that of adults (Figure 3A). Extrathoracic deposition also exhibits a U-shaped correlation with particle size and
is characterized by a negative correlation with subject’s age. Whilst in adults this deposition fraction ranges from 11% to 92%, in infants it adopts values between 4% and 80%, corresponding to a difference of 7–12% (Figure 3B). Tracheobronchial deposition shows two maxima at particle sizes of 10 nm and 4 µm, respectively (bimodal deposition-size relationship). In adults related deposition fractions range from 3% to 28%, whereas in infants respective fractions between 0.1% and 2.5% are observed (Figure 3C). Alveolar deposition is also marked by a bimodal distribution with maxima being located at 10 nm and 4 µm. Deposition values range from 6% to 18% in adults, but only from 0.5% to 2% in infants (Figure 3D).
Inhalation of particles through the mouth has important consequences with regards to total and regional deposition (Figure 4). Compared to nasal inhalation total deposition is subject to a remarkable decline ranging from 5% to 15%. Whilst in adults between 12% and 95% of all inspired particles undergo deposition, in infants the same phenomenon is only realized for 0.5% to 68% of the incorporated particle fraction (Figure 4A). Most significant decrease may be recognized for extrathoracic deposition which varies between 0.5% and 56% in adults and between 0% and 30% in infants and thus undergoes an up to 50% loss (Figure 4B). Concerning tracheobronchial deposition a contrary tendency with respect to extrathoracic deposition may be noticed, because particle fraction accumulated in this compartment is subject to an increase. Bimodality of the deposition distribution is largely preserved, but respective maxima are shifted to smaller and larger particle sizes (Figure 4C). Particle deposition of adults commonly ranges
Table 3 Age-dependence of various lung parameters
Parameter
1 year 5 years 15 years Adult
SF 0.353 0.517 0.780 0.840
T (s) 1.39 2.00 3.24 4.17
BH (s) 0.00 0.00 0.50 1.00
BF (min-1) 43.2 30.0 18.5 14.4
FRC (mL) 244 767 2,650 3,300
TV (mL) 102 213 625 750
SF, scaling factor; T, breath-cycle time; BH, duration of breath-hold; BF, breathing frequency; FRC, functional residual capacity; TV, tidal volume.
from 2% to 43%, whereas that in infants varies between 0% and 26%. Compared to nasal bioaerosol inhalation also alveolar deposition fraction is dramatically increased in parts (except for infants), again showing a bimodal distribution. Respective deposition values range from 7% to 35% in adults, but only from 0% to 1% in infants (Figure 4D).
Generation-by-generation deposition of bioparticles with various sizes
In order to obtain a more detailed insight into the deposition of bioaerosol particles in the intrathoracic compartments, respective diagrams exhibiting the deposition behavior of these particles in airway generations 0 (= trachea) to 25 (= terminal/respiratory bronchioles) have been produced. Again, a differentiation between nasal and oral inhalation has been carried out. Deposition behavior of four different particle sizes (10 nm, 100 nm, 1 µm, 10 µm) has been investigated in this way.
Regarding the inhalation of bioparticles through the nose, airway generation-specific deposition of 10 nm particles
[image:7.595.131.506.85.368.2]varies between 0% and 5%, with highest deposition fractions being noticeable for adults and lowest deposition fractions occurring in infants (Figure 5A). Independent of the probands’ ages highest deposition values may be recognized at airway generation 15. Deposition of 100 nm particles is significantly lower than that of 10 nm particles and thus ranges from 0% and 3%. Maximum deposition may be located between airway generation 15 and airway generation 20 with respective variations between the studied age groups (Figure 5B). For 1 µm particles a further decrease in particle deposition may be recognized. Whilst in infants airway generation-specific deposition values vary between 0% and 0.1% and are therefore negligible, in adults these values exhibit a variation between 0% and 2%. Respective deposition maxima are again situated between airway generation 15 and airway generation 20 (Figure 5C). A strictly deviating deposition behavior may be attested for 10 µm particles, whose fraction of particles accumulated in the intrathoracic structures commonly ranges from 0% to 0.17% and is thus one order of magnitude lower than the deposition of 1 µm particles (Figure 5D). Whilst in adults maximum deposition occurs in the trachea, in younger Figure 3 Dependence of total (A), extrathoracic (B), bronchial (C), and alveolar (D) particle deposition on particle size expressed by the aerodynamic diameter. Computations are based on the assumptions of sitting breathing conditions and bioaerosol inhalation through the nose. Black, adult; dark grey, adolescent; middle grey, child; light grey, infant.
A
C
B
Figure 5 Generation-specific deposition of 10 nm (A), 100 nm (B), 1 µm (C), and 10 µm particles (D) under the assumption of sitting breathing conditions and bioaerosol inhalation through the nose. Black, adult; dark grey, adolescent; middle grey, child; light grey, infant.
A
B
[image:8.595.122.479.412.677.2]C
D
Figure 4 Dependence of total (A), extrathoracic (B), bronchial (C), and alveolar (D) particle deposition on particle size expressed by the aerodynamic diameter. Computations are based on the assumptions of sitting breathing conditions and bioaerosol inhalation through the mouth. Black, adult; dark grey, adolescent; middle grey, child; light grey, infant.
A
C
B
Figure 6 Generation-specific deposition of 10 nm (A), 100 nm (B), 1 µm (C), and 10 µm particles (D) under the assumption of sitting breathing conditions and bioaerosol inhalation through the mouth. Black, adult; dark grey, adolescent; middle grey, child; light grey, infant.
subjects two deposition maxima (trachea, airway generation 10) are observable.
By changing from nasal to oral inspiration of bioaerosols respective deposition curves are partly subject to significant modifications (Figure 6). In the case of 10 nm particles shapes of the deposition curves remain nearly unaffected, whereas intensity of deposition undergoes a remarkable increase. Concretely speaking airway generation-specific deposition varies between 0% and 6.8% and therefore shows an enhancement of up to 36% with respect to nasal inhalation (Figure 6A). Deposition of 100 nm particles is changed insofar as deposition maxima are noticeably broadened and include five or even more airway generations (Figure 6B). In the case of 1 µm particles deposition intensities are rather unaffected, but deposition maxima are also subjected to a significant broadening (Figure 6C). The most remarkable modification with respect to nasal inhalation, however, may be attested for 10 µm particles which exhibit deposition values ranging from 0% to 2.2%. Maximum deposition may be calculated for airway generation 10 (Figure 6D).
Discussion and conclusions
Particle deposition behavior among the studied age groups
As clearly demonstrated by the computations, total and regional deposition of bioparticles is subject to partly significant discrepancies between young probands (infants, children) and adults. Depending on the pathway of inhalation (nasal or oral) and the size of inspired aerosol particles, up to 100% of all particles may be deposited in the respiratory tract of adults and up to 80% in infants (Figures 3,4). This positive correlation between the extent of particle deposition and subject’s age is not limited to total deposition, but may be also observed for the accumulation of particulate mass in different compartments of the respiratory tract. Main reasons for this phenomenon consist in age-dependent differences of lung morphometry and breathing behavior (Table 3). Deposition of bioparticles adopting sizes below 100 nm is mainly controlled by Brownian motion, the efficiency of which depends on bronchial and alveolar morphometry as well as the time of particles residing in single lung structures (27-34). In
A
B
the lungs of infants and children smaller airway diameters are highly indicative of increased particle deposition by Brownian motion, but, on the other hand, reduced airway lengths and, as a consequence of that, also declined particle residence times in the bronchial structures commonly result in a reverse effect (13,24,30). This attenuation of deposition by Brownian motion is additionally supported by the significantly reduced breath-cycle lengths in infants and children (Table 3).
Bioparticles with sizes larger than 1 µm are increasingly deposited due to the influence of inertial impaction, interception and gravitational settling (30-34). All these deposition mechanisms are, directly or indirectly, affected by the velocity of the inhaled, particle-loaded airstream. In infants and children high breath-cycle frequencies and small airway calibers result in high deposition activity of micrometer-sized particles in the extrathoracic structures (21,22), so that intrathoracic impaction and gravitational settling become insignificant effects. In adults lower velocities of the inhaled airstream cause a noticeable reduction of extrathoracic particle filtering and thus an increasing number of deposition events in the intrathoracic structures (27-34).
As depicted in the graphs of Figures 3,4, inhalation of bioaerosols through the nose differs from oral aerosol inspiration insofar as particle filtering in the nasal and nasopharyngeal airways is characterized by remarkably higher efficiency than the respective filtering process in the oral and oropharyngeal structures. Earlier studies could clearly demonstrate that this phenomenon is related to the anatomy of the nasal path which is marked by higher complexity than the anatomy of the oral cavity and following structures (21,22,31). All particles passing the nasal airway structures are confronted with diverse obstacles ranging from hairs over the nasal conchae to extremely bended airway tubes (31).
Deposition of bioparticles in single airway generations strongly depends on the selected extrathoracic path (Figures 5,6). Concretely speaking, bioaerosol uptake via the mouth allows more particles to enter the bronchial and alveolar structures than bioaerosol uptake via the nose. Therefore, airway generation-specific deposition fractions are significantly higher in the first case than in the second. Highest deposition may be computed for 10 nm particles attaining a maximum value of 5% (nose breathing) and 7% (mouth breathing) in adults, but only 0.2% (nose breathing) and 1% (mouth breathing) in infants. The reason for these particles to act as highly depositive objects is given by the
circumstance that extrathoracic deposition is rather low with respect to total deposition, enabling more particles the entrance into the lung structures. For all other particle sizes investigated here, the ratio between extrathoracic and total deposition is less advantageous, so that lower particle numbers enter the lungs (31-34).
Health consequences of bioparticle uptake in the respiratory tract
An interesting question concerns the health consequences which are related to the uptake and deposition of bioparticles in the respiratory tract. As already mentioned in the introduction, bioaerosols may act as triggers of various diseases, among which allergic reactions and inflammations play the most important roles. In fewer cases also toxic reactions and malignant transformations of certain target tissues may be observed. In order to minimize the risk of bioaerosol-related insufficiencies the lung has developed some innate defense mechanisms which are subsumed unter the term “lung clearance” (35-39). In general, particulate masses deposited in the extrathoracic and upper bronchial airways are commonly cleared within several hours. Particles preferentially targetting the lower bronchial and bronchiolar airways usually need on average several days to weeks for their removal from the respiratory tract. Finally, particles with preferable deposition in the alveoli may remain in these structures for several months to years depending on their biosolubility and the possibility of their uptake by alveolar macrophages (40-44). Main factors for the development of lung diseases in association with inhaled bioaerosols include: (I) the type of incorporated bioparticle; (II) the compartment of the respiratory tract chiefly targeted by this particle; (III) the particle dose accumulated in the target region; and (IV) the time span provided to the particle for interacting with the tissue(s) of the target region (32-34).
Future perspectives
that the morphometry-related particle sorting effect in young subjects becomes rather relativized. Future contributions should therefore deal with total particle doses delivered to the lungs and with the significance of certain particle amounts for the development of lung insufficiencies.
Acknowledgements
None.
Footnote
Conflicts of Interest: The author has no conflicts of interest to declare.
Ethical Statement: This study was approved by the institutional ethic review board and informed consent was obtained from all patients.
References
1. Burge H. Bioaerosols: prevalence and health effects in the indoor environment. J Allergy Clin Immunol 1990;86:687-701.
2. Owen MK, Ensor DS, Sparks LE. Airborne particle sizes and sources found in indoor air. Atmos Environ 1992;26:2149-62.
3. Seltzer JM. Biologic contaminants. Occup Med 1995;10:1-25.
4. Husman T. Health effects of indoor-air microorganisms. Scand J Work Environ Health 1996;22:5-13.
5. Nevalainen A, Willeke K, Liebhaber F, et al. Bioaerosol Sampling. In: Willeke K, Baron PA, editors. Aerosol Measurement-Principles, Techniques, and Applications. New York: Van Nostrand Reinhold, 1993:471-92.
6. Olenchock SA. Health effects of biological agents: the role of endotoxins. Appl Occup Environ Hyg 1994;9:62-4. 7. Neef A, Amann R, Schleifer KH. Detection of microbial
cells in aerosols using nucleic acid probes. System Appl Microbiol 1995;18:113-22.
8. Heldal KK, Halstensen AS, Thorn J, et al. Upper airway
inflammation in waste handlers exposed to bioaerosols.
Occup Environ Med 2003;60:444-50.
9. Herr CE, Zur Nieden A, Jankofsky M, et al. Effects of bioaerosol polluted outdoor air on airways of residents: a cross sectional study. Occup Environ Med 2003;60:336-42. 10. Castellan RM, Olenchock SA, Kinsley KB, et al. Inhaled
endotoxin and decreased spirometric values. New Engl J
Med 1987;317:605-10.
11. Heederik D, Douwes J. Towards an occupational exposure limit for endotoxins. Ann Agric Environ Med 1997;4:12-9. 12. Sturm R. Modeling the deposition of bioaerosols with
variable size and shape in the human respiratory tract–A review. J Adv Res 2012;3:295-304.
13. Koblinger L, Hofmann W. Monte Carlo modeling of aerosol deposition in human lungs. Part I: Simulation of particle transport in a stochastic lung structure. J Aerosol Sci 1990;21:661-74.
14. Koblinger L, Hofmann W. Analysis of human lung morphometric data for stochastic aerosol deposition calculations. Phys Med Biol 1985;30:541-56. 15. Sturm R, Hofmann W. A computer program for the
simulation of fiber deposition in the human respiratory
tract. Compul Biol Med 2006;36:1252-67.
16. Yeh HC, Schum GM. Models of human lung airways and their application to inhaled particle deposition. Bull Math Biol 1980;42:461-80.
17. Carslow HS, Jaeger HC, editors. Conduction of Heat in Solids. Oxford: Clarendon Press, 1959.
18. Cohen BS, Asgharian B. Deposition of ultrafine particles
in the upper airways: An empirical analysis. J Aerosol Sci 1990;21:789-97.
19. Ingham DB. Diffusion of aerosols from a stream flowing
through a cylindrical tube. J Aerosol Sci 1975;6:125-32. 20. Stahlhofen W, Rudolf G, James AC. Intercomparison of
experimental regional aerosol deposition data. J Aerosol Med 1989;2:285-308.
21. Cheng KH, Cheng YS, Yeh HC, et al. In vivo
measurements of nasal airway dimensions and ultrafine
aerosol deposition in the human nasal and oral airways. J Aerosol Sci 1996;27:785-801.
22. Davies CN. Particle-fluid interaction. J Aerosol Sci
1979;10:477-513.
23. Kasper G. Dynamics and measurement of smokes. I Size characterization of nonspherical particles. Aerosol Sci Technol 1982;1:187-99.
24. Sturm R, Hofmann W. A theoretical approach to the
deposition and clearance of fibers with variable size in the
human respiratory tract. J Hazard Mater 2009;170:210-8. 25. Sturm R. Theoretical models for dynamic shape factors
and lung deposition of small particle aggregates originating from combustion processes. Z Med Phys 2010;20:226-34. 26. Sturm R. Nanotubes in the human respiratory tract–
Deposition modeling. Z Med Phys 2015;25:135-45. 27. Sturm R. A stochastic model of carbon nanotube
respiratory tract. Inhal Toxicol 2016;28:49-60.
28. Sturm R. Spatial visualization of theoretical nanoparticle deposition in the human respiratory tract. Ann Transl Med 2015;3:326.
29. Sturm R. Clearance of carbon nanotubes in the human respiratory tract—a theoretical approach. Ann Transl Med 2014;2:46.
30. Sturm R. Theoretical deposition of nanotubes in the respiratory tract of children and adults. Ann Transl Med 2014;2:6.
31. International Commission on Radiological Protection (ICRP). Human Respiratory Tract Model for Radiological Protection. Publication 66. Oxford: Pergamon Press, 1994. 32. Sturm R. Theoretical models of carcinogenic particle
deposition and clearance in children’s lungs. J Thorac Dis 2012;4:368-76.
33. Sturm R. Theoretical approach to the hit probability of
lung-cancer-sensitive epithelial cells by mineral fibers with
various aspect ratios. Thoracic Cancer 2010;3:116-25. 34. Sturm R. Deposition and cellular interaction of
cancer-inducing particles in the human respiratory tract: Theoretical approaches and experimental data. Thoracic Cancer 2010;1:141-52.
35. Hofmann W, Sturm R. Stochastic model of particle clearance in human bronchial airways. J Aerosol Med 2004;17:73-89.
36. Sturm R, Hofmann W. Mechanistic interpretation of the slow bronchial clearance phase. Radiat Prot Dosimetry
2003;105:101-4.
37. Sturm R, Hofmann W. A multi-compartment model for slow bronchial clearance of insoluble particles-extension of the ICRP human respiratory tract models. Radiat Prot Dosimetry 2006;118:384-94.
38. Sturm R. A computer model for the clearance of insoluble particles from the tracheobronchial tree of the human lung. Compul Biol Med 2007;37:680-90.
39. Sturm R. A three-dimensional model of tracheobronchial particle distribution during mucociliary clearance in the human respiratory tract. Z Med Phys 2013;23:111-9. 40. Sturm R, Hofmann W, Scheuch G, et al. Particle clearance
in human bronchial airways: comparison of stochastic model predictions with experimental data. Ann Occup Hyg 2002;46:329-33.
41. Sturm R, Hofmann W. Stochastic modeling predictions for the clearance of insoluble particles from the
tracheobronchial tree of the human lung. Bull Math Biol 2007;69:395-415.
42. Sturm R. Age-dependence and intersubject variability of tracheobronchial particle clearance. Pneumon 2011;24:77-84.
43. Sturm R. Theoretical and experimental approaches to the
deposition and clearance of ultrafine carcinogens in the
human respiratory tract. Thoracic Cancer 2011;2:61-8.
44. Sturm R. A computer model for the simulation of fiber–
cell interaction in the alveolar region of the respiratory tract. Compul Biol Med 2011;41:565-73.