Original Research Article
Comparing WHO C-Model generated C-Section probabilities to actual
delivery outcomes in a tertiary care centre
Amita Ray
1*, Arun Gopi
2, Sujoy Ray
3INTRODUCTION
Rising C-Section rates have been a matter for major concern all over the world.1-5 In 1985 WHO stated that a
C-section rate of above 15% is not justifiable at the same time stressed that every effort be made to provide C-Section when needed rather than aim for a particular rate.6 It is very difficult at the level of an individual
health care facility, particularly tertiary care centre to determine an appropriate rate of CS.4 When it comes to
such centres the C-Section rates have been found to be
universally higher both in the developed and the developing worlds.1-4 The reason could be due to
differences in the cases that that they deal with depending upon their geographical location, the obstetric profile of the cases, social and logistical factors This would make it difficult to have a generalized or uniformly appropriate C-Section rate.1-5
Since it is desirable that C-section should be definitely done when indicated at the same time the rate be kept at a minimum, it would be helpful for clinicians to know what
ABSTRACT
Background: A model which takes into account several relevant factors and gives the probability of C-Section in a woman would have the advantage of preparing for such an event. The identification of women at high risk of C-Section (>50% risk) would provide the opportunity for understanding risks involved in pursuing a vaginal delivery whereas if the risk of C-Section was less (<50%) it would prove useful in counselling for a vaginal delivery. We used the WHO C-Model with the aim to find the predictability of this model in our facility and the overuse of C-section in the 10 Robson’s Groups.
Methods: A retrospective observational study in which all women who gave birth at our hospital from June 2016 to May 2017 were included and C-Section probability was calculated using the C-Model. Comparison with the actual mode of delivery was done to find the sensitivity, specificity, positive and negative predictive value of the model and the overuse of C-Section in the Robson’s Groups.
Results: Out of the 314 C-Sections done only 45 women had a >50% probability, giving the model a sensitivity of 14.33%, specificity of 98.8%, positive predictive value of 90% and negative predictive value of 60.56%. Robson’s Groups 5 and 3 demonstrated the greatest overuse of C-Sections.
Conclusions: The WHO Model when applied to this centre showed a high positive predictive value for C-Sections but the negative predictive value or the ability to correctly predict a vaginal delivery was much less.
Keywords: C-Model, Negative predictive value, Positive predictive value, Robson’s Groups
1Department of Obstetrics and Gynecology, 2Department of Community Medicine, DM Wayanad Institute of Medical
Sciences, Wayanad, Kerala, India
3Department of Psychiatry, St. John’s Medical College, Bangalore, Karnataka, India
Received: 07 November 2017 Accepted: 02 December 2017
*Correspondence:
Dr.Amita Ray,
E-mail: [email protected]
Copyright: © the author(s), publisher and licensee Medip Academy. This is an open-access article distributed under the terms of the Creative Commons Attribution Non-Commercial License, which permits unrestricted non-commercial use, distribution, and reproduction in any medium, provided the original work is properly cited.
could be the probability of an operative delivery in an individual case.6 This would help the whole healthcare
team as well as the woman and her family to prepare both mentally and physically for the forthcoming birth process. Centres where facilities for operative delivery are not available would be able to refer such cases where the probability of a C-Section was high. Even for centres where facilities are available it would be good to know the probability of C-Section. Where probabilities were high an elective section could be offered knowing that maternal and foetal outcomes are better in elective versus emergency C-Sections.7-9
Many studies have retrospectively looked at predictors of C-Section and have found social, demographic, prenatal and other factors associated with risks for and a high incidence for C-Section delivery.10-13 A model which
takes into account several relevant factors and prospectively gives the probability of C-Section would have the advantage of preparing for such an event. It can provide an individualized assessment of the risk of C-Section which can better inform women in preparation for childbirth and may be useful in managing women’s expectations. The identification of women at high risk of C-Section (>50% risk) would also provide the opportunity for informed decision making about the risks associated with a vaginal delivery versus an elective C-Section. As maternal request for C-Section without specific maternal or fetal indication becomes more common, this risk assessment tool may also prove useful in counselling women with low risk to opt for a vaginal delivery.14
With this aim in mind we applied the WHO devised Model in our population to assess the probability of C-Section and compare this with the actual outcome. The WHO C Model adds socio-demographic data, severity markers and complications to the clinic-obstetrical data of the Robson’s classification as predictors to calculate the probability of C-Section in an individual patient.6
Using this Model to calculate C-section probabilities would help in assessing the utility of this model as regards its predictability. It would also help the health care team to identify the Robson’s Groups where the outcome (mode of delivery) coincided with the C-Model predicted probability and in which groups it did not. This information could then be utilized to develop a realistic approach towards reduction of C-section rates at the same time ensure that it is readily provided when the need arises. It would also help identify other factors which need to be considered when calculating or assessing the probability of C-Section in an individual woman.
Objective of present study were to determine the predictive utility of the C-Model in terms of sensitivity, specificity, positive and negative predictive value of the
METHODS
A retrospective observational study included women admitted for delivery at a teaching hospital in Wayanad, Kerala, India from June 2016 to May 2017. We calculated the overall C-Section rates as well as the percentage of C-Sections in each Robson’s Group to assess which Groups were the major contributors to the C-Sections. From each case file the demographic, obstetric and complicating factor information was fed into the Caluladora to get the probability of C-Section as per the WHO Model. All the subjects with a WHO C-Model probability of >50% have been considered as patients who need C-Section and women with probability <50% has been considered as patients who did not need a C-Section. The WHO model is basically a Logistic regression model and the logistic regression analysis usually considers the 50% as the cut off value
A sensitivity and specificity analysis were done to compare the WHO probability with the actual mode of delivery outcome in our women. The actual outcome has been considered as the reference and the WHO C-Model calculated probability (based on the cut off value of 50%) has been compared with it. In each of the 10 Robson’s Groups we identified the number and percentage of pregnant women with a WHO calculated probability of <50% who underwent a C-Section to identify which Robson’s Group exhibited overuse of C-Section.
RESULTS
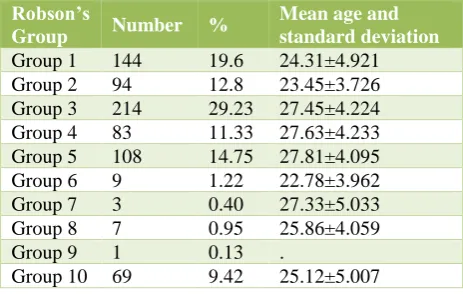
[image:2.595.312.544.510.657.2]Robson’s group 6 had a considerably a lower average age (22.78±3.96).
Table 1: Age, frequency and percentage of Robson’s groups.
Robson’s
Group Number %
Mean age and standard deviation
Group 1 144 19.6 24.31±4.921
Group 2 94 12.8 23.45±3.726
Group 3 214 29.23 27.45±4.224
Group 4 83 11.33 27.63±4.233
Group 5 108 14.75 27.81±4.095
Group 6 9 1.22 22.78±3.962
Group 7 3 0.40 27.33±5.033
Group 8 7 0.95 25.86±4.059
Group 9 1 0.13 .
Group 10 69 9.42 25.12±5.007
Table 2: Frequency and percentage of delivery outcomes.
Frequency Percentage
Vaginal 418 57.10
C-section 314 42.89
Total 732 100.00
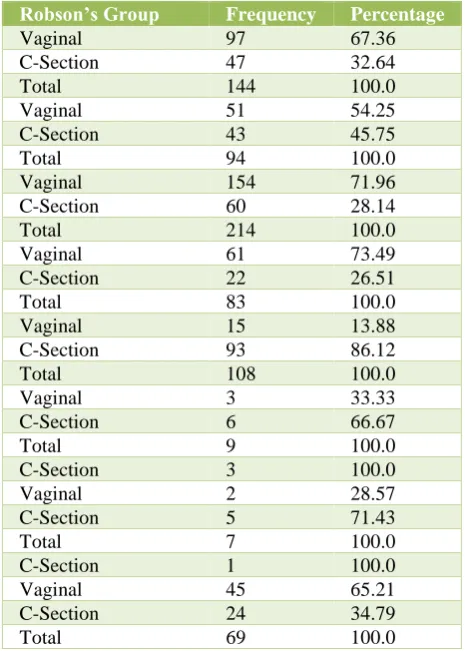
Group number 5 and 3 had the highest absolute number of C-Sections. (93 and 60 respectively). Percentage wise the greatest percentage of C-Sections was done in Group 5 and Group 8 (86.1% and 71.4% respectively) (Table 3).
Table 3: Frequency and percentage of delivery outcomes among different Robson’s groups.
Robson’s Group Frequency Percentage
Vaginal 97 67.36
C-Section 47 32.64
Total 144 100.0
Vaginal 51 54.25
C-Section 43 45.75
Total 94 100.0
Vaginal 154 71.96
C-Section 60 28.14
Total 214 100.0
Vaginal 61 73.49
C-Section 22 26.51
Total 83 100.0
Vaginal 15 13.88
C-Section 93 86.12
Total 108 100.0
Vaginal 3 33.33
C-Section 6 66.67
Total 9 100.0
C-Section 3 100.0
Vaginal 2 28.57
C-Section 5 71.43
Total 7 100.0
C-Section 1 100.0
Vaginal 45 65.21
C-Section 24 34.79
Total 69 100.0
Groups 5 and 3 had the highest number of such cases who underwent a C-Section with a <50% chance as calculated by the WHO-C Model (n=67 and n= 61 respectively) (Table 4).
Using the 50% cut off; Out of the 314 C sections done, only 45 subjects needed to undergo a CS as per the WHO probability (Low sensitivity of the C-Model).
Out of the 418 subjects who had a normal delivery at DMWIMS, only 5 had a more than 50% chance of a C-Section (High specificity of the C-Model).
Table 4: Frequency and percentage of C-Sections in each Robson’s Group where the probability of
C-Section by WHO-Model was <50%.
Robson’s groups Frequency Percentage
1 46 32.9
2 44 47.8
3 61 28.6
4 22 26.5
5 67 85.9
6 2 25.0
7 1 100.0
8 2 66.7
9 none
10 20 31.3
The probability of the WHO Model to correctly predict a C-Section in our population was only 14% while the probability of predicting vaginal delivery was 98.8% quite high.
The positive predictive value was 90% (The probability that the subjects who were supposed to undergo CS as per WHO calculation truly underwent C-Section).
The negative predictive value was 60.56% (The probability that the subjects who were supposed to have a normal delivery as per WHO calculation truly had the same) (Table 5).
Table 5: Sensitivity and specificity of the C-Model for predicting our mode of delivery outcome.
Mode of delivery
Total
CS Normal
Probability by WHO C-Model
C-Section (>50%) Count 45 5 50
% 14 1
C-Section (<50%) Count 269 413 682
% 86 99
Total 314 418 732
[image:3.595.50.543.627.727.2]DISCUSSION
Our overall C-Section rate for the study period was 43%. This though higher than the WHO recommended rate is quite in accordance with those found at tertiary care centres in both developed and developing countries.15-18
This is probably because it is the biggest referral centre in the district and this rate reflects the hospital C-Section rate rather than the population C-Section rate. To be truly reflective of the population C-Section rate the live births in other hospitals which refer operative cases to our centre due to lack of facilities would have to be taken into account. This would be true for any tertiary care centre around the world.5
During the study period our centre had the highest number of women in Robson’s Group 3 followed by Groups1 and 5. Studies done in other countries spanning different time periods have shown the same trend in the both the developed and the developing world.15,18
By way of contribution to the C-Section rate Group 5 followed by Group 3 had the highest contribution. Other such studies in the developed and developing world have found Group 5 to be the highest contributor followed by Group 1.15,18
As regards the application of the C-Model we would like to discuss our findings in two ways
Firstly, and considering the C-Model to be an accurate predictor of the route of delivery we will interpret our data as use and overuse of C-Section in our hospital Applying this Groups 5 and 3 (the two groups that are the largest contributors to the C-Section rates) have the greatest number of such cases who had a C-Section even though the calculated probability by the WHO C-Model was less than 50%. Other studies in different settings have also found this variation between the C-Model predicted probability and the actual delivery outcome in the Robson’s groups demonstrating an overuse of C-Sections. These studies have compared the mean predicted (by WHO Model) probability for each Robson’s group to the mean of the actual outcome in each group.19-22 Present study reports on the absolute
number of such cases in each Robson’s Group where the predicted mode of delivery did not coincide with the actual outcome using a 50% cut off. Using the C-Model either of the two ways has demonstrated an overuse in different settings and to different extents.
Secondly, we used our data to consider the predictive utility of the C-Model when applied to our circumstances. We did a sensitivity and specificity calculation taking the actual mode of delivery outcome of our women as the gold standard. The specificity and positive predictive value of the C-Model was high, but the sensitivity and
The greatest variation between the probability calculated by the WHO-C Model and the actual mode of delivery was observed in Group 5. This Group was also the second largest contributor to the total population of pregnant women who had live births. There were 144 women in this group out of which 93 underwent C-Section .Among those who underwent C-C-Section there were 67 such women who by WHO C-Model calculation had a less than 50% probability of a C-Section The indications for C-Section in these cases were foetal distress, dystocia or non progress, scar tenderness and C-Section on demand or on request.
Out of these 67 C-Sections 25 were done for non progress of labor and 16 of these babies had a birth weight ranging from 3.7-4.5kg (10 mothers had gestational diabetes). Another 12 of these 67 C-Sections were done on demand.
The C Model has not taken into consideration fetal anthropometric measurements. Studies looking at factors effecting C-Section rates and study authors developing predictive models for C-Sections have considered this as an important variable.13,14 Present study also seems to be
corroborating this. The specificity of the C-Model may be increased by incorporating this variable, particularly in context of the Group 5 which includes multiparous women with a previous scar. These women would also be likely to have gestational diabetes which is another reason for large babies.
Another variable that has come to light in this group is the on-demand C-Sections. This could be thought of a variable for a predictive value but could also be arguably an indicator for overuse
Some other variables have also been associated with increased C-Sections are maternal age height and BMI.13,14,20 We did not assess these variables in our
study.
CONCLUSION
As reported by other such studies the use of the WHO-C-Model could give important information about use and overuse of C-Sections in the 10 Robson’s Groups This information could be used to optimize C-Section rates in health care facilities.
The WHO Model when applied to this centre showed a high positive predictive value for C-Sections but the negative predictive value or the ability to correctly predict a vaginal delivery was much less. The predictive utility of the C-Model could be increased by
incorporating the important variables of foetal
Funding: No funding sources Conflict of interest: None declared
Ethical approval: The study was approved by the Institutional Ethics Committee
REFERENCES
1. Betran AP, Merialdi M, Lauer JA, Bing-Shun W,
Thomas J, Van Look P, et al. Rates of caesarean section: analysis of global, regional and national estimates. Paediatr Perinat Epidemiol. 2007;21:98-113.
2. Zizza A, Tinelli A, Malvasi A, Barbone E, Stark M, De
Donno A, et al. Caesarean section in the world: a new ecological approach. J Prev Med Hyg. 2011;52:161-73. 3. Litorp H, Kidanto H, Nystrom L, Darj E, Esse´ n B.
Increasing caesarean section rates among low-risk groups: a panel study classifying deliveries according to Robson at a university hospital in Tanzania. BMC Pregnancy Childbirth. 2013;13:107.
4. Souza JP, Betran AP, Dumont A, Mucio B, Pickens G,
Deneux‐Tharaux C et al. A global reference for caesarean section rates (C-Model): a multicountry cross-sectional study. BJOG. 2016;123:427-36.
5. Ray A, Jose S. Analysis of caesarean-section rates according to Robson's ten group classification system and evaluating the indications within the groups Int J Reprod Contracept Obstet Gynecol. 2017 Feb;6(2):447-51.
6. WHO Statement on Cesarean section rates. Available at
http://www.who.int/reproductivehealth/publications/mat ernal_perinatal_health/cs-statement/en/
7. Suwal A, Shrivastava VR, Giri A. Maternal and fetal outcome in elective versus emergency cesarean section. J Nepal Med Assoc. 2013 Oct- Dec;52(192):563-6. 8. Benzouina S, Boubkraoui ME, Mrabet M, Chahid N,
Kharbach A, El-hassani A et al. Fetal outcome in emergency versus elective cesarean sections at Souissi Maternity Hospital, Rabat, Morocco Pan. Afr Med J. 2016;23:197.
9. Elvedi-Gasparović V, Klepac-Pulanić T, Peter B.
Maternal and fetal outcome in elective versus emergency caesarean section in a developing country. Coll Antropol. 2006 Mar;30(1):113-8.
10. Berendzen JA, Howard BC. Association between
cesarean delivery rate and body mass index. Tenn Med. 2013;106:35-7.
11. Kambale MJ. Social predictors of caesarean section births in Italy. Afr Health Sci. 2011 Dec;11(4):560-5. 12. Harlow BL, Frigoletto FD, Cramer DW, Evans JK,
Bain RP, Ewigman B et al. Epidemiologic predictors of cesarean section in nulliparous patients at low risk. RADIUS Study Group. Routine Antenatal Diagnostic Imaging with Ultrasound Study. Am J Obstet Gynecol. 1995 Jan;172(1 Pt 1):156-62.
13. Turcot L, Marcoux S, Fraser WD. Multivariate analysis of risk factors for operative delivery in nulliparous
women. Canadian Early Amniotomy Study Group. Am J Obstet Gynecol. 1997 Feb;176(2):395-402.
14. Burke N, Burke G, Breathnach F, McAuliffe F,
Morrison JJ, Turner M et al. Prediction of cesarean delivery in the term nulliparous woman: results from the prospective, multi-center Genesis study. Am J Obstet Gynecol 2017;216:598.e1-11.
15. Joshua PV, Betrán AP, Vindevoghel N, Souza JP, Torloni MR, Zhang J et al. Use of the Robson classification to assess caesarean section trends in 21 countries: a secondary analysis of two WHO multi country surveys. Lancet. 2015;(3):260-70.
16. Abdel-Aleem H, Darwish A, Abdelaleem AA, Mansur H. Usefulness of the WHO C-Model to optimize the cesarean delivery rate in a tertiary hospital setting. Int J Gynecol Obstet. 2017 Apr 1;137(1):40-4.
17. Ribeiro V, Figueiredo F, Silva A, Bettiol H, Batista R, Coimbra L, et al. Why are the rates of cesarian section in Brazil higher in more developed cities than in less developed ones? Brazilian J Med Biologic Res. 2007;40:1211-20.
18. Cavallaro FL, Cresswell JA, França GVA, Victora CG,
Barros AJD, Ronsmans C. Trends in caesarean delivery by country and wealth quintile: cross-sectional surveys in southern Asia and sub Saharan Africa. Bulletin of World Health Organization. 2013 Dec;91(12):914-22D. 19. National Center for Health Statistics. User Guide to the
2010 Natality Public Use File. Hyattsville, Maryland: National Center for Health Statistics. Annual product
2012. Available at
http://www.cdc.gov/nchs/data_access/VitalStatsOnline. htm. Accessed January 20, 2016.
20. Ota E, Haruna M, Suzuki M, Anh DD, Tho LH, Tam NT et al. Maternal body mass index and gestational weight gain and their association with perinatal outcomes in Vietnam. Bull World Health Organ. 2011;89:127-136.
21. Souza JP, Gülmezoglu A, Lumbiganon P, et al.
Caesarean section without medical indications is associated with an increased risk of adverse short-term maternal outcomes: The 2004-2008 WHO Global Survey on Maternal and Perinatal Health. BMC Med. 2010;8:71.
22. Blondel B, Lelong N, Kermarrec M, Goffinet F. The National Coordination Group of the National Perinatal Surveys. Trends in perinatal health in France from 1995 to 2010. Results from the French National Perinatal Surveys. J Gynecol Obstet Biol Reprod (Paris). 2012;41:e1-e15.