Volume 9, No. 1, January-February 2018
International Journal of Advanced Research in Computer Science
RESEARCH PAPER
Available Online at www.ijarcs.info
ISSN No. 0976-5697
SENTIMENT ANALYSIS USING A NOVEL APPROACH TO CLASSIFY
SENTIMENTS IN SOCIAL NETWORKING DATA
P. Bavithra Matharasi
Lecturer, Dept. of MCA, Mount Carmel College,
Bangalore, India
Dr. A. Senthilrajan
Director, Computer Centre Alagappa University,
Karaikudi, India
Abstract: Sentiment analysis is the task of finding polarity in the given document. The document could be a sentence, a paragraph or a document with number of pages. Polarity of the document could be positive, negative or neutral. This polarity reflects the mood and emotions of the user. Twitter is the most popular social media today. It is the biggest platform for communication. In this research, tweets from twitter is taken for sentiment analysis. The biggest challenge lies in identifying the document accurately for its polarity. There are number of machine learning algorithms available using supervised or semi supervised technique. These algorithms apply unigram, bigram, n-gram or hybrid approach. Semi supervised learning is being used for this research paper. In this work, unigram and bigram approach are combined together to form novel model that uses Naïve Bayes approach and results were found. This novel approach gave a better result. A time based analysis was also performed in order to find the day wise polarity of the tweets
Keywords: sentiment analysis, Naïve Bayes, opinion mining, cross validation
I. INTRODUCTION
Sentiment analysis using unigram approach, can recall that sentiment analysis also known as opinion mining, is meant to analyze the opinion of people towards any topics like products, organizations and other related attributes. In this present day, social media plays an enormous role in providing quality information about any topics ranging from different reviews blogs and comments. This paper would produce a supervised learning method on labeled data. The label would mean the tweets and the time. Twitter is a rich source of unstructured data. In this novel method using Naïve Bayes approach, the data is first grabbed from twitter using NodeXL, then some manual preprocessing needs to be done, i.e. all unwanted columns need to be removed and only tweets need to be kept. These tweets will then go under vector format where the text data can be converted into matrix of numbers. As mentioned unigram approach in the previous chapter, this bigram approach will evaluate the unigram approach first, then perform a bigram operation and give a combined result in the form of a graph. The method that is being used in this bigram approach is still the Naïve Bayes, which yields a better accuracy than the normal Bayes algorithm.
II. LITERATURESURVEY
Sentiment analysis is a branch of study from the field of opinion mining. Number of researchers worked under these fields to bring out the best outcome. A survey has been done to analysis about the technique and tools available in sentiment analysis. J.M. Weibe [1], the researcher brings out different algorithms in best identification of sentiment analysis. M. A. Hearst [2] had come up with adding intelligence to sentiment analysis. Different machine learning methods are being used by researchers. Researcher V. Suresh [3] presented an approach that used stop words and gaps between stop words as
the feature for sentiment analysis. Murthy G. and Bing Liu [4] made a comparative study on sentences and web context based sentiments. The authors Pang 2002[5] and Matsumoto 2005[6] suggested with unigram approaches in their research work. Dave, Lawrence and Pennock [7] used a tool to synthesize reviews. Matsumoto, Takamura and Okumura [9] researched on document level syntactic relationship among the words was found by them. Liu and Chen [10] proposed multilevel classification on sentiment analysis. Harvinder Jeet Kaur and Rajiv Kumar [11] researched on different methods to perform automatic polarity classification of textual data. Xiaoming Gao, Emilio Ferrara, and judy Qiu [12] wanted to show that a powerful general software subsystems will enable many other applications that need integration of streaming and batch data analytics. J. Prabhu and M. Sudharshan and M. Saravanan and G. Prasad [13] discussed about the use of Rapid clustering Method to analyze the characteristics in social network. Xin Chen, Krishna Madhavan and Mihaela Vorvoreanu [14] used a special system called Social Web Analysis Buddy (SWAB) to analyse student-posted content on Social Media sites to facilitate the understanding of human behaviours and social tendencies.
III. TWITTER DATA
to make requests for establishing a connection to the API instead of the user manually doing so every time or to test the functionality of the API from a single user.
IV. NAÏVE BAYES APPROACH
Naïve Bayes model is very easy to build and it is best suitable method while using or working with large data sets. It is known for its simplicity. Though it is very simple to build, it out performs than various other data classification algorithms. It provides a way for classifying and calculating the subsequent probability [8]. It is a statistical model that uses probabilistic equation for classification. Given the equation, Equation 1
Above,
• P (c|x) is the subsequent probability
of class (c, target) given predicator (x, attributes). • P(c) is the prior probability of class.
• P (x|c) is the possibility, which remains the
probability of predictor given class. • P(x) is the former probability of predictor.
V. SYSTEM DESIGN
To implement this new method, a desktop application is developed using Microsoft visual Studio along with C# programming language. A simple windows form is designed that takes the input file and produces the result in the graph format. The tweets will contain noisy data like, smiley, abbreviations, URLs, emoticons, special character, different language words and many others. This implementation accepts the input file in which these noisy data are removed manually. Only the English sentences are stored in the excel file. In order to be read correctly by the program, the following structure needs to be followed.
• The file that is given as input should be a .xls (Microsoft Excel File)or .csv file
• The dataset should first contain the column of tweets and the next column of the tweeted date
• The first column (tweets) can contain any type of data as long as it’s the tweet itself.
• The second column should only be of the type date. A. Data Collection Tool
NodeXL Basic is a free, open-source template extension for Microsoft Excel 2007 and above versions that makes it easy to generate datasets from social media platforms and analyze it. With NodeXL, graphs are generated on click, all in the already used to working environment of the Excel window. This tool is used for collecting tweets.
B. Development Tool
Microsoft Visual Studio, C# and .NET Framework: Built by Microsoft, Visual Studio is an Integrated Development Environment (IDE) that provides as set of development tools for developing .NET web applications, XML Web Services, desktop applications, and mobile applications. Developing has become easier and time saving with the help of visual studio. Lot of features provided such as intelliSense, designers and debugging. C# is an object programming language that is designed to be fully compatible with Microsoft .NET framework. .NET framework is a software framework that
consists of a large library and language interoperability between several programming languages. Large number of common functions is found in the base class library.
VI. CROSSVALIDATIONS
Cross-validation is a technique used in evaluation of predictive models. In a prediction problem, a model is usually given a dataset of known data on which training is run and a dataset of unknown data against which the model is. It is also called as rotation estimation [15][17][18] It is based on the principles of testing the algorithm on a new dataset that yields a better estimate of its performance. The samples used for training are split into validation samples and training samples. Cross-validation combines (averages) measures of fit (prediction error) to derive a more accurate estimate of model prediction performance [16]. The training samples are used to train the algorithm and the validation samples is used as new data to evaluate the performance and working of the algorithm. This algorithm is implemented in such a way that it can run, three cross validation methods:
• Holdout method
• K-fold cross validation • Leave-one-out cross validation
Naïve Bayes system is designed using windows forms that read an input file .xls containing the data set (tweets). The input dataset is split into training set and test set. The training set is then used to calculate the probabilities of each class. The conditional probabilities of each class are calculated using single instance from the test set. Posterior probabilities of each class are then
A. Holdout Method
One of the simplest types of validation where the dataset is split into two sets, namely, the training set and the validation set. The algorithm is trained using the training set only. Data is then evaluated by the algorithm using the validation set. The evaluation can have a high variance as the evaluation may depend solely on the data that is present in the training set.
B. K-Fold Cross Validation
K-fold cross validation acts as an improvement of the hideout method. The dataset is repeated k times and divided into k subsets in k-fold cross validation method. In each instance only one of the k sets are used and the remaining k-1 sets are put together to form the training set. The errors across all the trails are then averaged. The disadvantage of K-fold cross validation method is that it takes ‘k’ times more computational time than because the algorithm is meant to run k times.
C. Leave-One-Out Cross Validation (LOOCV) The extremely logical form of k-fold crosses validation where k equals the number of data points. The training on the algorithm is done on all data points except for one. LOOCV can be computationally costly on the grounds since it is basically obliges one to build many models — measure up to in number to the extent of the training set.
Applying the Bayes theorem from
Equation 1 to this function gives (𝐶𝐶 = 𝑐𝑐 | 𝑿𝑿 = 𝒙𝒙) = (𝑿𝑿=𝒙𝒙 |𝐶𝐶=𝑐𝑐) (𝐶𝐶=𝑐𝑐) (𝑿𝑿=𝒙𝒙)
Since P(X = x) is the same for all classes it can be ignored. Hence, the Bayes’ discriminant function can be written as 𝑓𝑓∗(𝒙𝒙) = 𝑃𝑃(𝑿𝑿 = 𝒙𝒙 |𝐶𝐶 = 𝑐𝑐) 𝑃𝑃(𝐶𝐶 = 𝑐𝑐),
where 𝑃𝑃(𝑿𝑿 = 𝒙𝒙 |𝐶𝐶 = 𝑐𝑐) 𝑃𝑃(𝐶𝐶 = 𝑐𝑐) is called the class-conditional probability distribution (CPD).
Eq. 2 finds the maximum posterior probability hypothesis given x.
ℎ∗(𝒙𝒙) = arg𝑚𝑚𝑎𝑎𝑥𝑥𝑐𝑐𝑃𝑃(𝑿𝑿 = 𝒙𝒙 |𝐶𝐶 = 𝑐𝑐) 𝑃𝑃(𝐶𝐶 = 𝑐𝑐) (Eq. 3)
Applying the assumption that features are independent given the class on Eq. 2, the naïve Bayes classifier can get.
𝑓𝑓𝑐𝑐 (𝒙𝒙) = ∏ (𝑋𝑋𝑗𝑗 = 𝑥𝑥𝑗𝑗 |𝐶𝐶 = 𝑐𝑐) (𝐶𝐶 = 𝑐𝑐) 𝑛𝑛𝑗𝑗=1
VII. ALGORITHM
START
Select cross validation method Add Input file. Read
Cond1- Success Input? YES/ NO
If YES, Is k-fold cross validation? YES /NO Cond1- if NO, Throw error message. Goto step3
Cond2- If YES, create Training set and test set Taken data from
If NO, divide dataset into k sets. C.
Data from
Calculate prior probabilities from training set C.
From B,
Calculate posterior probabilities for each class
Calculate conditional probabilities for features values in test data
A
-Cond3-is end of test set? YES /NO Classify. Display the result.
If YES, Calculate Accuracy If NO, goto STEP 11 Display Accuracy Generate Graphs
Cond4- If k-fold cross validation? YES / NO If YES, Cond5- Is last set? YES / NO Cond5- If YES, END.
Cond5- If NO, Goto STEP8 Cond4- If NO, END STOP
VIII. RESULTSOFNOVELAPPROACH
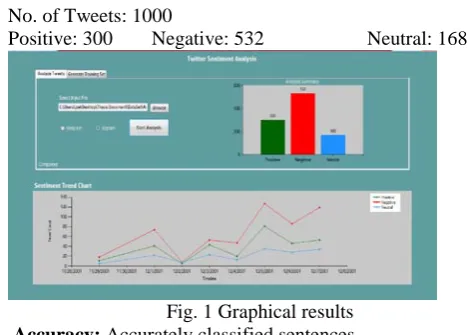
Name of the Database: AMAZON.xlsx No. of Tweets: 1000
[image:3.595.325.539.55.230.2]Positive: 300 Negative: 532 Neutral: 168
Fig. 1 Graphical results Accuracy: Accurately classified sentences
(TP+TN)/total = (300+532)/1000 = 832/1000 = 0.832 • Error Rate: Wrongly classified sentences (FP+FN)/total = (200-32)/1000 = 168/1000 = 0.168
Name of the Database: IMDB.xlsx No. of Tweets: 1000
[image:3.595.317.546.362.529.2]Positive: 375 Negative: 471 Neutral: 154
Fig. 2 Graphical results
• Accuracy: Accurately classified sentences o (TP+TN)/total = (375+471)/1000 = 846/1000 = 0.846 • Error Rate: Wrongly classified sentences
o (FP+FN)/total = (125+29)/1000 = 154/1000 = 0.154
Name of the Database: YELP.xlsx No. of Tweets: 1000
Positive: 362 Negative: 499 Neutral: 139
Fig. 3 Graphical results
• Accuracy: Accurately classified sentences o (TP+TN)/total = (499+362)/1000
= 861/1000 = 0.861 • Error Rate: Wrongly classified sentences
o (FP+FN)/total = (138+1)/1000 = 139/1000 = 0.139
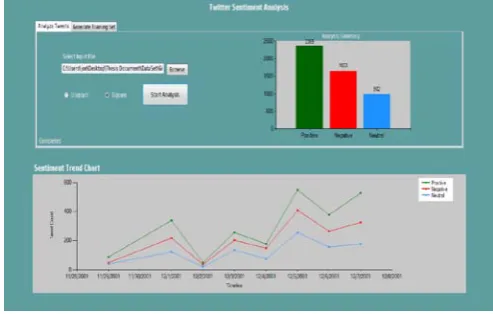
[image:3.595.32.266.518.685.2]Fig. 4 Graphical results
Positive: 2365 Negative: 1653 Neutral: 982
• Accuracy: Accurately classified sentences o (TP+TN)/total = (2365+1653)/5000
= 4018/5000 = 0.8036 • Error Rate: Wrongly classified sentences
o (FP+FN)/total = (135+847)/5000 = 982/5000 = 0.1964
Database: GitHub Dataset 2.xlsx No. of Tweets: 11000
Positive: 4921 Negative: 4345 Neutral: 1734
Fig. 5 Graphical results • Accuracy: Accurately classified sentences
o (TP+TN)/total = (4921+4345)/11000 = 9266/11000 = 0.8424 • Error Rate: Wrongly classified sentences
o (FP+FN)/total = (579+1155 )/11000 = 1734/11000 = 0.1576 Database: Achedin.xlsx
No. of Tweets: 53000
Positive: 23794 Negative: 18426 Neutral: 10780
Fig. 6 Graphical results
• Accuracy: Accurately classified sentences o (TP+TN)/total = (23794+ 18426)/ 53000
= 42220/53000 = 0.7966 • Error Rate: Wrongly classified sentences
o (FP+FN)/total = (4206+6574 )/ 53000 = 10780/53000 = 0.2034
Database: GeneralData.xlsx No. of Tweets: 100000
Positive: 44906 Negative: 39416 Neutral: 15678
Fig. 7 Graphical results
• Accuracy: Accurately classified sentences o (TP+TN)/total = (44906+39416)/ 100000
= 84322/100000 = 0.8432 • Error Rate: Wrongly classified sentences
o (FP+FN)/total = (5094+10584)/ 100000 = 15678/100000 = 0.1568
IX. CONCLUSION
[image:4.595.316.550.57.252.2]X. REFERENCE
[1] Wiebe Janyce “Identifying subjective characters in narrative, Proceedings of the International Conference on Computational Linguistics (COLING-1990).” 1990. [2] Hearst M., 1992, Direction-based text interpretation as an
information access refinement in TextBased Intelligent Systems, P. Jacobs, Editor 1992, Lawrence Erlbaum Associates, 257-274.
[3] V. Suresh 2011, A Non-syntactic Approach for Text Sentiment Classification with Stopwords, WWW 2011,March 28–April 1, 2011,Hyderabad, India
[4] Murthy G. and Bing Liu, 2008, Mining opinions in comparative sentences, Proceedings of the 22nd international conference on computational linguistics (Coling 2008), Manchester, August 2008, 241248.
[5] B. Pang L. Lee, and S. Vaithyanathan., “sentiment classification using machine learning techniques” 2002. [6] Matsumoto and Takamura, “syntax-based features
construct parse trees” , 2005
[7] Dave, Lawrence &Pennock, “Opinion extraction and semantic classification of product reviews”, 2003
[8] Beineke P., Hastie &Vaithyanathan “Improve review classification via human-provided information”, 2004 [9] Matsumoto, Takamura and Okumura “Advances in
knowledge discovery and data mining”, 2005
[10] Liu, Chen “Multi label classification based approach for sentiment classification”, 2015
[11] Ms Harvinder JeetKaur and Mr. Rajiv Kumar, Sentiment Analysis from Social Media in Crisis Situations,
International Conference on Computing, Communication and Automation (ICCCA2015).
[12] Xiaoming Gao, Emilio Ferrara, and judyQiu, Parallel Clustering of High-Dimensional Social Media Data Streams, 2015 15th IEEE/ACM International Symposium on Cluster, Cloud and Grid Computing
[13] J. Prabhu and M. Sudharshan and M. Saravanan and G.Prasad, Augmenting Rapid Clustering Method for Social Network Analysis, 2010 International Conference on Advances in Social Networks Analysis and Mining. [14] Xin Chen, Krishna Madhavan and Mihaela Vorvoreanu, A
Web-Based Tool for Collaborative Social Media Data Analysis, 2013 IEEE Third International Conference on Cloud and Green Computing
[15] Geisser, Seymour (1993). Predictive Inference. New York, NY: Chapman and Hall. ISBN 0-412-03471-9. [16] Grossman, Robert; Seni, Giovanni; Elder, John; Agarwal,
Nitin; Liu, Huan (2010). Ensemble Methods in Data Mining: Improving Accuracy through Combining
Predictions. Morgan &
Claypool. doi:10.2200/S00240ED1V01Y200912DMK002 [17] Kohavi, Ron (1995). "A study of cross-validation and
bootstrap for accuracy estimation and model selection". Proceedings of the Fourteenth International Joint Conference on Artificial Intelligence. San Mateo, CA: Morgan Kaufmann. 2 (12): 1137–1143.