Page 1 of 15 Original Article
The application of weighted gene co-expression network analysis
in identifying key modules and hub genes associated with disease
status in Alzheimer’s disease
Yan Sun, Jinghan Lin, Liming Zhang
Department of Neurology, The First Affiliated Hospital of Harbin Medical University, Harbin 150000, China
Contributions: (I) Conception and design: L Zhang; (II) Administrative support: Y Sun, J Lin; (III) Provision of study materials or patients: Y Sun; (IV) Collection and assembly of data: Y Sun, J Lin; (V) Data analysis and interpretation: All authors; (VI) Manuscript writing: All authors; (VII) Final
approval of manuscript: All authors.
Correspondence to: Liming Zhang. Ward 4, Department of Neurology, The First Affiliated Hospital of Harbin Medical University, No. 23, Postal Street, Nangang District, Harbin 150000, China. Email: zfx0001@126.com.
Background: Alzheimer’s disease (AD) is the most common neurodegenerative condition that affects more than 15 million individuals globally. However, a predictive molecular biomarker to distinguish the different stages of AD patients is still lacking.
Methods: A weighted gene co-expression network analysis (WGCNA) was employed to systematically identify the co-expressed gene modules and hub genes connected with AD development based on a microarray dataset (GSE1297) from the Gene Expression Omnibus (GEO) database. An independent validation cohort, GSE28146, was utilized to assess the diagnostic efficiency for distinguishing the different stages of AD. Quantitative real-time reverse transcription polymerase chain reaction (qRT-PCR) and western blotting analysis were applied to examine the mRNA and protein level of GRIK1, respectively, in AD mice established with the expression of mutant amyloid precursor protein and wild type mice. The morphology of neurons was investigated using phalloidin staining.
Results: We identified 16 co-expressed genes modules, with the pink module showing significant association with all three disease statuses [neurofibrillary tangle (NFT), BRAAK, and mini-mental state examination (MMSE)]. Enrichment analysis specified that these modules were enriched in phosphatidylinositol 3-kinase (PI3K) signaling and ion transmembrane transport. The validation cohort GSE28146 confirmed that six hub genes in the pink module could distinguish severe and non-severe AD patients [area under the curve (AUC) >0.7]. These hub genes might act as a biomarker and help to differentiate diverse pathological stages for AD patients. Finally, one of the hubs, GRIK1, was validated by an animal AD model. The mRNA and protein level of GRIK1 in the AD hippocampus was increased compared with the control group (NC) hippocampus. Phalloidin staining showed that dendritic length of the GRIK1 pCDNA3.1 group was shorter than that of the NC group.
Conclusions: In summary, we systematically recognized co-expressed gene modules and genes related to AD stages, which gave insight into the fundamental mechanisms of AD progression and revealed some probable targets for the treatment of AD.
Keywords: Alzheimer’s disease (AD); weighted gene co-expression network analysis (WGCNA); pathological
stage; gene modules
Submitted Aug 30, 2019. Accepted for publication Nov 26, 2019.
doi: 10.21037/atm.2019.12.59
Introduction
Alzheimer’s disease (AD), as the most common
neurodegenerative condition, affects more than 15 million
people worldwide (1,2) and is characterized by progressive
memory loss and cognitive deterioration (1,3). Deposits
of extracellular amyloid plaques made of amyloid-β and
neuronal intracellular neurofibrillary tangles (NFTs)
composed of the protein tau are the primary pathological manifestations of AD (4).
AD can be divided into six stages, called Braak stages, based on the site of the tangle-bearing neurons and the
rigorousness of modifications. The stages are defined as
follows: I–II (transentorhinal stages), clinically silent cases; III–IV (limbic stage), incipient AD; and V–VI (neocortical
stages), fully developed AD (3,5). The mini-mental state examination (MMSE) is a cognitive test used to screen and
monitor dementia progression, such as that found in AD.
It has been reported that a score below 24 of a possible 30
is indicative of dementia (6), and non-demented elderly patients usually score outside this range at 24 or above.
The NFT scoring system is another related measure that is
usually in accordance with Braak stages, with NFT III stage being indicative of AD (7).
Many researchers have found comprehensive evidence of the molecular pathogenesis of AD, and this information
has been converted into promising treatment approaches,
including immunotherapy using amyloid‐β, which is being tested clinically (8). To understand the biology of
AD and to provide measures of relevant pathophysiology
in living individuals, biomarkers are becoming increasingly important in both AD patients and pre-symptomatic individuals. For AD patients, the biomarkers in the cerebrospinal fluid (CSF) are divided into basic and core biomarkers (9). Basic biomarkers comprise assays for blood-brain barrier (BBB) status and inflammatory methods, which have been developed to recognize disorders that may mimic or coincide with AD, for example, neuroborreliosis. Meanwhile, core biomarkers are used to recognize the chief
pathogenic progressions of AD patients, and mainly reflect NFT and amyloid pathology, or axonal degeneration, such as Aβ1–42 (10,11), total tau levels (12,13), and phosphorylated tau levels (phosphorylated at thr181 or thr231) (14,15). Apart from aβ and tau, many other novel candidate
biomarkers have been recognized for CSF biomarkers (16). These included β site APP cleaving enzyme 1 (BACE1), which is the chief enzyme accountable for β-secretase activity; amyloid-β oligomers, the accumulation of which
can form insoluble fibrillar Aβ in plaques; truncated amyloid-β isoforms, the most available aβ isoform in the
CSF; and neuronal and synaptic markers, such as visinin-like protein 1, synaptotagmin, and growth-associated
protein (9). It has been a challenge for independent studies to confirm the role of biomarkers in AD in peripheral blood; however, numerous candidate blood biomarkers have been anticipated.
Traditional studies of the mechanisms and biomarkers of AD predominantly emphasize a single gene or a specific pathway. However, the growth and advancement of AD is a complex process that is controlled by the accumulative impact of a sequence of genes and their interrelations.
As per the theory that genes with an analogous expression pattern might have same functions or take part in common
cascades (17), the weighted gene co-expression network analysis (WGCNA) has emerged as an active approach for
understanding the associations among diverse gene sets or among gene sets and clinical features (18,19). WGCNA has been extensively utilized in finding the hub genes related to
the clinical features of various diseases (20-22).
In this study, WGCNA was implemented to conjointly
examine clinical evidence and microarray records of AD
patients’ samples for the purpose of recognizing vital
genes related to medical features. These vital genes may
have essential clinical implications and be informative as investigative and predictive biomarkers or treatment targets. Finally, one of the hub genes, glutamate ionotropic receptor kainate type subunit 1 (GRIK1), was validated by an animal AD model, with the results showing that the mRNA and protein level of GRIK1 in the AD hippocampus
was increased compared with control (NC) hippocampus. Phalloidin staining showed that dendritic length of GRIK1 pCDNA3.1 group was shorter than the NC group.
Methods
Data collection and preprocessing
Two expression profile data sets of AD were acquired from the Gene Expression Omnibus (GEO) database. Datasets GSE1297 and GSE28146, which focus on critical early stages, were chosen for further study (23,24). The GSE1297 dataset was utilized for AD-correlated modules and gene selection. Another dataset was used for independent
verification.
per the annotation platform of each expression profile. If
there were numerous probes, which mapped to the similar gene symbol, their mean value was regarded as the gene manifestation value. Consequently, 12,502 unique genes representing the expression profiles of GSE1297, and 20846 unique genes representing GSE28146, were used for
analysis.
In addition, as a common challenge in examining
genome-wide expression data is managing batch effects, it is necessary to continuously monitor for batch effects whenever entirely analogous processing of samples is impossible. These data were normalized by means of the normalizeBetweenArrays() function in the limma library in R. After screening out the genes with the highest median absolute deviation (MAD) of 75%, 9,974 genes remained from GSE1297.
Co-expression module detection
The hclust() function in the stats library in the R was used to perform cluster analysis of the samples with the suitable threshold value to both identify and eliminate the outliers. The gradient method was utilized to examine
the independence and the average degree of connectivity
of the numerous modules with diverse power values (the power values oscillated from 1 to 30). Once the suitable power value had been recognized when the degree of independence was 0.85, the module creation continued with the WGCNA process. Module identification was achieved by means of the dynamic tree cut method. The least number of genes was fixed at 30 to confirm greater dependability. Successively, the information relating to the analogous genes in each module was obtained.
Module and clinical trait association analysis
The WGCNA algorithm uses module eigengenes (MEs) to evaluate the possible relationship of gene modules with clinical traits. MEs were defined as the primary key constituents computed by means of principal component
analysis that recapitulates the manifestation of genes of a specific module into a single characteristic expression profile. The manifestation configurations of modules
related to the types of samples were quantified by gene significance (GS) and module significance (MS). The GS measure was defined as the value of the Pearson correlation among the i-th gene profile xi and the sample trait T:
GSi= |cor(xi, T)| [1] MS was defined as the average GS for all the genes in the
module.
Gene ontology (GO) and pathway enrichment analyses
The GO enrichment analyses of concerned gene sets were accomplished by means of DAVID (25).
Association analysis and hub genes
The ME-based connectivity measure (kme) is the distance from the expression profile of a gene to that of the ME. The ME provides upsurge to a measure of module centrality (kme) as mentioned below:
kme(i) = |cor(x(i),ME(q))| [2]
x(i) is the profile of gene i and ME(q) is the ME of module q.
Therefore, kme computes how adjacent a gene is to a module; i.e., it assesses the module membership of a gene. The hub genes are the ones with extensive network connectivity in a specific group. Moreover, the hub genes of modules are also
largely related to the analogous clinical traits of the modules.
Hence, genes with a high kme in the module were casually denoted as intramodular hub genes in this study.
Efficacy evaluation
Receiver operating characteristic (ROC) curve analysis was used to investigate the value of hub genes in diagnostic efficiency to differentiate among severe and non-severe AD patients. Detailed information of patients was obtained from a description of the GSE28146 dataset. The result was confirmed by the GSE28146 validation set. To do this, logistic regression was employed to classify the samples as follows:
[3]
Where p is the probability of severe stage, β0…βk are the parameters to be estimated, and k is number of genes in a
given module.
ROC curve was schemed, and the area under the curve (AUC) was quantified with “ROCR” package (Sing T, et al., 2005; Bioinformatics). When an AUC value was higher than 0.7, the hub gene was regarded as having outstanding specificity and sensitivity. The outcome was established by the GSE28146 validation set.
( )
(
β β0 1 1 βk)
1/ 1
− + + +=
+
X XkAnimals
The AD mice and wild type (WT) mice we used were bought from Charles River (China). Briefly, the human mutant amyloid precursor protein (APP) (HuAPPsw) (Tg2576) transgenic mouse AD model was used. Animal experiments were conducted in accordance with the guideline for the Care and Use of Laboratory Animals published by the US National Institutes of Health.
Total RNA extraction and quantitative real-time reverse transcription polymerase chain reaction (qRT-PCR) analysis Total RNA was isolated from AD mice and WT littermates (NC) using TRIzol reagent (Invitrogen) according to the manufacturer’s protocol. The RNA of the cortex and hippocampus was isolated separately from the two groups. qRT-PCR was employed to determine the mRNA expression of GRLK1. qRT-PCR was performed using SYBRGreen qPCR Master Mix (TAKARA). The primer sequences are as follows: GRIK1 forward: 5-CCGGGAATTCCATGTTTTGTGATAG TTTTGCA-3, GRIK1 reverse: 5-GAGTTCCTCGAG TCAGCTATGGTTTTGATCTT-3; β-actin forward: 5-CCCATCTATGAGGGTTACGC-3, β-actin reverse: 5-TTTAATGTCACGCACGATTTC-3.
Western blot analysis
Tissue was extracted using cell lysis buffer followed by immunoblotting with anti-GRIK1 (Abcam) and anti-β-actin (Santa Cruz Biotechnology). Cells were lysed in RIPA buffer with protease inhibitors (Roche Applied Science) on ice
for 20 min and then centrifuged at 13,500 rpm for 20 min at 4 ℃. The supernatant was placed into a new tube, and the protein concentration was measured using the bicinchoninic acid protein assay kit (Applygen). Next, 30 μg of cell lysates were resolved with 12.5% sodium dodecyl
sulfate polyacrylamide gel electrophoresis and transferred
to nitrocellulose membranes. Then, the membranes were blocked with 5% skim milk for 1 h at room temperature (RT). After blocking, the membranes were incubated with primary antibody for 1 h at RT. Then, the membranes were incubated with secondary antibodies at RT for 1 h. The protein bands were visualized using enhanced chemiluminescence chromogenic substrate with horseradish peroxidase (Beijing, China).
Primary neuron culture
Primary neurons were isolated from the hippocampus of
neonatal mice (26). Briefly, the extracted hippocampus was digested in 0.25% trypsin for 20 min. Cells were collected by centrifugation at 200 ×g for 5 min. Isolated cells were cultured and maintained in NeurobasalTM medium (GIBCO) supplemented with B27 and L-glutamine (GIBCO).
Cell transfection
The sequence of GRIK1 used human liver cDNA
(Invitrogen) and was cloned into the pCDNA3.1 vector
(GRIK1 pCDNA3.1). Primary neurons were seeded into a six-well plate at a concentration of 105, and the plasmids or its control plasmids were transfected using Lipofectamine 2000 (Invitrogen), according to the manufacturer’s
protocols.
Phalloidin staining
Primary neurons were fixed in 4% PFA for 20 min, permeabilized using 0.5% Triton X-100 (Biosharp, China) for 30 min, and treated with Alexa Fluor® 488 conjugated phalloidin (Cell Signaling, USA) for 30 min and the nuclear counterstain DAPI for 5 min. Coverslips were washed and mounted on glass slides. Stained neurons were photographed using a Nikon C2si confocal microscope (Nikon) equipped with a 60× oil immersion objective.
Results
Identification of gene co-expression modules
To determine if all 31 samples in GSE1297 were appropriate for network analysis, the sample dendrogram and analogous clinical traits were investigated. We confirmed that all samples were incorporated into the groups and conceded
the cutoff thresholds (Figure 1A). Soft-thresholding power is a crucial factor for creating a WGCNA. We accomplished the analysis of network topology for thresholding powers
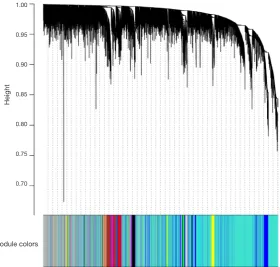
Finally, we created average linkage hierarchical clustering with the topological overlap matrix (TOM) and created the gene co-expression network by means of WGCNA depending on the graded grouping of the quantified variations. Subsequently, 16 modules were acquired (Figure 2).
We utilized MEs as illustrative profiles and computed module correspondence by eigengene correlation. Interaction relations of the 16 modules were examined, and the network heatmap was designed (Figure 3A). The
outcomes indicated that each module was autonomously authenticated with another which revealed a high level
of individuality among the modules and the comparative independence of gene manifestation in each module.
Correlation of modules and clinical traits
To investigate if any module was connected with disease status, we investigated the relevance among each module plus the AD clinical traits, including MMSE, BRAAK, NFT, postmortem interval (PMI), and age. We found that some modules were highly correlated with the disease status of AD (modules of lightcyan, pink, salmon, and blue). For example, the ME value of the lightcyan module also exhibited a positive association with MMSE (r=0.6, P=3×10⁻⁴) and a negative association with BRAAK (r=−0.41, P=0.02) (Figure 3B). The eigengene
[image:5.595.145.443.84.435.2]dendrogram and the heatmap specified that the 16 modules Figure 1 Clustering of samples and detection of soft-thresholding power. (A) Sample clustering was conducted to detect outliers. All samples are situated in the clusters and passed the cutoff thresholds; (B,C) analysis of the scale-free fit index (B) and analysis of the mean connectivity (C) for numerous soft-thresholding powers.
GSM21205
Height
Scale-fr
ee topology model fit, signed R
2
Mean connectivity
GSM21215
GSM21209
GSM21227
GSM21233 GSM21219 GSM21220
GSM21221
GSM21222
GSM21228
GSM21223
GSM21210
GSM21218
GSM21231
GSM21204
GSM21211
GSM21232
GSM21208
GSM21203
GSM21207
GSM21217
GSM21212
GSM21230
GSM21206
GSM21214 GSM21226 GSM21225
GSM21216
GSM21229
GSM21224
GSM21213
Soft threshold (power) Soft threshold (power)
Scale independence Mean connectivity
Sample clustering to detect outliers
0.9
0.8
0.7
0.6
0.5
0.4
2000
1500
1000
500
0 130
120 110 100 90 80
0 5 10 15 20 25 30 0 5 10 15 20 25 30
A
were mostly separated into two groups (Figure 3C).
Moreover, the ME of the pink module indicated a significant connection with all disease status (NFT, BRAAK, and MMSE) compare to the other modules (Figure 3B),
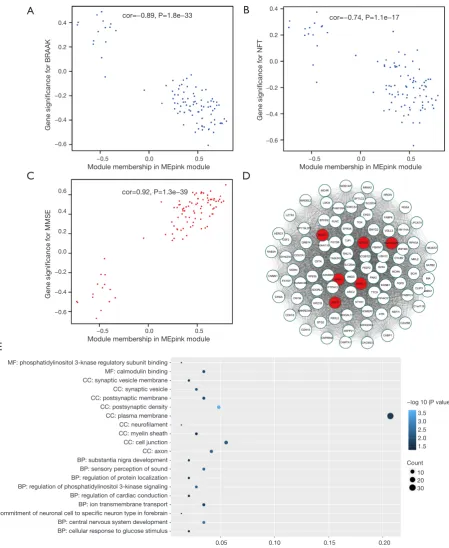
indicating that the pink module might have an integral role in the occurrence and development of AD. We recognized the pink module as the module most applicable to the disease level of AD. Finally, a correlation between module membership and GS was plotted for the module pink (Figure 4A,B,C). We visualized the pink module as a network in Cytoscape. Figure 4D shows the genes in the pink module, and the red nodes signify hub genes. The hub genes in the pink module comprised acetoacetyl-CoA synthetase (AACS),
GRIK1, homeobox B2 (HOXB2), potassium voltage-gated channel modifier subfamily F member 1 (KCNF1), MYB proto-oncogene like 1 (MYBL1), and RAP1 GTPase
activating protein 2 (RAP1GAP2).
Functional enrichment analysis of genes in modules of interest
Since genes with analogous expression patterns might
take part in parallel biological procedures or networks, we achieved enrichment analysis to search the GO terms in which the pink module was incorporated. As per the obtained outcomes, the pink module was mostly enriched
in central nervous system development, regulation of
phosphatidylinositol 3-kinase (PI3K) signaling, and ion transmembrane transport (Figure 4E & Table 1). To further
investigate the role of modules in AD, we also performed GO enrichment analysis to other modules, which were correlated with two of three clinical traits (modules of lightcyan, salmon, and blue). Interestingly, the genes in the blue, salmon and pink modules were significantly enriched in the GO terms of the plasma membrane (Figure S1).
Efficacy evaluation of hub genes
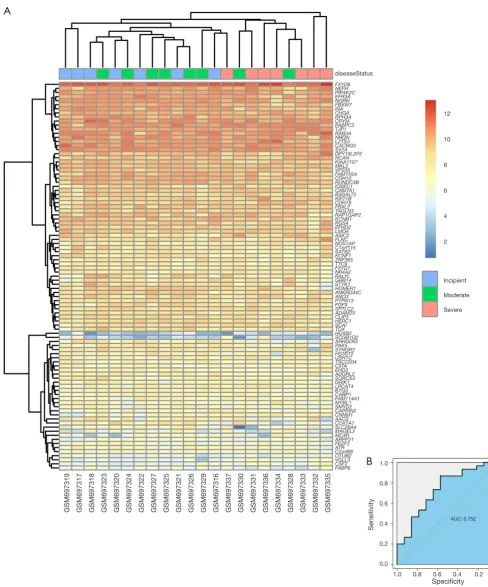
In the GSE28146 validation set, we found that genes in the pink module are capable of discriminating severe and
[image:6.595.161.442.109.376.2]non-severe AD samples (Figure 5A). Furthermore, ROC curve analysis was executed to assess the diagnostic effectiveness of hub genes to differentiate among severe and non-severe AD samples. We quantified the AUC value and designed ROC Figure 2 Dendrogram of all genes grouped depending on a dissimilarity measure (1-TOM). TOM, topological overlap matrix.
Height
Cluster dendrogram
Module colors
1.00
0.95
0.90
0.85
0.80
0.75
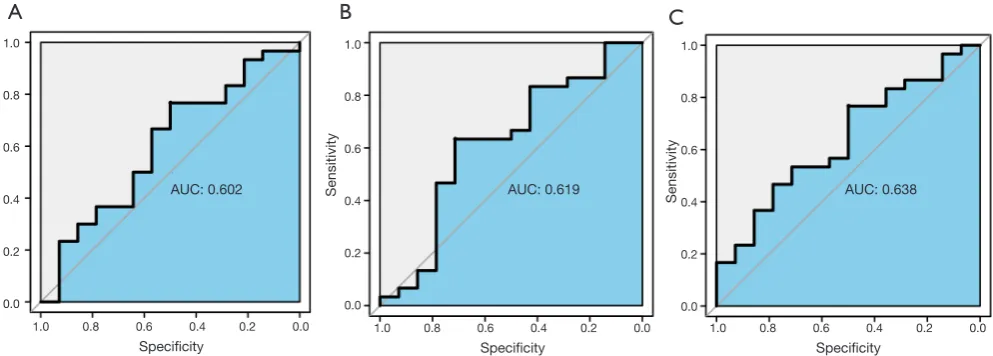
curves for the six hub genes. The AUC value of the pink module was greater than 0.7 (Figure 5B). The ROC curves for hub genes of the other less related modules (modules of lightcyan, salmon, and blue) are presented in Figure S2.
GRIK1 was upregulated in the AD cortex and AD hippocampus and attenuated dendritic length in primary neurons
[image:7.595.60.533.81.529.2]To identify the levels of GRIK1 in the AD cortex and AD Figure 3 Identification of modules associated with the clinical traits of AD. (A) A heatmap of co-expressed genes. Different colors in the X and Y axis signify different modules. The intensity of yellow represents the degree of connectivity of different modules; (B) correlation among modules and traits; (C) top: dendrogram of ME acquired by WGCNA; bottom: heatmap plot of the adjacencies of modules. Red
represents high adjacency whereas blue represents low adjacency. AD, Alzheimer’s disease; ME, module eigengene; NFT, neurofibrillary
tangle; MMSE, mini-mental state examination; PMI, postmortem interval; WGCNA, weighted gene co-expression network analysis.
C
MElightcyan
MEcyan
MEblack
MEmidnightblue
MEblue MEbr
own
MEgr
eenyellow
MEr
ed
MEtan
MEpink MEsalmon
MEpurple MEtur
quoise
diseaseStatus
MEgr
een
MEyellow MEmagenta
diseaseStatus
diseaseStatus
diseaseStatus
NFT
BRAAK MMSE PMI Age
Module-trait relationships Eigengene adjacency heatmap
Eigengene adjacency heatmap
MElightcyan MEpink MEcyan MEsalmon MEtan MEblack MEpurple MEmidnightblue MEturquoise MEred MEblue MEgreen MEbrown MEyellow MEgreenyellow MEmagenta MEgrey
1.0
0.5
0.0
−0.5
−1.0
1.0
0.8
0.6
0.4
0.2
0.0 1.2
1.0 0.8 0.6 0.4 0.2
A
B
Figure 4 Clinical relevance and functional analysis of genes in module Mepink. (A,B,C) A scatter plot of gene significance for NFT (A),
BRAAK (B), and MMSE (C) vs. the module membership in the pink module; (D) the genes in the pink module and the red signify the hub
nodes; (E) statistics of GO term enrichment for genes in different modules for WGCNA. Percentage is the ratio of the number of genes of a specific module in a certain pathway to the number of total genes. ME, module eigengene; NFT, neurofibrillary tangle; MMSE, mini-mental state examination; GO, gene ontology; WGCNA, weighted gene co-expression network analysis.
A
B
C
D
E
Gene significance for BRAAK
Gene significance for MMSE
Gene significance for NFT
Module membership in MEpink module
Module membership in MEpink module
Percentage cor=−0.89, P=1.8e−33
cor=0.92, P=1.3e−39
cor=−0.74, P=1.1e−17
Module membership in MEpink module
0.4
0.2 0.0 −0.2
−0.4 −0.6
0.6 0.4 0.2 0.0 −0.2 −0.4 −0.6
MF: phosphatidylinositol 3-knase regulatory subunit binding MF: calmodulin binding CC: synaptic vesicle membrane CC: synaptic vesicle CC: postsynaptic membrane CC: postsynaptic density CC: plasma membrane CC: neurofilament CC: myelin sheath CC: cell junction CC: axon BP: substantia nigra development BP: sensory perception of sound BP: regulation of protein localization BP: regulation of phosphatidylinositol 3-kinase signaling BP: regulation of cardiac conduction BP: ion transmembrane transport BP: commitment of neuronal cell to specific neuron type in forebrain BP: central nervous system development BP: cellular response to glucose stimulus
3.5 3.0 2.5 2.0 1.5
10 20 30 0.4
0.2
0.0
−0.2
−0.4
−0.6 −0.5 0.0 0.5
−0.5 0.0 0.5
0.05 0.10 0.15 0.20
−log 10 (P value)
Table 1 Enriched GO terms of the pink module
Term P value Genes
Central nervous system development 0.003082 GRIK1, ADAM23, ASIC2, NCAN, TAGLN3
Sensory perception of sound 0.004451 SLC26A4, TJP1, ASIC2, USH1C, CRYM
Regulation of phosphatidylinositol 3-kinase signaling 0.007014 FGF9, PTPN13, PIP4K2C, FBXL2
Ion transmembrane transport 0.021093 GRIK1, ANO3, ASIC2, FXYD6, FXYD7
Substantia nigra development 0.02498 INA, FGF9, SYNGR3
Regulation of protein localization 0.027896 SLC26A4, ARHGDIG, FBXW7
Cellular response to glucose stimulus 0.027896 TJP1, KCNB1, AACS
Regulation of cardiac conduction 0.031987 FXYD6, EHD3, FXYD7
Commitment of neuronal cell to specific neuron type in forebrain
0.034502 FEZF2, SATB2
Positive regulation of GTPase activity 0.063638 CSF2, ARHGDIG, FGF9, RGS4, HERC1, RAP1GAP2, IQSEC1
Negative regulation of transcription from RNA polymerase II promoter
0.068575 CIITA, FEZF2, SATB2, FGF9, NR4A2, SMYD2, TAGLN3, CRYM
Glutamate receptor signaling pathway 0.072494 GRIK1, KCNB1
Phosphatidylinositol phosphorylation 0.080478 FGF9, EFR3A, PIP4K2C
Postsynaptic density 3.01E-04 LZTS3, CABP1, NEFH, VPS35, NRGN, HOMER1, SORCS3
Axon 0.004873 RAB3A, KCNB1, NEFH, NRGN, HOMER1, KIF21B
Cell junction 0.007625 LZTS3, TJP1, GRIK1, KCNB1, CABP1, RPH3A, HOMER1, SYNGR3
Synaptic vesicle 0.01066 RAB3A, SV2A, RPH3A, SYNGR3
Postsynaptic membrane 0.020603 LZTS3, GRIK1, KCNB1, CABP1, HOMER1
Plasma membrane 0.022859 RAB3A, GRIK1, CABP1, FXYD6, FXYD7, SORCS3, ANO3, EFR3A, SV2A, RAP1GAP2, ADAM23, KCNB1, ASIC2, PTPN13, CACNG3, RPH3A, FLNC, CNNM1, SLC26A4, STYK1, TJP1, RGS4, CDH18, MC4R, USH1C, FAM155A, KCNF1, CLIP3, GRB14, CDH10
Synaptic vesicle membrane 0.03024 SV2A, RPH3A, SYNGR3
Neurofilament 0.038839 INA, NEFH
Myelin sheath 0.039486 INA, NEFH, TAGLN3, EHD3
Apical part of cell 0.053059 TJP1, USH1C, HOMER1
Cytoplasm 0.06079 LZTS3, CAMTA1, ARHGDIG, ARPP21, FGF9, ZNF365, FBXW7, TSC22D4, PAK5, PABPC3, NEFH, SV2A, RAP1GAP2, KIF21B, EHD3, IQSEC1, SATB2, NR4A2, SCAI, PTPN13, SMYD2, HERC1, FLNC, CAPRIN2, TJP1, FAM114A1, HOXB2, RGS4, BTG3, USH1C, GRB14, CRYM, FABP6, FBXL2
Sarcolemma 0.066156 NOS1AP, KCNB1, FLNC
Costamere 0.089819 FLNC, HOMER1
Calmodulin binding 0.014081 TJP1, ARPP21, RGS4, NRGN, FBXL2
Phosphatidylinositol 3-kinase regulatory subunit binding 0.043401 PTPN13, FBXL2
Figure 5 Efficacy evaluation of hub genes. (A) Hierarchical clustering of AD samples from the GSE28146 validation set using the hub genes in the pink module; (B) ROC curve for the six hub genes. AD, Alzheimer’s disease; ROC, receiver operating characteristic; AUC, area under
the curve.
GSM697319 GSM697317 GSM697318 GSM697323 GSM697320 GSM697324 GSM697322 GSM697327 GSM697325 GSM697321 GSM697326 GSM697329 GSM697316 GSM697337 GSM697330 GSM697331 GSM697336 GSM697334 GSM697328 GSM697333 GSM697332 GSM697335 FXYD6 NEFH PIP4K2C EFR3A NGRN FBXW7 INA CHGA RPH3A CRYM PABPC3 TJP1 RAB3A NRGN LZTS3 CACNG3 SV2A DPY19L2P2 NCAN KIAA1107 MKL2 VPS35 FAM155A CDH10 RUNDC3B IQSEC1 CAMTA1 B3GALT2 KIF21B CDH18 FBXL2 TAGLN3 RAP1GAP2 KCNB1 RGS4 EFHD2 LMO4 ASIC2 FLNC NOS1AP C1orf115 SATB2 KCNF1 ZNF365 TTC9 FXYD7 NR4A2 RALYL GRB14 STYK1 HOMER1 ANKRD34C ANO3 PTPN13 FGF9 SPTLC2 ADAM23 CLIP3 HERC1 SCAI TOX HOXB2 SCGB1D2 ARHGDIG PAK5 SYNGR3 HS3ST2 USH1C TSC22D4 CIITA EHD3 ADGRL2 SORCS3 GRIK1 LPCAT4 BTG3 CABP1 FAM114A1 MYBL1 SMYD2 CAPRIN2 CNNM1 AACS COX7A1 SLC26A4 MAGEL2 MC4R ARPP21 FEZF2 ATR C2orf68 OTUB2 VGLL3 CSF2 FABP6 Sensitivity Specificity AUC: 0.752 1.0 0.8 0.6 0.4 0.2 0.0
Figure 6 The expression of GRIK1 in the AD cortex and AD hippocampus. (A) The expression of GRIK1 in the AD cortex determined by
qRT‐PCR. **, P<0.01. NC: The control group, n=10; the AD group, n=10; (B) Western blot showing the expression of GRIK1 in the AD
cortex and control group; (C) relative expression of GRIK1 in (B). ***, P<0.005. n=3; (D) the expression of GRIK1 in the AD hippocampus
determined by qRT‐PCR. *, P<0.05, NC: the control group, n=10; the AD group, n=10; (E) Western blot showing the expression of GRIK1
in the AD hippocampus and control group; (F) relative expression of GRIK1 in (E). **, P<0.01. n=3; (G) phalloidin staining showing the morphology of the primary neurons; (H) relative dendritic length in (G). **, P<0.01. n=3. The experiments were independently repeated 3
times. AD, Alzheimer’s disease; qRT‐PCR, quantitative real-time reverse transcription polymerase chain reaction.
Relative level of mRNA Relative level of pr
otein
Relative level of pr
otein
Relative dendritic length
Relative level of mRNA
GRIK1 pCDNA3.1
NC
2.5 2.0 1.5 1.0 0.5 0.0
2.5 2.0 1.5 1.0 0.5 0.0
2.5 2.0 1.5 1.0 0.5 0.0
1.5 1.0 0.5 0.0 2.5
2.0 1.5 1.0 0.5 0.0
104 KDa 43 KDa
GRIK1
β-actin
GRIK1
β-actin 104 KDa
43 KDa
NC AD cortex NC AD cortex
NC AD cortex
NC AD hippocampus NC AD hippocampus
NC GRIK1 pCDNA3.1 NC AD hippocampus
DAPI Phalloidin Merge **
**
** *
***
A
B
C
D
E
F
G
H
hippocampus, qRT-PCR and western blot were used. The qRT-PCR data showed that the mRNA level of GRIK1 was higher in the AD cortex compared with the NC
cortex (Figure 6A). Western blotting data showed that the
expression of GRIK1 protein was higher in the AD cortex compared to the NC cortex (Figure 6B,C). A comparison of the expression of GRIK1 between the AD hippocampus and NC hippocampus was also examined via qRT-PCR
and Western blot. The mRNA level of GRIK1 in the
AD hippocampus was increased compared with the NC
hippocampus (Figure 6D). The protein level of GRIK1 in the
AD hippocampus showed the same pattern (Figure 6E,F).
Phalloidin staining showed that the dendritic length of GRIK1 pCDNA3.1 group was shorter than that in the NC
and attenuated the dendritic length of primary neurons.
Discussion
This study combined the mining of microarray data with the clinical evidence of AD patients to perform a WGCNA with the aim of recognizing those biomarkers related to
clinical features that could distinguish the different stages of AD patients.
There are many different stage standards for
differentiating AD types. Based on the foundation of the dispersal of NFTs, AD can be divided into three subtypes (Braak stage ≥ IV): hippocampal-sparing AD, typical AD, and limbic-predominant AD. In hippocampal-sparing AD, NFTs are increased in the cortex but
relatively less so in the hippocampus (27). However, in limbic-predominant AD, NFT counts are normally
increased in the hippocampus and decreased in the cortex.
Meanwhile, typical AD usually has classic distributions of
NFTs (28). According to neuroimaging patterns of CSF biomarkers, cognitive and clinical measures, white matter hyperintensities, and longitudinal trajectories, AD can be divided into four atrophy patterns: (I) patients with generally standard neuroanatomical profiles with slightly irregular cognitive and CSF biomarker profiles and the slowest clinical development; (II) patients with classical AD neuroanatomical, cognitive, and CSF biomarkers with a clinical profile displaying the quickest clinical development; (III) patients with a diffused array of deterioration with
comparatively less distinct participation of the medial
temporal lobe, irregular CSF amyloid-b1-42 values, and
proportionately superior executive damage; (IV) patients
with remarkably central participation of the medial temporal lobe and a slow stable development, possibly demonstrating
in early AD stages (5). These biomarkers for staging AD offer the prospect for allowing accurate diagnosis,
prognosis, and precise patient enrolment of comparatively
consistent subgroups of individuals for clinical trials. In this study, the GSE1297 and GSE28146 datasets, which focused on the critical early stages, were chosen for further study. GSE1297 dataset was utilized for AD-related modules and gene selection. Another dataset was used for
independent verification. After some processes such as
standardization and normalization, 9,974 genes were finally used for WGCNA. Then, 16 co-expression modules were recognized by the dynamic tree cut method. Through associating gene modules with three clinical features, the pink module was identified as having the greatest positive
association with the pathological stage. Exploring the association between the pink module and pathological stage could narrow the search for those genes with vital biological importance to AD. There were six hub genes in the pink
module, including AACS, GRIK1, HOXB2, KCNF1,
MYBL1, and RAP1GAP2. Of these hub genes, mutations
in the PSEN1 gene have been found to be linked with
familial AD (29). The transcriptional factor HOXB2 has been proven to be up-regulated with folic acid to augment
the effectiveness of memantine for spatial learning and neuronal defense (30). MYBL1 has shown different patterns in males’ and females’ molecular networks of AD based on global gene expression and integrative network analyses (31).
Bos taurus RAP1GAP2 acts together with synaptotagmin-like protein 1 and Rab27 to control the excretion of dense granules from platelets at locations of endothelial injury, which may impact the progress of AD (32). KCNF1 has
diverse functions, including regulating neurotransmitter
release and AACS-related pathways of metabolism and butanoate metabolism, which may play roles in AD (33).
GRIK1, also known as glutamate receptor 5 (GluR5), is one of 14 receptor subunits. The glutamate receptor (GluR) subunits are included in ionotropic GluRs and regulate
excitatory neurotransmission (34). A physical map of the
GRIK1 region and a schematic representation of the splicing mechanisms were presented by Barbon et al. in 2000 (35).
In 2014, Kranzler et al. showed that GRIK1 could reduce the heavy drinking in problem drinkers and that it might be a moderator for heavy drinkers (36). The function of
GRIK1 in the central nervous system has not been fully characterized. GRIK1 was shown to be overexpressed in senile plaques (in the temporal lobe) in RNA-sequencing
data of AD patients and may play a critical role in AD (37).
However, the relationship between AD and GRIK1 is poorly understood. Therefore, we next investigated the level of GRIK1 in a mouse model. The results showed that the expression of GRIK1 was upregulated in both the cortex
and hippocampus in AD mice, indicating a potential role in the pathogenesis of AD.
Enrichment analyses for the pink module specified that the biological processes of the pink module concentrated on PI3K signaling and ion transmembrane transport. Previous studies have suggested that the PI3K/Akt cascade is involved in the nicotine-induced neuroprotection through the phosphorylation of bad, a Bcl-2 family protein supporting
neuronal endurance (38). Kihara et al. reported that nicotine
b-amyloid-enhanced glutamate neurotoxicity. Treatment with PI3K inhibitors like LY294002 and wortmannin can suppress the nicotine-induced neuroprotective impact, indicating that the PI3K/Akt cascade regulates the nicotine-induced neuroprotection through the Bcl-2 protein (39).
Donepezil, galantamine, tacrine, specified as “therapeutic AChE inhibitors” and used in the treatment of AD, were shown to protect the principal cultures of rat cortical neurons from glutamate-induced neurotoxicity that includes apoptotic neuronal death via PI3K/Akt pathway (40).
One of the pathological changes in AD is the irregular proteolytic handling of APP, which is the vital step that causes the creation of amyloid plaque, NFTs, and neuronal loss. By interacting with ion transport systems,
amyloid protein induces an array of effects via the activation of several mechanisms (41). Impairment of Ca2+ homeostasis, along with the production of reactive oxygen species was considered as the cause of amyloid protein-prompted cytotoxicity. The change in Ca2+ homeostasis may change endogenous ion transport systems, like as Ca2+ and K+ channels, ligand-driven ion channels, and G-protein-induced releases of second messengers or form
heterogeneous ion channels. Amyloid proteins in AD modify numerous ion transport systems and form heterogeneous
ion channels, which can alter cell regulation (42).
These modifications harm the membrane by lowering its reliability and increasing its ion penetrability, thus perhaps
promoting the progress of AD (42).
Moreover, we found that genes in the pink module can be used to discriminate between three kinds of AD samples
of the incipient, moderate, and severe type, particularly
between severe and non-severe AD samples in the GSE28146 validation set. Furthermore, ROC curve analysis was applied to assess the diagnostic effectiveness of six hub genes to discriminate between severe and non-severe AD samples. We found that the AUC value was higher than 0.7, but that the AUC values for less related modules (modules of lightcyan, salmon, and blue) were lower than 0.7, indicating that these six hub genes are potential biomarkers
of AD stages.
In conclusion, we employed WGCNA to systematically recognize co-expressed gene modules and those hub genes related to AD development. One gene module and six hub genes capable of distinguishing between AD stages were identified. These outcomes can contribute to an improved
understanding of the mechanisms participating in the development of AD.
Acknowledgments
None.
Footnote
Conflict of Interest: The authors have no conflicts of interest to declare.
Ethical Statement: The authors are accountable for all aspects of the work in ensuring that questions related to the accuracy or integrity of any part of the work are
appropriately investigated and resolved. Animal experiments
were conducted in accordance with the guideline for the Care and Use of Laboratory Animals published by the US National Institutes of Health. The study was approved by the Ethics Committee of First Affiliated Hospital of Harbin Medical University, China (No. 2019022).
References
1. Albert MS, DeKosky ST, Dickson D, et al. The diagnosis of mild cognitive impairment due to Alzheimer's disease: recommendations from the National Institute on Aging-Alzheimer's Association workgroups on diagnostic guidelines for Alzheimer's disease. Alzheimers Dement 2011;7:270-9.
2. Vemuri P, Lesnick TG, Przybelski SA, et al. Effect of lifestyle activities on Alzheimer disease biomarkers and cognition. Ann Neurol 2012;72:730-8.
3. Sperling RA, Aisen PS, Beckett LA, et al. Toward defining the preclinical stages of Alzheimer's disease: recommendations from the National Institute on Aging-Alzheimer's Association workgroups on diagnostic guidelines for Alzheimer's disease. Alzheimers Dement 2011;7:280-92.
4. Mielke MM, Vemuri P, Rocca WA. Clinical epidemiology of Alzheimer's disease: assessing sex and gender
differences. Clin Epidemiol 2014;6:37-48.
5. Braak H, Braak E. Staging of Alzheimer's disease-related neurofibrillary changes. Neurobiol Aging 1995;16:271-8; discussion 278-84.
6. Galasko D, Klauber MR, Hofstetter CR, et al. The Mini-Mental State Examination in the early diagnosis of Alzheimer's disease. Arch Neurol 1990;47:49-52. 7. Bierer LM, Hof PR, Purohit DP, et al. Neocortical
Alzheimer's disease. Arch Neurol 1995;52:81-8. 8. Wang YQ, Qu DH, Wang K. Therapeutic approaches
to Alzheimer's disease through stimulating of
non-amyloidogenic processing of amyloid precursor protein.
Eur Rev Med Pharmacol Sci 2016;20:2389-403. 9. Blennow K, Hampel H, Weiner M, et al. Cerebrospinal
fluid and plasma biomarkers in Alzheimer disease. Nat Rev Neurol 2010;6:131-44.
10. Fagan AM, Mintun MA, Mach RH, et al. Inverse relation between in vivo amyloid imaging load and cerebrospinal fluid Abeta42 in humans. Ann Neurol 2006;59:512-9. 11. Forsberg A, Engler H, Almkvist O, et al. PET imaging
of amyloid deposition in patients with mild cognitive impairment. Neurobiol Aging 2008;29:1456-65. 12. Hesse C, Rosengren L, Andreasen N, et al. Transient
increase in total tau but not phospho-tau in human cerebrospinal fluid after acute stroke. Neurosci Lett 2001;297:187-90.
13. Ost M, Nylen K, Csajbok L, et al. Initial CSF total tau correlates with 1-year outcome in patients with traumatic brain injury. Neurology 2006;67:1600-4.
14. Hampel H, Burger K, Pruessner JC, et al. Correlation of cerebrospinal fluid levels of tau protein phosphorylated at threonine 231 with rates of hippocampal atrophy in Alzheimer disease. Arch Neurol 2005;62:770-3.
15. Buerger K, Ewers M, Pirttila T, et al. CSF phosphorylated tau protein correlates with neocortical neurofibrillary pathology in Alzheimer's disease. Brain 2006;129:3035-41. 16. Villemagne VL, Pike KE, Chetelat G, et al. Longitudinal
assessment of Abeta and cognition in aging and Alzheimer disease. Ann Neurol 2011;69:181-92.
17. Carlson MR, Zhang B, Fang Z, et al. Gene connectivity, function, and sequence conservation: predictions from modular yeast co-expression networks. BMC Genomics 2006;7:40.
18. Zhou XG, Huang XL, Liang SY, et al. Identifying miRNA and gene modules of colon cancer associated with pathological stage by weighted gene co-expression network analysis. Onco Targets Ther 2018;11:2815-30.
19. Langfelder P, Horvath S. WGCNA: an R package for weighted correlation network analysis. BMC Bioinformatics 2008;9:559.
20. Liu J, Zhou S, Li S, et al. Eleven genes associated with progression and prognosis of endometrial cancer (EC) identified by comprehensive bioinformatics analysis. Cancer Cell Int 2019;19:136.
21. Zhao B, Chen Y, Hu S, et al. Systematic Analysis of Non-coding RNAs Involved in the Angora Rabbit (Oryctolagus
cuniculus) Hair Follicle Cycle by RNA Sequencing. Front Genet 2019;10:407.
22. Parsana P, Ruberman C, Jaffe AE, et al. Addressing confounding artifacts in reconstruction of gene co-expression networks. Genome Biol 2019;20:94. 23. Blalock EM, Geddes JW, Chen KC, et al. Incipient
Alzheimer's disease: microarray correlation analyses reveal major transcriptional and tumor suppressor responses. Proc Natl Acad Sci U S A 2004;101:2173-8.
24. Blalock EM, Buechel HM, Popovic J, et al. Microarray analyses of laser-captured hippocampus reveal distinct gray and white matter signatures associated with incipient Alzheimer's disease. J Chem Neuroanat 2011;42:118-26. 25. Huang DW, Sherman BT, Tan Q, et al. DAVID
Bioinformatics Resources: expanded annotation database and novel algorithms to better extract biology from large gene lists. Nucleic Acids Res 2007;35:W169-75.
26. Si Z, Wang X, Zhang Z, et al. Heme Oxygenase 1 Induces Tau Oligomer Formation and Synapse Aberrations in Hippocampal Neurons. J Alzheimers Dis 2018;65:409-19. 27. Murray ME, Graff-Radford NR, Ross OA, et al.
Neuropathologically defined subtypes of Alzheimer's disease with distinct clinical characteristics: a retrospective study. Lancet Neurol 2011;10:785-96.
28. Whitwell JL, Dickson DW, Murray ME, et al. Neuroimaging correlates of pathologically defined subtypes of Alzheimer's disease: a case-control study. Lancet Neurol 2012;11:868-77.
29. Antonell A, Llado A, Altirriba J, et al. A preliminary study of the whole-genome expression profile of sporadic and monogenic early-onset Alzheimer's disease. Neurobiol Aging 2013;34:1772-8.
30. Chen TF, Huang RF, Lin SE, et al. Folic Acid potentiates
the effect of memantine on spatial learning and neuronal
protection in an Alzheimer's disease transgenic model. J Alzheimers Dis 2010;20:607-15.
31. Sun LL, Yang SL, Sun H, et al. Molecular differences in Alzheimer's disease between male and female patients determined by integrative network analysis. J Cell Mol Med 2019;23:47-58.
32. Willard FS, Low AB, McCudden CR, et al. Differential G-alpha interaction capacities of the GoLoco motifs in Rap GTPase activating proteins. Cell Signal 2007;19:428-38. 33. Gutman GA, Chandy KG, Grissmer S, et al. International
Union of Pharmacology. LIII. Nomenclature and molecular relationships of voltage-gated potassium channels. Pharmacol Rev 2005;57:473-508.
novel properties and new clones. Trends Pharmacol Sci 1992;13:291-6.
35. Barbon A, Barlati S. Genomic organization, proposed alternative splicing mechanisms, and RNA editing structure of GRIK1. Cytogenet Cell Genet 2000;88:236-9. 36. Kranzler HR, Covault J, Feinn R, et al. Topiramate
treatment for heavy drinkers: moderation by a GRIK1 polymorphism. Am J Psychiatry 2014;171:445-52. 37. Twine NA, Janitz K, Wilkins MR, et al. Whole
transcriptome sequencing reveals gene expression and splicing differences in brain regions affected by Alzheimer's disease. PLoS One 2011;6:e16266.
38. del Peso L, Gonzalez-Garcia M, Page C, et al. Interleukin-3-induced phosphorylation of BAD through the protein kinase Akt. Science 1997;278:687-9.
39. Kihara T, Shimohama S, Sawada H, et al. alpha 7 nicotinic
receptor transduces signals to phosphatidylinositol 3-kinase to block A beta-amyloid-induced neurotoxicity. J Biol Chem 2001;276:13541-6.
40. Takada-Takatori Y, Kume T, Sugimoto M, et al. Acetylcholinesterase inhibitors used in treatment of Alzheimer's disease prevent glutamate neurotoxicity via
nicotinic acetylcholine receptors and phosphatidylinositol
3-kinase cascade. Neuropharmacology 2006;51:474-86. 41. Sultana R, Newman SF, Abdul HM, et al. Protective effect
of D609 against amyloid-beta1-42-induced oxidative modification of neuronal proteins: redox proteomics study. J Neurosci Res 2006;84:409-17.
42. Casey NH, Crosley RI, Smith GA. Influence of continuous dietary halofuginone on broiler skin tensile strength and growth performance. J S Afr Vet Assoc 1992;63:16-9.
Cite this article as: Sun Y, Lin J, Zhang L. The application of weighted gene co-expression network analysis in identifying key modules and hub genes associated with disease status in Alzheimer’s disease. Ann Transl Med 2019;7(24):800. doi:
Figure S1 Statistics of GO term enrichment for genes in blue, salmon, and lightcyan modules. GO, gene ontology. Percentage Percentage Percentage Module blue Module salmon Module lightcyan MF: protein complex binding
MF: cytoskeletal protein binding CC: vesicle CC: plasma membrane part CC: plasma membrane CC: neuron projection CC: membrane fraction CC: membrane-bounded vesicle CC: intrinsic to plasma membrane CC: integral to plasma membrane CC: insoluble fraction CC: extracellular region part CC: cytoplasmic vesicle CC: cell projection CC: cell fraction CC: axon BP: transmission of nerve impulse BP: synaptic transmission BP: response to wounding BP: response to hormone stimulus BP: response to endogenous stimulus BP: regulation of secretion BP: regulation of phosphorus metabolic process BP: regulation of phosphate metabolic process BP: regulation of cell proliferation BP: positive regulation of transport BP: positive regulation of response to stimulus BP: positive regulation of kinase activity BP: positive regulation of immune system process BP: positive regulation of immune response BP: neuron differentiation BP: locomotory behavior BP: leukocyte migration BP: leukocyte chemotaxis BP: intracellular signaling cascade BP: immune response BP: defense response BP: cellular component morphogenesis BP: cell proliferation BP: cell projection organization BP: cell proliferation BP: cell projection morphogenesis BP: cell morphogenesis involved in neuron differentiation BP: cell morphogenesis involved in differentiation BP: cell morphogenesis BP: cell-cell signaling BP: behavior BP: anion transport BP: activation of immune response
MF: transcription corepressor activity MF: high voltage-gated calcium channel activity CC: voltage-gated calcium channel complex CC: plasma membrane CC: membrane coat BP: synaptic transmission, GABAergic BP: mitochondrial fission BP: membrane depolarization during action potential BP: endosome organization BP: dynamin polymerization involved in mitochondrial fission BP: clathrin-mediated endocytosis
MF: protein self-association MF: protein binding MF: GTPase activity MF: GTP binding CC: synaptic vesicle CC: postsynaptic density CC: plasma membrane CC: perinuclear region of cytoplasm CC: myelin sheath CC: focal adhesion CC: ciliary base BP: regulation of long-term neuronal synaptic plasticity BP: negative regulation of growth BP: cellular response to zinc ion BP: cellular response to glucagon stimulus BP: cellular response to cadmium ion BP: axon guidance BP: activation of protein kinase A activity
10.0 7.5 5.0 3.5 3.0 2.5 2.0 1.5 3.5 3.0 2.5 2.0 1.5 2 4 6 8 10 100 200 300 5 10 15 20 25 0 1 2
0.02 0.04 0.06 0.08 0.10
0.1 0.2 0.3 0.4
−log10 (P value)
−log10 (P value)
−log10 (P value) Count Count
Figure S2 ROC curve for the hub genes in blue (A), salmon (B), and lightcyan (C) modules. ROC, receiver operating characteristic; AUC,
area under the curve.
Sensitivity
Sensitivity Sensitivity
Specificity Specificity Specificity
AUC: 0.602 AUC: 0.619 AUC: 0.638
1.0
0.8
0.6
0.4
0.2
0.0
1.0
0.8
0.6
0.4
0.2
0.0
1.0
0.8
0.6
0.4
0.2
0.0