Automatic Classification of Cervical Cancer
Cell: A Case Study
M. Prabukumar1, L.Agilandeeswari2
Associate Professor, School of Information Technology and Engineering, VIT University, Vellore, India1,2
ABSTRACT: Background: Cervical cancer has become one of the major causes of death among women worldwide. When compared to other cancer types occur on human being, this cancer cannot be screened at its initial stage with any kind of symptoms appeared as it is called as a deadly disease. Eventhough, an excessive research has been carried out over the past ten decade in cancer diagnosis and treatment; there is no improvement in the overall survival rate of cervical cancer patient after the initial diagnosis process.
Methods: In this research work, we have presented the Artificial Neural Network (ANN) based cervical cancer diagnosis system. It is explained as, from the Pap smear images; the GLCM based texture features are extracted. Among the extracted texture features, the suitable features are selected using Genetic Algorithm (GA) optimization technique. Over this Artificial Neural Network Classifier are used to conclude whether the input image is cancer affected or not.
Results: ANN based model showed the better performance in diagnosis of cervical cancer with the area under the receiving operating characteristics curve, sensitivity and specificity of 0.993, 97% and 93% respectively.
Conclusion: The simulation results indicate that ANN based model using genetic algorithm optimization technique have the potential for diagnosis of cervical cancer in its early stage that intern improves the survival rate of the patient.
KEYWORDS:Cervical cancer,Artificial Neural Network, Genetic Algorithm, GLCM, papsmear images..
I.INTRODUCTION
The second common cancer that appears in all age women groups is the cervical cancer. In fact, the annual global statistics of World Health Organization (WHO) estimated that 470 600 new cases and 233400 deaths from cervical cancer are happened around the year 2010 [1]. As reported in National Cervical Cancer Coalition (NCCC), cervical cancer is a cancer of the cervix which is commonly caused by a virus named Human Papillomavirus (HPV) [2]. This cancer can be cured if it is detected and treated in its earlier stage. It normally develops in the cervix of the women. The screening method which is manually done for cervical cells collection in the cervix region of the uterus is the Pap smear test. Cervical cancer can also be usually found early by having regular screening with this Pap test. Pap smear means human cells samples stained by the so-called Papanicolaou method. Being alert to any signs and symptoms of cervical cancer can also help avoid unnecessary delays in diagnosis [3]. Early detection greatly improves the chances of successful treatment and prevents any early cervical cell changes from becoming cancerous. It is better to have regular screening of cervical cancer because women with early cervical cancer and pre-cancers usually have no symptoms, and symptoms will arise only after the invasive growth of cancerous cells. But for most of the cases it throws symptoms only in the advanced stages.
The automated approach is required to reduce the false positive rate and to classify the abnormal cells if any quickly and perfectly. Here, we proposed a kind of automated approach which includes pre-processing technique, where the median filter is used to remove the noises in the cell, and then the features are extracted using GLCM (gray level co-occurrence matrix). Genetic algorithm which acts as an optimizer is employed for feature subset selection and finally Neural Network classifier is used for the classification of cervical cancer cells as normal and abnormal. In this paper, we also made a case study on the woman in detecting the abnormality on the cervical cells and it is also reported. The rest of the paper is organized as; Section 2 summarizes the literature review. Proposed methodology is introduced in Section 3. Case Study and Experimental results are presented in section 4 and 5 respectively. Finally, Conclusions are drawn in Section 6.
II.LITERATURE REVIEW
This section presents the review of various Artificial Neural Network (ANN) based cervical cancer system. To classify the cervical cells automatically the first ANN with Back propagation (BP) method is proposed by Mehdi et al [6], where the slides of the cervical cells are classified into mild cancer cells, moderate cancer cells and severe cancer cells. During 1998, the cervical cancer cells were detected using radial basis function (RBF) networks was introduced by Tumer et al. [7]. The author presented an experiment results for both MLP (Multi – layer perceptron) network and RBF network. An hybrid approach for the detection of cervical cancer cells was introduced in 2000, where the knowledge based rule in knowledge based neural networks was applied to extract the cancer image. Then, the cervical cancer cells are detected by calculating the pixel value of an image using genetic algorithm. This also uses MLP [8]. From the input Pap smear slides, the features are extracted and then fuzzy rules are applied for classifying the normal and abnormal cells was introduced by Zhong Li et al. [9]. The cervical cancer cells are predicted using the new ANN based method was developed by Takashi et al. [10]. The biopsy tissues are examined using the combination of histology radiations with the feed forward ANN. Nikolaos proposes a new second order neural network classifier for the classification of Pap smear cervical cancer cells classification. The non-linear squares are tested using LMAM (Levenberg – Marquardt with adaptive Momentum) [11]. From the uterine cervical region, the cell region is extracted using the nucleus segmentation and recognition method which is proposed by Kim et al. [12]. The extracted RGB space image is converted into HSI and it is used as the input layer in fuzzy RBF network. The output layer which is connected with the middle is classified into NNL, WNL, SCC, LSIL, where WNL normal and others are abnormal. SCC is the cancer cells. The features of the nucleus and cytoplasm which is extracted are used with the RBF to classify the cervical cancer from the Pap smear slides was developed by Francisco et al. [13]. In [14], the new Infrared features are added into the MLP network in order to extract the cervical features for the cancer cell classification from the thin Prep. Royan et al [15] proposes a ANN and Learning Vector Quantization (LVQ) to classify the normal and abnormal cells of cervix region. This method includes the image processing modules namely, pre-processing, filtering and feature extraction. The input image is stored in ANN and from the extracted features, the normal and abnormal cells are detected using the LVQ method with an accuracy rate of 90%. In [16], a gene programming is used to compare the MLP, RBF and probabilistic NN. In Gene programming the chromosomes are used as a linear strings of fixed length. The gene structure is organized as head and tail. The gene length depends on the head size, the MLP used comprises of number of layers (i) input has the features, hidden layer has the predefined number of nodes and the output layer is composed of response neurons. The technique proposed in [17] uses the MLP in ANN to perform the thinking. As ANN provides better understanding and results, this ANN architecture consists of one input and one output without any restriction in the number of hidden layers. Babak system is mainly targeted towards a novel Pap smear test to overcome the inefficiency in the older system due to the inexperience pathologist and cells overlapping [18]. There, the cervical cancer cells were diagnosed using MLP which involves two phases such as, image processing and feed forward MLPNN. The Levelberg-Marquarat Feed forward MLP NN was used to classify the unsegmented cell features as normal, LSII, HSIL cells with high accuracy. Phatak et al. introduced a new method for detecting the cervical cancer using the Support Vector Machine (SVM) and ANN [19].
III.PROPOSED METHOD
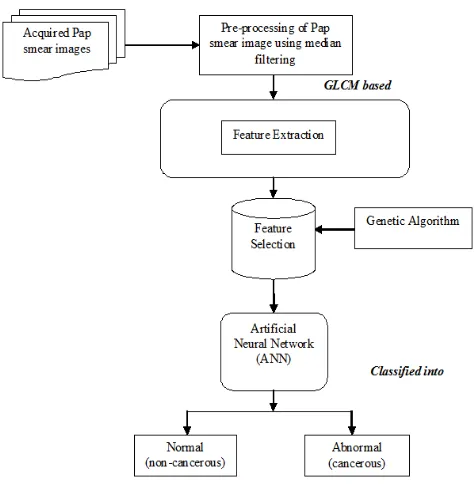
In the proposed system, the Pap smear images are captured and it is pre-processed in order to enhance the quality of the input images for further processing. Then, the texture features are extracted using the Gray Level Co-occurrence Matrix (GLCM). Then, from the extracted features most prominent features for classification are selected using the Genetic Algorithm (GA) based feature selection approach. Finally, cervical cells are classified into normal or abnormal cells using the ANN based classifier. The proposed architecture is shown in Fig. 1 and the modules of this proposed system are listed as:
(i) Acquired Pap smear image (ii) Image Pre-processing (iii) Feature extraction (iv) Feature selection, and (v) ANN based classification.
Fig. 1. Proposed System Architecture
A. Acquired Pap smear image
The Pap smear image which is obtained as a result of pap smear screening are useful for the detection of precancerous cells at its early stages which might increase the survival rate of a patient. The way of performing this pap smear test, that is about the people involved, inclusion and exclusion characteristics and the images obtained are elaborated in case study section IV. These acquired images are given as input to this automation system in order to clear that whether it is a normal or abnormal (cancerous) cells. The sample pap smear images which is acquired for analysis is shown as,
B. Image Pre-processing
The acquired Pap smear image undergoes pre-processing using median filtering for reducing the noise over it, thus enhances its quality.
B.1. MEDIAN FILTERING:
A median filter is a kind of non-linear filter and it is useful in removing the noise by preserving its image detail. The Median filter are good at removing salt and pepper noise from an image, and also cause relatively little blurring of edges, and hence are often used in computer vision applications [20]. However, with median filtering, the value of an output pixel is determined by the median of the neighborhood pixels, rather than the mean. The median is much less sensitive than the mean to extreme values (called outliers). Median filtering is therefore better able to remove these outliers without reducing the sharpness of the image.
Unlike conventional smoothing filters, median filters not involved in shifting the boundaries. The nonlinear neighborhood operations are performed here for the purpose of noise reduction that can do a better job in preserving the edges than simple smoothing filters. In the median filtering operation, the pixel values in the neighborhood window are ranked according to intensity, and the middle value becomes the output value for the pixel under evaluation. Since the median is less sensitive than the mean to extreme values, those extreme values are more effectively removed.
The median filtered output of the pap smear sample is shown in Fig. 3 as,
Fig. 3 Median filtered output C. Feature Extraction- GLCM:
Once the pre-processing is done, the GLCM based feature extraction is used. GLCM is a commonly used method for medical image analysis. This method provides information regarding the relative position of two pixels with respect to each other. To identify the texture in Pap smear image, modeling texture as a two dimensional array gray level variation. This array is called Gray Level co-occurrence matrix (GLCM). GLCM features are calculated for a direction 00 and at a distance d=1. A gray level co-occurrence matrix (GLCM) contains information about the positions of pixels having similar gray level values. A co-occurrence matrix is a two-dimensional array, P, in which both the rows and the columns represent a set of possible image values.
A GLCM Pd [i, j] is defined by first specifying a displacement vector d= (dx, dy) and counting all pairs of pixels separated by d having gray levels i and j. The texture filter functions provide a statistical view of texture based on the image histogram. These functions can provide useful information about the texture of an image but cannot provide information about shape, i.e., the spatial relationships of pixels in an image. Another statistical method that considers the spatial relationship of pixels is the Gray Level Co-occurrence Matrix (GLCM), also known as the graylevel spatial dependence matrix. The toolbox provides functions to create a GLCM and derive statistical measurements from it. For the given sample input nuclei images, the GLCM features like Energy, Entropy, Contrast, Correlation, Cluster Shade, and Cluster Prominence is being calculated from four different directions. The GLCMs are stored in i x j x n matrix, where n is the number of GLCMscalculated usually due to the different orientation and displacements. And, the values i and j are equal to 'NumLevels' parameter of the GLCM computing function graycomatrix().
C.1. CREATING A GRAYLEVEL COOCCURRENCE MATRIX:
example, if most of the entries in the GLCM are concentrated along the diagonal, the texture is coarse with respect to the specified offset.
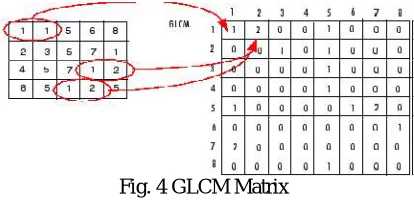
Fig. 4 GLCM Matrix
The above figure shows how graycomatrix calculates the first three values in a GLCM [21]. In the output GLCM, element (1,1) contains the value 1 because there is only one instance in the input image where two horizontally adjacent pixels have the values 1 and 1, respectively. Glcm (1,2) resulted in value 2, because there are two instances where two horizontally adjacent pixels have the values 1 and 2. Element (1,3) in the GLCM has the value 0 because there are no instances of two horizontally adjacent pixels with the values 1 and 3. graycomatrix continues processing the input image, scanning the image for other pixel pairs (i,j) and recording the sums in the corresponding elements of the GLCM.
Specifying the Offsets:
By default, the graycomatrix function creates a single GLCM, with the spatial relationship, or offset, defined as two horizontally adjacent pixels. However, a single GLCM might not be enough to describe the textural features of the input image. For example, a single horizontal offset might not be sensitive to texture with a vertical orientation. For this reason, graycomatrix can create multiple GLCMs for a single input image. To create multiple GLCMs, specify an array of offsets to the graycomatrix function. These offsets define pixel relationships of varying direction and distance. For example, you can define an array of offsets that specify four directions (horizontal, vertical, and two diagonals) and four distances. In this case, the input image is represented by 16 GLCMs.
Deriving Statistics from a GLCM:
After creating the GLCMs, we can derive several statistics from them using the graycoprops( ) function. These statistics provide information about the texture of an image.
C.2 TEXTURE FEATURES: 1. Autocorrelation
This function evaluates the linear spatial relationships between primitives. The set of autocorrelation coefficients shown below are used as texture features:
C(p,q)=
( )( )
∑ ∑
∑ ∑
( , ) ( , )
( , ) (1)
where p, q is the positional difference in the i, j direction, and M, N are image dimensions. 2. Contrast
Contrast is a measure of the local variations present in an image.
C(k,n)=
∑
∑
(i
−
j)
[ , ]
(2)where, k and n are the local variations, i and j are the pixel values, Pd is the co-occurrence matrix. If there is a large amount of variation in an image the P[i,j]’s will be concentrated away from the main diagonal and contrast will be high (typically k=2, n=1).
3. Correlation
Correlation is a measure of image linearity.
C
C=
∑ ∑ [ ( , )] μ μ
where =
∑ i P
d(i,j)
i 2
=
∑ i
2P
d(i,j) - µ
i2and are the mean and standard deviation, i and j are the pixel values of the function Pd(i,j). Correlation will be high if an image contains a considerable amount of linear structure.
and are the mean and standard deviation, i and j are the pixel values of the function Pd(i,j). Correlation will be high if an image contains a considerable amount of linear structure.
4. Cluster Prominence
=
∑
∑
{ +
− μ −
µ
}
× P(i,j)
(4)
where, i and j are the pixel values of the function P(i,j), G is gray tone, and are the mean values of Px and Py. 5. Cluster Shade
=
∑
(
−
2µ)
( |
∆
,
∆
)
(5)
Where µ =
∑
( |
∆
,
∆
)
Δ Δ are the pixel distance occur within a given neighborhood, μ is the mean value, G- gray tone, Hs is the normalized sum histogram.
6.Dissimilarity
D
=
∑
,C
i, j
|i
−
j|
(6)
where, i and j are the spatial coordinates of the correlation function Ci,j. 7. Energy
One approach to generate texture features is to use local kernels to detect various types of texture. After the convolution with the specified kernel, the texture energy measure (TEM) is computed by summing the absolute values in a local neighborhood:
If n kernels are applied, the result is an n-dimensional feature vector at each pixel of the image being analyzed.
=
∑
∑
| ( , )|
(7)
where, i and j are the pixel values, m and n are the local kernels to detect various types of texture, C(i,j) is the absolute values of coefficient function.
8.Entropy
Entropy is a measure of information content. It measures the randomness of intensity distribution.
=
−
∑
∑
( , ) ln
( , )
(8)
where, C e= measure the entropy, N is the number of gray levels, i, j are the spatial coordinates of the function Pi,j. Such a matrix corresponds to an image in which there are no preferred gray level pairs for the distance vector d. 9. Homogeneity
A homogeneous image will result in a co-occurrence matrix with a combination of high and low P[i,j]’s.
C
h=
∑
∑
( , )
| |
(9)
where, i and j are the pixel values of the co-occurrence matrix function Pd[i,j], the range of graylevels is small the P[i,j]will tend to be clustered around the main diagonal.
10. Maximum Probability
This is simply the largest entry in the matrix, and corresponds to the strongest response. This could be the maximum in any of the matrices or the maximum overall.
Cm = max Pd [i.j] (10)
11.Sum of Squares, Variance
= ∑ ∑ ( − μ) ( , ) (11)
12. Local Homogeneity, Inverse Difference Moment (IDM)
IDM = ∑ ∑ ( ) P(i,j) (12)
IDM is also influenced by the homogeneity of the image. Because of the weighting factor IDM will get small contributions from inhomogeneous areas.
For the given samples of input Pap smear nuclei images, the GLCM features like Energy, Entropy, Contrast, Correlation, Cluster Shade, and Cluster Prominence are being calculated
from four different directions. The GLCMs are stored in a (i x j x n) matrix, where n is the number of GLCMs calculated usually due to the different orientation and displacements. And, the values i and j are equal to 'NumLevels' parameter of the GLCM computing function graycomatrix().
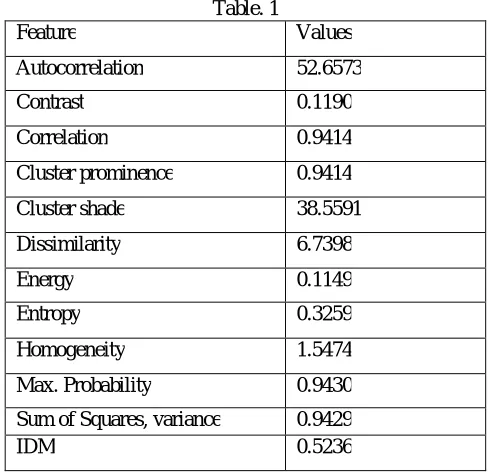
The extracted features in our proposed approach for our sample 1 are mentioned as,
Table. 1
Feature Values
Autocorrelation 52.6573
Contrast 0.1190
Correlation 0.9414
Cluster prominence 0.9414
Cluster shade 38.5591
Dissimilarity 6.7398
Energy 0.1149
Entropy 0.3259
Homogeneity 1.5474
Max. Probability 0.9430
Sum of Squares, variance 0.9429 IDM 0.5236
A. OPTIMISER- GENETIC ALGORITHM:
In this paper, as it has already been mentioned, an algorithm for the solution of the feature selection problem based on a Genetic Algorithm is presented. A genetic algorithm (GA) is a method for solving both the constrained and unconstrained optimization problems based on a natural selection process that mimics biological evolution.
The algorithm repeatedly modifies a population of individual solutions. At each step, the genetic algorithm randomly selects an individual from the current population and uses them as parents to produce the children for the next generation. Over successive generations, the population "evolves" toward an optimal solution. We can apply the genetic algorithm to solve problems that are not well suited for standard optimization algorithms, including problems in which the objective function is discontinuous, non-differentiable, stochastic, or highly nonlinear.
parents. In the classification phase of the proposed algorithm, a number of variants of the Neural Network classification method are used. Each cell is described by 12 features extracted from pictures of single human cells. The steps of the proposed Genetic Algorithm are given in the following steps:
D.1 ENCODING
Each individual in the population represents a candidate solution to the feature subset selection problem. Let m be the total number of features (from these features the choice of the features used to represent each individual is done). The individual (chromosome) is represented by a binary vector of dimension m. If a bit is equal to 1 it means that the corresponding feature is selected (activated); otherwise the feature is not selected. This is the simplest and most straight forward representation scheme.
D.2 INITIAL POPULATION
The initial population is generated randomly. Thus, in order to explore subsets of different numbers of features, the number of 1’s for each individual is generated randomly. Only different individuals are allowed. Thus, in the initial population there are not individuals with the same characteristics. With this way we gain the diversity of the initial population.
D.3 FITNESS FUNCTION
The fitness function gives the quality of the produced member of the population. In this problem, the quality is measured with the Root Mean Squared Error (RMSE) and the overall error. Thus, for each individual the classifiers are called and the produced RMSE and the overall error give the fitness function.
The steps of GA are as defined: Input: original sub-dictionaries Output: Learned sub dictionaries
1. Initialize N chromosomes, 1,1, 1,1 … … … . ,1 2. For generations 1 to G
3. Evaluate the fitness of each individual. 4. While population < N
5. Select individuals from the population to be parents
6. Call crossover operator to produce offspring 7. Call mutation operator
8. End while 9. End for
10. Return the best individual (the best solution) 11. Selecting the samples from original dictionaries using the best individual to form 1, 2, 3
B. NETWORK CLASSIFIER:
Pap test does not always produce good diagnostic performance. This problem has encouraged several studies to develop diagnosis system based on neural networks to increase the diagnostic performance. In order for neural networks to be used as cervical cancer diagnostic system, the features of cervical cell which are extracted as a result of previous section are used as inputs for neural networks and the classification of cervical cell type as either normal or abnormal are used as target of the output neuron. This study proposes new features of cervical cell that are suitable and can be used as inputs for neural networks for cervical cell classification. The new cervical cell features are extracted from GLCM and their suitability are tested by using neural network.
The structure of a neural network is formed by an “input” layer, one or more “hidden” layers, and the “output” layer. The number of neurons in a layer and the number of layers depends strongly on the complexity of the system studied. Therefore, the optimal network architecture must be determined. The general scheme of a typical three-layered ANN architecture is given in figure. Input Layers are loaded the data (extracted features). Create the network that has two output neurons namely normal and abnormal Pap smear cell. Each output neuron represents the class whether it is normal or abnormal. In recent years, the most common ANN used for pattern recognition and classification has been the Multi-Layered Perceptron (MLP) network. The MLP network is a feed forward artificial neural network model which consists of three main layers namely the input layer, hidden layer, and output layer. However, the MLP network is a highly non-linear neural network. In a linear system case, the system has to be approximated using the non-linear MLP network model. However, modeling a linear system using a non-linear model can never be better than using a linear model. Input vectors and target vectors are randomly divided into 70% - training, 15% - validation, 15% - testing. Here, we train and test the datasets and finally classify the cell.
IV. CASE STUDY
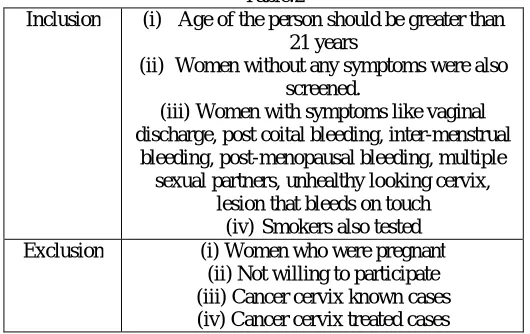
By means of early detection of HPV vaccine and making periodical screenings of pap smear helps in determining the precancerous cells. The removal of these precancerous cells makes this disease sometimes curable. The 95% of cervical cancer women gets cure by early diagnosis through screening. [22]. Form the study, it is noted that about more than 8 million women have not been screened over last five years and annual death rate due to cervical cancer was about 4K [23]. The methodology introduced in this paper is used to evaluate the samples collected by Verma et al. [24]. The test was conducted for a total of 200 women who was attending Gynecology OPD. The study had certain inclusion and exclusion clinical characteristics as same as [24] and it is listed as:
Table.2
Inclusion (i) Age of the person should be greater than 21 years
(ii) Women without any symptoms were also screened.
(iii)Women with symptoms like vaginal discharge, post coital bleeding, inter-menstrual
bleeding, post-menopausal bleeding, multiple sexual partners, unhealthy looking cervix,
lesion that bleeds on touch (iv)Smokers also tested Exclusion (i) Women who were pregnant
(ii) Not willing to participate (iii) Cancer cervix known cases (iv) Cancer cervix treated cases
During this study, for the volunteered women, the awareness was given regarding Pap smear screening, biopsy if it is required and the necessary follow – up to be made when there is any abnormal case.
All the women with cancer cells were given proper directions for treatment as per the guidelines by WHO. Some of the cancer cell samples are shown here in Fig. 3 and we have also tested the samples with our proposed methodology and the observations are presented in experimental analysis Section. V.
V. EXPERIMENTAL RESULTS
The proposed methodology is tested on the patients’ samples as mentioned in the case study and the corresponding experimental analysis is presented here in this section.
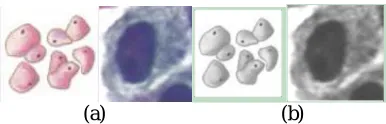
(a) (b)
Fig. 6 (a) Original samples and (b) Median filtered samples
(a)(b)
Fig. 8. Feature Selection using GA
(a) (b) Fig. 10. Performance validation
A. QUALITY METRICS
The quality metrics used to measure the performance of the automated system are: 1. Accuracy,
2. Sensitivity, and 3. Specificity.
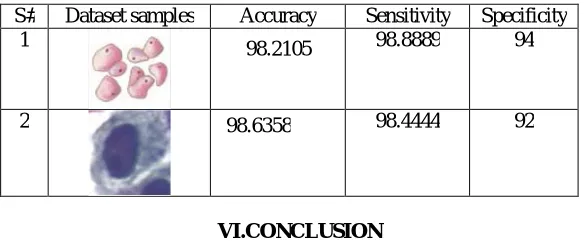
This metrics value for our proposed system which is computed for the test sample 1 and 6 is listed in Table. 2
Table 2. Quality Metrics
S# Dataset samples Accuracy Sensitivity Specificity 1 98.2105 98.8889 94
2 98.6358 98.4444 92
VI.CONCLUSION
From this case study, we clear that the Pap smear screening process are very much useful for the detection of precancerous cells. This obtained pre-cancerous are need to be classified into normal (non-cancerous) or abnormal (cancerous) cells. For such classification process, our automated system works well and it provides better accuracy as it is demonstrated in the experimental analysis section. Once these precancerous cells are detected it can be easily removed by the further treatment.Thus, improves the survival rate of the patient.
REFERENCES
[1] http://www.who.int/mediacentre/factsheets/fs380/en/ [2] http://www.nccc-online.org/hpvcervical-cancer/ [3] http://www.healthline.com/health/pap-smear
[6] M. Bazoon, D. A. Stacey, C. Cui and G. Harauz, A Hierarchical Artificial Neural Network System for the Classification of Cervical Cells Classification with ANNs, pp. 3525–3529, (1993).
[7] K. Tumer, N. Ramanujam, J. Ghosh and R. Richards-Kortum, Ensembles of Radial Basis Function Networks for Spectroscopic Detection of Cervical Precancer, IEEE Transactions on Bio-Medical Engineering, vol. 45(8), pp. 953–961, (1998). http://doi.org/10.1109/10.704864. [8] P. Mitra, S. Mitra and S. K. Pal, Staging of Cervical Cancer with Soft Computing, IEEE Transactions on Biomedical Engineering, vol. 47(7),
pp. 934–940, (2000).
[9] Zhong. L. Z. Li and K. Najarian, Automated Classification of Pap Smear Tests Using Neural Networks, IJCNN’01. International Joint Conference on Neural Networks. Proceedings (Cat. No.01CH37222), vol. 4, pp. 2899–2901, (2001).
[10] Takashi Ochi, K. Murase, T. Fujii, M. Kawamura, J. Ikezoe and T., O., . . . J., I., Survival Prediction Using Artificial Neural Networks in Patients with Uterine Cervical Cancer Treated by Radiation Therapy Alone, International Journal of Clinical Oncology, vol. 7(5), pp. 294– 300, (2002).
[11] N. Ampazis, G. Dounias and J. Jantzen, Pap-Smear Classification Using Efficient Second Order Neural Network Training Algorithms, pp. 230–245, (2004).
[12] K. Kim, D. H. Song and G. Kim, Nucleus Segmentation and Recognition of Uterine Cervical Pap-Smears Using Region Growing Technique and Fuzzy RBF Network, Image (Rochester, N.Y.), pp. 153–160, (2007).
[13] Francisco. J., Gallegos-Funes, M. E. G´omez-Mayorga, J. L., Lopez-Bonilla and R. Cruz-Santiago, Rank M-Type Radial Basis Function (RMRBF) Neural Network for Pap Smear Microscopic Image Classification, Apeiron, vol. 16(4), pp. 542–554, (2009).
[14] Y. Jusman and S. Sulaiman, Capability of New Features from FTIR Spectral of Cervical Cells for Cervical Precancerous Diagnostic System Using MLP Networks, Tencon 2009-2009 . . . , pp. 1–6, (2009).
[15] Royan. D. Aldian, E. Purwanti and M. A. Bustomi, Applied Computing Based Artificial Neural Network for Classification of Cervical Cancer, pp. 4–7, (2013).
[16] M. Kusy, B. Obrzut and J. Kluska, Application of Gene Expression Programming and Neural Networks to Predict Adverse Events of Radical Hysterectomy in Cervical Cancer Patients, Medical & Biological Engineering & Computing, vol. 51(12), pp. 1357–65, (2013).
[17] N. Wickramasinghe, L. Al-Hakim, C. Gonzalez and J. Tan, Service S. (Online. (2014). Lean Thinking for Healthcare, XXXII, 645 p. 178. [18] Babak Sokouti, S. Haghipour and A. D. Tabrizi, A Framework for Diagnosing Cervical Cancer Disease Based on Feedforward MLP Neural
Network and ThinPrep Histopathological Cell Image Features, Neural Computing and Applications, vol. 24(1), pp. 221–232, (2014). [19] A. S. Phatak and B, P. A., Classification of Mr Images of Cervical Cancer Using SVM and ANN Engineering, issue 2277, (2015). [20] Gonzalez RC (2012) Digital image processing, 3rd edn. Pearson Education, New York
[21] https://www.google.co.in/?gfe_rd=cr&ei=CS5aWJqnF6zx8Ae7vZmIDg#q=GLCM+matrix+image [22] https://www.kaggle.com/c/cervical-cancer-screening
[23] https://kaggle2.blob.core.windows.net/competitions/kaggle/4494/media/2015%20Cervical%20Cancer%20Patient%20Survey.pdf
[24] Ashok Verma, Suresh Verma, Shivani Vashist, Sumit Attri, Amrita Singhal, A study on cervical cancer screening in symptomatic women using Pap smear in a tertiary care hospital in rural area of Himachal Pradesh, India, Middle East Fertility Society Journal, Available online 30 September 2016.