DESIGN AND REALIZATION OF A FLAT-TOP SHAPED-BEAM ANTENNA ARRAY
H. J. Zhou, Y. H. Huang, B. H. Sun, and Q. Z. Liu National Key Laboratory of Antennas and Microwave Technology Xidian University
Xi’an, Shaanxi 710071, China
Abstract—The design and realization of a ten-element shaped-beam antenna array are presented. A flat-top pattern in the main beam which allows a well-proportioned power distribution in desired zone is achieved by optimizing the amplitudes and phases of array elements using genetic algorithm. Being different from the most optimization in reported literatures, the proposed synthesis has taken the actual element patterns but identical and isotropic ones into account, which can reduce the error between computation and realization. Besides, both the optimized amplitudes and phases are set to be realizable. The array operating at 1.71–1.74 GHz is manufactured and measured. The measured radiation patterns of the proposed array show a flat-top main beam of about 40◦ and a peak side-lobe level of −20 dB, exhibiting a good agreement with the simulated results.
1. INTRODUCTION
In wireless communication systems, antennas with shaped-beam radia-tion patterns have been widely used for better power managements [1– 3]. The shaped radiation patterns are usually realized by controlling the feeding amplitudes and phases of antenna array elements. This problem has received much attention in recent years [4–6]. However, most reported literatures regarded the element patterns as identical and isotropic in the array pattern synthesis. This will surely make the synthetical results inaccurate. Moreover, both the optimized feeding amplitudes and phases of array elements shouldn’t fluctuate acutely for easy realization of the feeding network.
2.1. Array Element
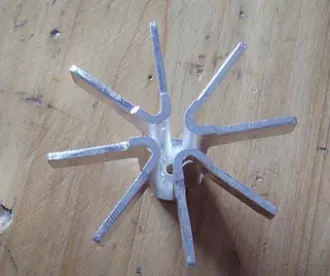
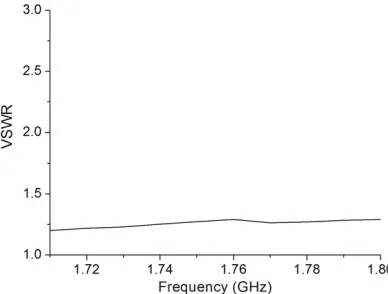
The wideband cross-dipole antenna which has been used in commercial base station is chosen as the array element. Figure 1 gives the prototype of the dipole. The VSWR against frequency for the proposed dipole is measured with a Wiltron-37269A network analyzer and depicted in Figure 2. It is seen from the measured results that the proposed antenna exhibits a good impedance match characteristic over 1.71–1.74 GHz.
Figure 1. Prototype of the array element.
Figure 2. Measured VSWR of the proposed array element.
2.2. Array Synthesis and Optimization
Since the radiation pattern of an equally spaced linear array distributed along the z axis with element spacing d= 128 mm will be optimized, we begin with the general expression of the far filed of a N-element (N = 10) linear antenna array, given by:
E(θ) =
N
n=1
gn(θ)·anexp[j(k(n−1)dcosθ+βn)] (1)
Here, k = 2π/λ is the free space wave-number, and d denotes the element spacing of the array. The amplitude and phase weights of the nth element are an and βn, respectively. The expression gn(θ) represents the radiation pattern of thenth element.
For synthesizing the desired pattern, element excitation (an, βn) will be optimally determined by genetic algorithm. In this paper, we choose the conventional GA and set the following GA parameters consistently during the optimization: population size = 200, number of the maximum generation = 100, selection type = tournament, crossover type = uniform, crossover probability = 0.85, mutation probability = 0.3. The fitness function for this study is defined in the following manner.
For each field sample point in shaped-beam regions, the relative error is the difference between the actual power level and that of the desired pattern over M total sample points:
pattern must be considered. The PSLL can easily be searched out in side-lobe regions and the difference between the computational PSLL and the desired can be expressed as:
EM B=P SLLactual−P SLLdesired (4)
To control the actual pattern both in the shaping region and in the predetermined side-lobe regions, weighting factor w is included in the fitness function, given as:
f itness = w×EM A+EM B
= w×
1
M
M
m=1 |em|2
1
2
+ (P SLLactual−P SLLdesired)(5)
An optimized pattern with a flat-top main beam of about 40◦ and a peak side-lobe level of −20 dB is obtained by GA completed with a MATLAB program. Some parameters are set as follows: weighting factor w = 2.5, P SLLdesired = −20 dB, total sample points M = 41.
The optimized excitation distribution is given in Table 1. It can be seen from the table that the current amplitude taper ratio is −9 dB. This will simplify the realization of the feed network without doubt.
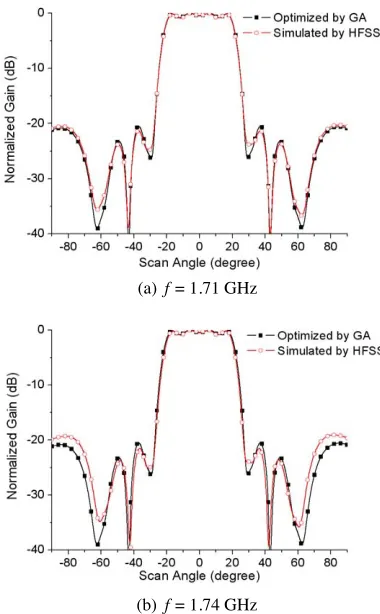
For the easy realization of the feeding network, we have made the amplitude and phase distributions to be symmetric by strong hand in the optimization. The comparison of the optimized radiation patterns obtained by GA and that simulated by Ansoft high-frequency structure simulation (HFSS) is shown in Figure 4. The good agreement between the two results proves the validity of the proposed design.
2.3. Feeding Network
A (1 : 10) way hybrid feeding network which consists of a microstrip power divider and some 50 Ω-cables has been designed for realizing the array excitations. The microstrip power divider deals with the amplitude distribution while the cables aim at the phases. The hybrid
(a) f= 1.71 GHz
(b) f= 1.74 GHz
Table 2. Measured excitation distribution of the proposed feeding network.
Port Number 1 2 3 4 5 6 7 8 9 10
Power distribution
in simulation (dB)
(Normalized)
-9.0 -9.0 -1.25 0.0 0.0 0.0 0.0 -1.25 -9.0 -9.0
Measured Power
Distribution (dB)
(Normalized)
-8.9 -9.0 -1.4 0 -0.2 -0.3 -0.3 -1.3 -9.1 -9.2
Measured phase
Distribution ( )
64.8 139.4 208 240 312.5 318 248.2 212.4 149.8 77
Figure 5. Photograph of site measurement of the proposed array assembled with feeding network.
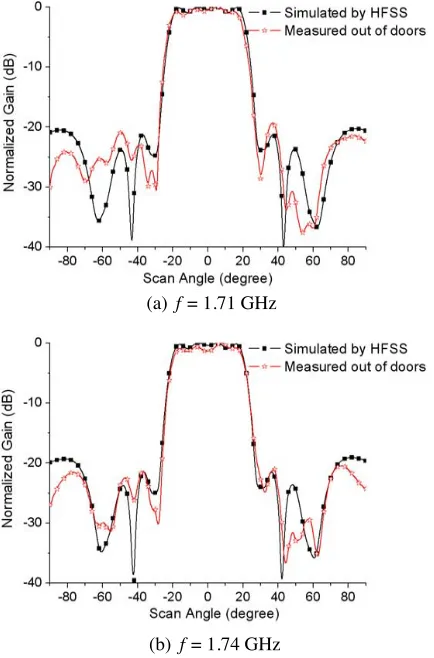
(a) f= 1.71 GHz
(b) f= 1.74 GHz
Figure 6. Comparison of simulated and measured radiation patterns.
2.4. Measured Results and Discussion
The radiation pattern of the proposed shaped antenna array is measured in the open air as shown in Figure 5. The comparison of the simulated and measured results is plotted in Figure 6, where we can see the maximal ripple in the measured shaped-beam region covering
−20 dB. Besides, good agreement between the computed and measured results proves the validity of the proposed design.
REFERENCES
1. Buckley, M. J., “Synthesis of shaped beam antenna patterns using implicitly constrained current elements,” IEEE Trans. on Antennas and Propag., Vol. 44, 192–197, February 1996.
2. Donelli, M., S. Caorsi, F. de Natale, D. Franceschini, and A. Massa, “Versatile enhanced genetic algorithm for planar array design,” Journal of Electromagnetic Waves and Applications, Vol. 18, No. 11, 1533–1548, 2004.
3. Lu, Y. Q., “Optimization of broadband top-load antenna using micro-genetic algorithm,” Journal of Electromagnetic Waves and Applications, Vol. 20, No. 6, 793–801, 2006.
4. Villegas, F. J., “Parallel genetic-algorithm optimization of shaped beam coverage areas using planar 2-D phased arrays,” IEEE Trans. on Antennas and Propag., Vol. 55, 1745–1753, June 2007. 5. Lei, J., G. Fu, L. Yang, and D. M. Fu, “An omnidirectional printed dipole array antenna with shaped radiation pattern in the elevation plane,” Journal of Electromagnetic Waves and Applications, Vol. 20, No. 14, 1955–1966, 2006.