ISSN 2286-4822 www.euacademic.org
Impact Factor: 3.4546 (UIF)
DRJI Value: 5.9 (B+)
Assessment of Climate Change Impact and
Vulnerability to Climate Change among Livestock
holder in Chitwan District, Nepal
SURYA MANI DHUNGANA
Assistant Professor Department of Agricultural Economics and Agribusiness Management Faculty of Agriculture Agriculture and Forestry University Rampur, Chitwan
Abstract:
The research was done in order to assess vulnerability to climate change for livestock raising households in Chitwan district of Nepal. The six different villages namely, Gitanagar, Patihani, Padampur, Megauli, Gunjanagar and Ayodhyapuri of Chitwan district were purposively selected for the study. The 60 households from each VDC and altogether 360 household were randomly selected. The descriptive statistics as well as trend analysis was used to study the different socio-demographic variables and climatic pattern. The integrated vulnerability assessment approach was used to assess the climate change vulnerability to the livestock holders in the study area. Annual incremental the temperature and rainfall over the past 30 years were 0.0430C and 0.93 mm respectively. All of the respondents
The major barriers were lack of information about the climate change and appropriate tools and techniques for adaptation. The own farming experience and knowledge was the major minimizing tools against the adverse climate in the study area. The Principal Component Analysis (PCA) was fitted in the integrated vulnerability approach to find out the index that was 10.99 for the study area. This results shows that the study area is less vulnerable to climate change as the adaptive capacity is high.
Key words: Adaptation, Barriers to adaptation strategy, Livestock holder, Principal Component Analysis and Vulnerability
1 INTRODUCTION
difficulties due to the lack of proper adaptation efforts (Orindi and Eriksen 2005) . This research primarily focuses on to study an adaptation and mitigation strategy for livestock raising household vulnerable to climate change.
2. RESEARCH METHODOLOGIES
The study was conducted in the central region of inner Terai of Nepal. Chitwan district was purposively selected for the study. The study focused on vulnerable climate change for raising livestock and farming purpose in six different villages namely, Gitanagar, Patihani, Padampur, Megauli, Gunjanagar and Ayodhyapuri purposively.
Source: (CBS 2012)
Figure 1. Map of Nepal showing the study district
In each VDC, there were random selections of 60 household as a sample of study. Thus altogether, samples were 360 household. In this study both, the primary and secondary data were collected and analyzed. Fieldwork was conducted mainly
through semi-structured interviews and pre-tested
face-to-face interview. The progressive farmers and local leader were interviewed with the preparation of checklist and their perceptions were collected. Information obtained from the interview was crosschecked during the FGD. Additional information on various community based adaptation strategies, difference observed in the present and past regarding the farming practices were collected through FGD. The major variables included in interview schedule were farmers’ perception and their adaption strategies for livestock production. A comparative climatic pattern for last 30 years period to the present was obtained from the metrological station Rampur. The analysis was also done by making graph, pie chart, counting frequency and many other methods.
Empirical models for calculating vulnerability of climate change
The integrated assessment approach combined both socioeconomic and biophysical approaches as this study is exploratory, the selection of indicators or themes is based on the analysis of responses from local society and previous vulnerabilities, how and why they are vulnerable. Vulnerability assessment of the people to the impacts of climate change will be carried out by using Principal Component Analysis where:
Vulnerability = (adaptive capacity) - (sensitivity + exposure)
Which is, V= (wA1+wA2...wAn) − (wS1+wS2...wSn−wE2+wE2...wEn)
Where, V is vulnerability index, w is the weight for each variable, A1-An the adaptive variables, S1-Sn sensitivity variables and
E1-En exposure variables.
Indexing
The intensity of problems and reasons were identified by using five point scaling technique comparing most important, somewhat important, important, and less important and least important using scores of 1.00, 0.80, 0.60, 0.40, and 0.20, respectively. The formula given below was used to find the index for intensity various problem/reasons.
Iprob=∑
N
f
S
i iWhere,
Iprob = Index value for intensity of problem Si = Scale value of ith intensi
fi = Frequency of ith response N = Total number of respondent
3. RESULTS AND DISCUSSION
Description of the study area
Chitwan district is located at the central part of the country with an area of 2238.39 square kilometer ranging from 144 to 1947 m AMSL (DADO 2013). Therefore, all types of climate are prevalent in Chitwan. Annual rainfall was recorded 2666.3 mm; maximum temperature of 42.5ºC and minimum 7ºC with 83 % relative humidity (DADO 2013). The district consists of three major topographic divisions; Mahabharata hills in the north, Siwalik Hills in the south and in between lay the inner Terai valley region. The livestock holding in Chitwan district is hereunder.
Table 1. Livestock holding Chitwan District 2012/2013
S.N. Types of livestock Number
1 Cattle 72970
2 Buffalo 113609
3 Goat 188101
4 Sheep 3374
5 Pig 9824
6 Poultry 5406020
Average livestock holding in the study area
The major livestock and birds reared in the study area were cow, buffalo, poultry, sheep, goats and pig. To study the total livestock holding by common unit, Livestock Unit (LSU) was used converting all the livestock species in a single unit. The aggregated LSU was calculated as explained by (Adhikari 2009). LSU = 1 (cattle) + 1.5 (buffalo) + 0.6 (pig) + 0.4 (goat/sheep) + 0.02 (poultry). Average livestock holding was 3.61 LSU with standard deviation of 1.41.
Trend of Climatological data in the study
The trend analysis showed an increase in the minimum, average and maximum temperature significantly over 35 years period with 0.077, 0.043, and 0.010 0C respectively (Figure 2).
According to (Baidhya, Regmi and Shrestha 2007), the national average temperature increase in Nepal is 0.042 0C per year,
which is less than the average maximum temperature in the study area. The detailed analysis (Practical Action 2009) looking over a period of 30 years (1976-2005) reports that maximum and mean temperatures are rising. This evidence is sufficient to prove that the farmers perception of hotter summer and less colder winter. The equation for temp was hereunder
ymaxtemp= 0.0103x+ 10.252 (R2= 0.0319)……….1
yavegtemp= 0.0438x-63.043 ( R2= 0.5308)………..2
ymintemp=0.0772x-136.34 ( R2= 0.5308)………..3
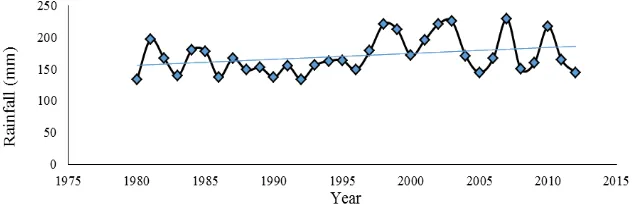
Trend of rainfall in Rampur Station
It was found that there is remarkable variation in the rainfall pattern. The rainfall in 2007 was found to be highest with 228.55 mm and lowest in 1980 with 132.6 mm annually. The annual rainfall decreased from mid-eighties to mid-nineties, which then raise up to 2010 with yearly fluctuation and ultimately dropped around the same level of rainfall of 1980s’ in 2012. These findings are in line with the farmers’ perception about increase in drought and short and late monsoon these days. Average annual rainfall is approximately 1800 mm (GON 2010); the trend line shows that the total rainfall increased with 0.93mm per year in the Rampur station which is less than the national annual rainfall 5.17 mm.
The estimated equation of rainfall for 30 year was hereunder
Yrainfall=0.932x-1690 (R2= 0.098)………..4
Figure 3. Trend of rainfall in (mm) in Rampur Station (1980-2014)
Farmers level of knowledge about climate change in the study area
Table 2. Level of knowledge about the climate change in the study area
Level of knowledge Frequency
More clearly 66(18.33)
Clearly 129(35.83)
A little bit 165(45.84)
Figures in parenthesis indicate the percentage
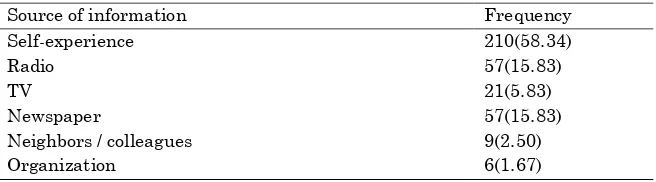
Source of information about climate change in the study area
It was revealed that the self experience (58.33%) was primary source of information about climate change. The newspaper and radio were equally used by population in the study area with 15.83% each. Television ,organization and neighbours or colleagues were least used as source of information about 10%.
Table 3. Source of information about the climate change in the study area
Source of information Frequency
Self-experience 210(58.34)
Radio 57(15.83)
TV 21(5.83)
Newspaper 57(15.83)
Neighbors / colleagues 9(2.50)
Organization 6(1.67)
Figures in parenthesis indicate the percentage.
Perception about the change in various parameters related to climate and the livestock management
pronounced than the past. The incidence of disease and pest in the present was expressed as serious (54.17%) than in the past that was less serious (53.33%). The incidence of parasite in the livestock was less serious in the past (54.17%) as compared to present which was found to be serious (43.33%). While talking about the loss of forage and pasture land, the households opined that the trend was serious (60.00%) in the present than past which was intermediate (55.83%).
Table 4. Perception about the change in various parameters related to climate and the livestock management
Change in
parameter
Time Extreme High Intermediate Low None Hailstorm Present 0(0.00) 84(23.33) 72(20.00) 120(33.34) 84(23.33)
Past 13(10.83) 114(31.67) 72(20.00) 114(31.67) 28(5.83) Hot weather Present 66(18.33) 228(63.34) 63(17.50) 3(0.83) 0(0.00)
Past 15(4.16) 126(35.00) 195(54.17) 24(6.67) 0(0.00) Extreme cold Present 36(10.00) 93(25.84) 90(25.00) 111(30.83) 30 (8.33)
Past 72(20.00) 135(37.50) 60(16.67) 93(25.83) 0(0.00) Cloudy weather Present 6(1.67) 27(7.50) 138(38.33) 171(47.50) 18(5.00)
Past 135(37.50) 117(32.50) 72(20.00) 36(10.00) 0(0.00) Drought spell Present 153(42.50) 156(43.33) 45(12.50) 6(1.67) 0(0.00)
Past 0(0.00) 6(1.67) 102(28.33) 204(56.67) 48(13.33) Disease pest
incidence
Present 99(27.50) 195(54.17) 57(15.83) 9(2.50) 0 (0.00) Past 6(1.67) 9(2.50) 111(30.83) 192(53.33) 42(11.67) Parasite in livestock Present 120(33.33) 156(43.33) 84(23.34) 0 (0.00) 0 (0.00)
Past 0 (0.00) 3(0.83) 99 (27.50) 195(54.17) 63(17.50) Grassland and
forage loss
Present 102(28.33) 216(60.00) 39 (10.84) 3(0.83) 0 (0.00) Past 3 (0.83) 102(28.33) 201(55.84) 51(14.17) 3(0.83) Figures in parenthesis indicate the percentage.
Sectors affected by climate change
The study revealed that the climate change had serious impact in the various sectors. The majority of the affected sector was crops, livestock and fish farming about 66% and 29% respectively. According to respondent the fruits and vegetables production was least affected by climate change (5%).
Figure 4. Climate change severely affected sectors
Perception of respondent on change in livestock performance
Infertility in livestock
The study related to infertility status was found to be higher in all the livestock. More than 50% of the respondent expressed that infertility problem is ever increasing. Less than a half of the respondent expressed that they had not yet noticed the infertility in the livestock but surprisingly, less than 10% of the respondent said that infertility is decreased due to climate change in cattle and goat.
Table 5. Perception about the livestock infertility by household in study area.
Livestock Increased Decreased Don’t Know
Buffalo 312(86.67) 0 (0.00) 48 (13.33)
Cattle 204 (56.67) 30 (8.33) 126(35.00)
Goat 192 (53.33) 12 (3.33) 159(44.17)
Figures in parenthesis indicate the percentage
Perception about production performance of livestock
impact in the poultry production as only few households had reared the poultry for the household and commercial purpose.
Table 6. Respondent Perception towards production performance of different livestock
Livestock Increased Decreased Don’t Know
Buffalo 6 (6.67) 288(80.00) 48 (13.33)
Cattle 36(3.33) 232(61.67) 126(35.00)
Goat 87(24.17) 114(31.66) 159(44.17)
Poultry 57(15.83) 0 (0.00) 303(84.17)
Figures in parenthesis indicate the percentage
Reasons for declining livestock performance
The primary cause leading to decline in the livestock performance were heat stress (87.50%), fodder and grazing land unavailability (94.17%), high disease prevalence (90.83%) and decrease in labor force (66.67%) whereas lack of market (36.67%) and water shortage (31.67%) were less responsible for the decline.
Figure 5. Reasons for declining the livestock performance
Various adaptation strategy adopted by farmer in the study area
Adaptation strategies followed in the study area
The various adaptation strategies were adopted in the study area. Livestock diversification (93.59%) was the most adopted adaptation strategy among all the strategy. The livestock feed supplement, changing herd composition, and taking credit was adopted almost equally (about 59%). Shifting the livestock farming to other off farm activities were adopted by almost half of the adopters. About 43% of the households grew fodder and stored the hay silage, improved pastures or grazing land and maintained and enhanced genetic breed as adaptation strategies. The various adaptation strategy followed are shown in Table 8.
Table 7. Various adaptation strategies followed in the study area (n=234)
Adaptation strategies Frequency
Livestock diversification 219(93.59)
Livestock feed supplement 174(74.36)
Shifting from livestock farming to off farming activities 144(61.54)
Changing herd composition 168(71.79)
Taking credit 180(76.92)
Maintaining and enhancing genetic breed 120(51.28)
Improving pastures or grazing land 126(53.85)
Growing fodder and storing of hay silage 132(56.41) Figures in parenthesis indicate the percentage
Barriers to adaptation strategy
Table 8. Various barriers against the adaptation strategy
Reasons Index Rank
Lack of information about climate change 0.69 I
Lack of knowledge concerning appropriate adaptation 0.59 II
Lack of credit or poverty 0.56 III
No barrier to adaptation 0.55 IV
Poor market and transport facility 0.53 V
Lack of technology 0.46 VI
No access to water 0.41 VII
Source of techniques to minimize the adverse impact of climate change in the study area
The primary source of effect of the technique to minimize the adverse effect of climate change were own knowledge and farming experimenting for about 47% households. The other sources of the techniques were from the other farmer and neighbor (16.7%), media (15%), and training and education (14.2%). The contribution from developmental organization and agriculture and livestock service center in the adaptation to adverse climate was least with 4.2, and 3.3 percent respectively.
Figure 6. Source of techniques to minimize the adverse impact of climate change in the study area
Assessment of the climate change vulnerability in the study area
The vulnerability was calculated using the integrated
Analysis (PCA) calculated using SPSS showed that ten components with Eigen Value 1 or greater accounted the 66.75 percent of the total variance. The first component had the Eigen Value of 2.83 with variance of 11.82 percent followed by second component with Eigen Value 2.15 and total variances of 8.97 percent. Similarly, other components are shown in the table 9.
The vulnerability index of the study area was found to be 10.99, which implies that the study area was less vulnerable. The similar result was found in the tropical region of Nepal with vulnerability index of 8.1. The tropical region are found to be less vulnerable to climate change as the households have high literacy rate, more income source and earning and hi tech technology and proper access to infrastructure. The populations in the tropical area have better employment and earning off farm income. This expansion of the economic undertakings and access to the infrastructure technology make the households less dependent in the livestock that is more sensitive to climate change. The least occurrence of the drought and floods and no presence of the landslides lead to less vulnerability. The provisions of the more adaptive factors are responsible for reduction of vulnerability (Dhakal, et al. 2013).
Table 9. Principal component score of the variable used for the vulnerability
Indicators
Score Types of
variables Social background of the household 0.49 Adaptive capacity
Family type 0.62 Adaptive capacity
Education status of household 0.77 Adaptive capacity
Primary (major) occupation 0.67 Adaptive capacity
Total cultivated land 0.65 Adaptive capacity
Land ownership 0.64 Adaptive capacity
Radio 0.62 Adaptive capacity
Television 0.66 Adaptive capacity
Bus truck vehicle 0.66 Adaptive capacity
Toilet 0.80 Adaptive capacity
LPG stoves 0.65 Adaptive capacity
Monthly expenditure 0.47 Adaptive capacity
Source and technique minimize climate change effect 0.67 Adaptive capacity
Indicators
Score Types of
variables Training on agriculture and livestock management 0.78 Adaptive capacity
Access to subsidy 0.59 Adaptive capacity
LSU 0.71 Adaptive capacity
Years of schooling 0.85 Adaptive capacity
Types of household 0.71 Adaptive capacity
Information source about climate change 0.70 Adaptive capacity
Barrier to adaptation 0.61 Sensitivity
Flood 0.56 Exposure
Temperature 0.66 Sensitivity
Rainfall 0.68 Sensitivity
Vulnerability index 10.99
CONCLUSION
ACKNOWLEDGMENT
The research was supported by Directorate of Research and
Extension, Agriculture and Forestry University
(www.afu.edu.np), Rampur, Chitwan, Nepal. I am deeply indebted to the households in my study area, who are too numerous to mention individually, but without whose cooperation this study would not have been possible. Errors, if any, are entirely my own.
LITERATURE CITED
Adhikari, J. "Decision for survival: Farm management strategies in the mid hills of Nepal." 92-109. Delhi: Adriot Publishers, 2009.
Baidhya, S K, R K Regmi, and M L Shrestha. Climate Profile
and Observed Climate Variability in Nepal. Annaul
report, Kathmandu, Nepal: Department of Hydrology and Meterology, 2007.
CBS.2012.http://cbs.gov.np/wpcontent/uploads/2012/Gis_Maps/ General/Administration%20Divisions.gif. (accessed May 4, 2014).
DADO. Annual Agriculture Development Program and
Statistical Information Book. Annual Book, Chitwan,
Nepal: Disitrict Agriculture Development Office, 2013. Dhakal, C K, P P Regmi, I P Dhakal, B Khanal, and U K
Bhatta. "Livelihood vulnerability to climate change based on agro ecological regions of Nepal." Global
Journal of Science Frontier Research 13, no. 11 (2013).
DLSO. Annual Livestock Development Program and Statistical
Information Book. Annaul book, Chitwan, Nepal:
District Livestock Service Office., 2013.
Eriksen, S. "Sustainable Adaptation to CLiamte change."
GON. National Adaptation Programme of Action ( NAPA).
Monthly Mangine, Kathmandu: Ministry of
Environment ,Government of Nepal, 2010.
IPCC. Climate Change 2001: Impacts, Adaptation and
Vulnerability. Assessment Report, Cambridge , UK and
Newyork, USA: GRID-Arendal, 2003.
IPCC. Impacts, Adaptation and Vulnerability. Contribution of
Working Group II to the Four. Cambridge, United
Kingdom and Newyork, USA.: Cambridge University Press, 2007 b, 976.
IPCC. Mitigation of Climate Change, Contribution of Working Group III to Report of Intergovernmental Panel on
Climate Change. Assessment Reprot, Cambridge , UK
and NewYork, USA: Cambridge University Press, 2007c, 851.
Lama, S, and D Bhupendra. "Vulnerability of Mountain Communities to Climate Change and Adaptation
Strategies." The Journal of Agriculutre and
Environment 10, no. 4 (2009): 8-9.
MOAD. Selected indicators of Nepalese agriculture and
population. Annaul Report, Kathmandu: Agricbusiness
and Statistics Divisions , MOAD, Goverment of Nepal, 2012.
Mool, P K, S R Bajrachaya, and S P Joshi. Inventory of Glaciers , Glacial Lakes and Glacial Lake Outbrust Floods Monitoring and Early warning Systems in the Hindu
Kush Himalayan Region Nepal. Woriking paper,
Kathamandu: ICIMOD, 2001, 363.
Orindi, V A, and S Eriksen. "Mainstreaming adaption to climate change in the development process in Uganda."
2005. http://www.acts.or. ke/pubs/
Practical Action. Temporal and Spatial Variability of Climate
Change over Nepal. Report, Nepal: Practical Action,
2009.
Regmi, B, and A Adhikari. Local Initiatives for Biodiversity, Research and Development in Human Development
2007/2008 Report: Fighting Climate Change. Country