Optimal Sizing &Placement of D-STATCOM
in Radial Distribution System using Power
Loss Index and Bio Inspired Algorithm
Manjappa.N1, Vittal Bhat.M2
Assistant Professor, Dept. of EEE, University Visvesvaraya College of Engineering, Bengaluru, India1
PG Scholar in Power & Energy Systems, University Visvesvaraya College of Engineering, Bengaluru, India2
ABSTRACT:An effective methodology is proposed in this paper to optimally size and place the D-STATCOM in distribution system usingPower Loss Index (PLI)and bio inspired algorithm known as Flower Pollination Algorithm (FPA). The main objective is to minimise the overall cost. The intension is also to maintain the voltage magnitude of candidate bus at 1 p.u. and to provide reactive power compensation.The candidate bus selection for installation of D-STATCOM is determined by PLI. The effectiveness of FPA is tested on IEEE-33 bus Radial Distribution System (RDS) to derive the location and sizing of D-STATCOM inputting the selected candidate buses. The simulation results validate that the proposed approach is proficient in finding optimum solutions.
KEYWORDS:Flower Pollination Algorithm (FPA), Power Loss Index (PLI), Radial Distribution System (RDS).
I.INTRODUCTION
In the distribution systems, the losses are about 13% of the power generated [1].Installing D-STATCOM at suitable buses will diminish the losses, in turn improves the voltage profile and the stability of the system. Various equipment have been used to improve the performance and efficiency of distribution system to satisfy the consumer. With advances in technology, FACTS devices such as D-STATCOM, UPFC, SSSC and other equipment such as reactors, capacitors, AVRs etc. are used for compensation purpose [2]. Compared to other devices, D-STATCOM produce less harmonics, low power loss and are compact in size [3].
D-STATCOM is a Voltage Source Converter (VSC) connectedin shunt configuration in distribution networks acts as a compensator. It can inject exactlagging or leading current for compensation when it deals with a particular load so that the requirement of utility connection can be met by the total demand [4]. It plays asubstantial role in the RDSas the demand on the power system is growing day by day. Maximizationof loadability, minimization of power loss, enhancement of stability and power quality can be achieved by optimal allocation of D-STATCOM [5]. Literature survey reveals that the optimal allocation of D-STATCOM has a majorimpact on RDS. Incorrectallocation in some circumstances can lessenthe benefits and maythreaten the operation of whole system [6]. Optimal allocation of D-STATCOM in RDS with reconfiguration technique using differential evolution algorithm is proposed in [7]. Animmune algorithm [8] and particle swarm optimization [9] are implementedtominimize the power loss and total cost by optimally sizing and locating the D-STATCOM.
II.SELECTION OF CANDIDATE BUSES BASED ON POWER LOSS INDEX
The selection of candidate buses for the placement of D-STATCOM is based on PLI. The area of search is significantly reduced and therefore the time expended in the optimization process. The disadvantage of PLI is the indispensable calculations to be done. Load flow should be performed by injecting reactive power at each bus (except slack bus) to determine the real power loss reduction [10]. The PLI is calculated by the following expression:
PLI(i)
=
( )−− (1)Buses with larger PLI will be prioritized as candidate bus for installation of D-STATCOM.
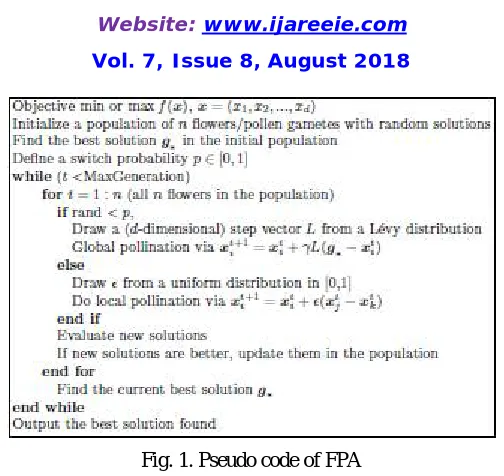
III.FLOWER POLLINATION ALGORITHM
This optimization algorithm is a nature inspired population algorithm proposed by Xin-She Yang (2012). The popularity of nature inspired algorithm is mainly inspired by the ability to biological systems to effectively adjust to the frequent changeable environment [11]. FPA is more efficient and outperform when compared with other algorithms. The process is mainly classified as biotic and abiotic, which can be further classified as self and cross pollination.
Steps involved in FPA are:
1. Biotic and cross-pollination represents global pollination.
2. Local pollination can be represented by abiotic pollination and self-pollination are used.
3. In the absence of pollinators, the process is said to be self-pollination or abiotic pollination, in turn represents local pollination
4. p∈ [0, 1] is a switch probability between global pollination and local pollination.
Steps 1 to 4 are updated in terms of equations. During global pollination, flower pollen gametes are transferred by the pollinators, hence longer distance is covered by pollen. Therefore, steps for flower constancy and global pollination can be represented by:
= + ( )( ∗− ) (2)
The Lévy flight L(λ) is the step size employed to cover the larger distances efficiently. ForLévy distribution,L > 0.
L ~ Γ( ) ( /2) 1+1 , ( ≫ ≫0) (3)
The standard gamma function Γ(λ) is used here and for the larger steps x > 0, the distribution is considered to be valid.
Step 2 and Step 3 for the local pollination can be represented as
= + − (4)
Where xtn and xtp are dissimilar pollens of the same plant species. ε is taken as [0, 1] from a uniform distribution if xtn
and xtp comes from the same species at the time of random local walk.
Fig. 1. Pseudo code of FPA
IV.OBJECTIVE FUNCTION
The prime motive is to diminish the total cost, as defined in the below equation:
= ∗ ∗ + ∗ ∑ + ∗ (5)
Where PLoss is net loss after compensation, b is no of buses to be compensated, and rating of the installed capacitor is
Qcrin kVAr. Values of objective function parameters are mentioned in table 1.
Cost per kWh (CTp) Cost per kVAr (CTc) Cost per installation (CTi) Duration in hours (D)
0.06$/kWh 50$/kVAr 1000$ 8760
TABLE I. Objective Function parameters
The following constraints must be satisfied: Equality constraint:
Constraint for load flow:
Equality constraint can be defined as:
∑ = ∑ +∑ (6)
Inequality constraints: Constraint for voltage:
The magnitude of voltages at each bus must lie within minimum voltage Vbmin and maximum voltage Vbmax.
≤| |≤ (7)
Constraint for reactive power:
≤ ≤ (8)
Constraint for power factor:
V. RESULT AND DISCUSSION
MATLAB 2017a is the platform usedto analyse the algorithm.The program has been writtento executethe load flow, which in turn calculate the losses before and after the placement of D-STATCOM. Its performanceis tested on 33 bus RDS which is discussed below:
Fig. 2. RDS with 33 buses.
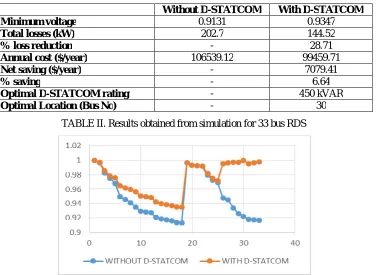
Fig. 2 shows the RDS with 33 buses and the data of the system are extracted from [12]. The system has a total of 3.715 MW and 2.3 MVAr active and reactive power load respectively. After performing load flow with polar index method, it is found that 21 buses were having under voltage problem andchosen as candidate buses. Now FPA decides the best location among the input candidate buses and also deduces theoptimal size of D-STATCOM.The output suggests to install the D-STATCOM of 450 kVAR at bus no 30 for compensation purpose.
Without D-STATCOM With D-STATCOM
Minimum voltage 0.9131 0.9347
Total losses (kW) 202.7 144.52
% loss reduction - 28.71
Annual cost ($/year) 106539.12 99459.71
Net saving ($/year) - 7079.41
% saving - 6.64
Optimal D-STATCOM rating - 450 kVAR
Optimal Location (Bus No) - 30
After allocating the D-STATCOM at bus no 30, the voltage at that bus is boosted to 1 p.u. and the system total loss is reduced to 144.52 kW which was 202.7 kW without D-STATCOM. 28.71% is the % reduction in losses. The minimum voltage was 0.9131 p.u. for the base case. After the installation of D-STATCOM, the minimum voltage is found to be 0.9347 p.u. Fig. 3 shows the voltages at each bus of 33 bus with and without D-STATCOM. The annual cost incurred without is D-STATCOM is 106539.12$ which is reduced to 99459.71$ after installing it.
VI.CONCLUSION
In this paper, PLI with FPAis used to optimally locate and size the D-STATCOM in IEEE-33 bus RDS. The cost minimization is taken as an objective function. The simulation results yields that the power losses are reduced and voltage profiles are improved with reduction in annual cost. Hence it can be concluded that the process can be implemented on any RDS with n number of buses to obtain the accurate results while finding the optimal solution.
REFERENCES
[1] Attia A. EI-Fergany.: Optimal capacitor allocations using evolutionary algorithms. IET Gener.Transm. Distrib. Feb (2013) 593-601. [2] Acha E, Agelidis VG, Anaya-Lara O, Miller TJE. Power electronic control in electrical systems, Newnes; 2002.
[3] Z. Yang, C Shen, M. L. Crow and L. Zhang, “An Improved STATCOM Model for Power Flow Analysis,” Power Engineering Society Summer Meeting, Vol. 2, Seattle, 16-20 July 2000, pp. 1121-1126.
[4] Sensarma PS, Padiyar KR, Ramanarayanan V. Analysis and performance evaluation of a distribution STATCOM for compensating voltage fluctuations. IEEE Trans Power Del 2001; 16 (2):259–64.
[5] Wasiak I, Mienski R, Pawelek R, Gburczyk P. Application of DSTATCOM compensators for mitigation of power quality disturbances in low voltage grid with distributed generation. In: 9th International conference on electrical power quality and utilizations; 2007.
[6] Devabalaji KR, Ravi K, Kothari DP. Optimal location and sizing of capacitor placement in radial distribution system using bacterial foraging optimization algorithm. Int J Electric Energy Syst 2015; 71:383–90.
[7] S. Jazebi, S.H. Hosseinian, B. Vahidi. DSTATCOM allocation in distribution networks considering reconfiguration using differential evolution algorithm, Energy Conversion and Management 52 (2011) 2777–2783.
[8] Seyed Abbas Taher, SeyedAhmadrezaAfsari. Optimal location and sizing of DSTATCOM in distribution systems by immune algorithm, Electrical Power and Energy Systems 60 (2014) 34–44.
[9] S. Devi, M. Geethanjali. Optimal location and sizing determination of Distributed Generation and DSTATCOM using Particle Swarm Optimization algorithm, Electrical Power and Energy Systems 62 (2014) 562–570.
[10] A.A. El-Fergany, A.Y. Abdelaziz, Capacitor allocations in radial distribution networks using cuckoo search algorithm, IET Generation Transm. Distrib. 8 (2) (2014) 223–232.
[11] X.S. Yang, M. Karamanoglu, X. He, Multi-objective flower algorithm for optimization, Procedia Comput. Sci. 18 (2013) 61–68.