Scholarship@Western
Scholarship@Western
Electronic Thesis and Dissertation Repository
4-23-2014 12:00 AM
Targeted Proteomics of Human Pluripotent Stem Cells
Targeted Proteomics of Human Pluripotent Stem Cells
Kevin Gregory KaniaThe University of Western Ontario
Supervisor Gilles Lajoie
The University of Western Ontario Joint Supervisor Lynne Postovit
The University of Western Ontario Graduate Program in Biochemistry
A thesis submitted in partial fulfillment of the requirements for the degree in Master of Science © Kevin Gregory Kania 2014
Follow this and additional works at: https://ir.lib.uwo.ca/etd
Part of the Biochemistry Commons
Recommended Citation Recommended Citation
Kania, Kevin Gregory, "Targeted Proteomics of Human Pluripotent Stem Cells" (2014). Electronic Thesis and Dissertation Repository. 1990.
https://ir.lib.uwo.ca/etd/1990
This Dissertation/Thesis is brought to you for free and open access by Scholarship@Western. It has been accepted for inclusion in Electronic Thesis and Dissertation Repository by an authorized administrator of
(Thesis format: Monograph)
by
Kevin Gregory Kania
Graduate Program in Biochemistry
A thesis submitted in partial fulfillment of the requirements for the degree of
Master of Science
The School of Graduate and Postdoctoral Studies The University of Western Ontario
London, Ontario, Canada
ii
Abstract
Human pluripotent stem cells (hPSCs) exhibit two unique characteristics: pluripotency and
self-renewal. These properties are maintained by a series of complex signaling pathways,
however, quantitative data for the respective proteins is lacking. Selected reaction monitoring
(SRM) is a targeted, quantitative technique in mass spectrometry that is highly sensitive in
peptide detection. In this thesis, an SRM protocol was developed in order to detect and
quantify a defined set of proteins responsible for maintaining stem cell pluripotency. Two
hESC differentiation protocols were validated for use as model systems within which to
measure differential protein expression by SRM. SRM assays were generated for thirty-three
proteins and tested on cell lysates. Wnt1 and β-catenin were shown to be upregulated during
differentiation, while other proteins and peptides were detected but not quantifiable. The
results of this study highlight the complexity of hPSC proteome and help further the
understanding of the mechanisms responsible for pluripotency.
Keywords
proteomics, human embryonic stem cells, selected reaction monitoring, mass spectrometry,
iii
Acknowledgments
Thanks to Dr. Lynne Postovit and Dr. Gilles Lajoie for giving me the opportunity to work in
this lab. Your guidance and support have been invaluable.
Thanks to Paula Pittock for advice and aid in mass spectrometry and HPLC.
Thanks to Courtney Brooks for maintaining a steady stem cell culture.
Thanks to Dr. Cheryle Seguin for the support and the stem cells.
Thanks to Gabrielle Siegers and Kristin Chadwick for help in flow cytometry analysis.
Thanks to Michael, Scott, Krista, Alia, Guihua, Padmalaya, Jonathan, Dylan, and Miljan for
iv
Table of Contents
Abstract ... ii
Acknowledgments... iii
Table of Contents ... iv
List of Tables ... vii
List of Figures ... viii
List of Appendices ... xi
List of Abbreviations ... xii
1 Introduction ... 1
1.1 Human Pluripotent Stem Cells... 1
1.1.1 Human Embryonic Stem Cells... 1
1.1.2 Stem Cell Signaling/Important Pathways ... 2
1.1.3 Induced Pluripotent Stem Cells ... 7
1.1.4 Variation among cell lines ... 8
1.2 Mass Spectrometry... 9
1.2.1 Selected Reaction Monitoring... 10
1.2.2 Parallel Reaction Monitoring ... 17
1.2.3 Quantitative Proteomics ... 17
1.3 Proteomics and Stem Cells ... 20
1.4 Thesis Objectives and Rationale ... 22
2 Methods ... 24
2.1 SRM Assay Development ... 24
2.2 Peptide Synthesis ... 24
2.3 Cell Culture ... 25
v
2.6 Flow Cytometry ... 29
2.7 Immunofluorescence ... 29
2.8 Localization of SOX17 ... 30
2.9 RT-PCR... 30
2.10Dimethyl Labeling ... 33
2.11Gel Electrophoresis ... 33
2.12In-gel Tryptic Digestion ... 33
2.13In-Solution Tryptic Digestion ... 34
2.14Mass Spectrometry... 35
2.15MS Data Analysis ... 35
3 Results ... 38
3.1 Cell Line Differentiation and Characterization ... 38
3.1.1 Immunofluorescence ... 42
3.1.2 Confocal Microscopy of Sox17/ERT2 Translocation... 44
3.1.3 Real-Time RT-PCR Analysis of hESC Differentiation ... 46
3.1.4 Flow Cytometry Analysis of Differentiated hESC Populations ... 48
3.2 SRM Assay Development ... 52
3.3 Dimethyl Label Incorporation... 91
3.4 Quantitation and Scheduled Method ... 93
3.5 Single Protein Digests ... 100
3.6 Fractionation Experiments ... 102
4 Discussion ... 107
4.1 Cell Line Differentiation and Characterization ... 107
4.1.1 Immunofluorescence ... 108
vi
4.2 SRM Assay Development ... 110
4.3 Detection in Cell Lysates ... 112
4.4 Wnt Signaling Pathway Upregulated in BMP4 Induced Differentiation... 112
4.5 Detection and Sensitivity Issues ... 113
4.6 Sample Preparation ... 116
4.7 Future Experiments ... 118
4.8 Conclusion ... 119
5 References ... 120
Appendices ... 131
vii
List of Tables
Table 1. List of Real-Time RT-PCR Primers. ... 32
Table 2. List of target proteins and peptides. ... 53
Table 3.Target Peptides Detected via SRM in Unlabeled Cell CA1K Lysates. ... 89
viii
List of Figures
Figure 1. Stem cell signaling pathways.. ... 4
Figure 2. Schematic of SRM. ... 12
Figure 3. Potential fragment ions generated from peptide fragmentation. ... 14
Figure 4. Dimethyl labeling of peptides.. ... 19
Figure 5. Bradford Assay setup.. ... 28
Figure 6. Equations for statistical analysis of SRM transitions .. ... 37
Figure 7. hESC differentiation models. ... 39
Figure 8. Changes in hESC morphology after exposure to differentiation factors. ... 41
Figure 9. Immunofluorescence of Differentiated Cells.. ... 43
Figure 10. Confocal Microscopy of Sox17 Nuclear Localization. ... 45
Figure 11. Real-Time RT-PCR Data for Cell Differentiation. ... 47
Figure 12. Flow cytometry of H9 Differentiation. ... 50
Figure 13. Flow cytometry of CA1K Differentiation.. ... 51
Figure 14. SRM and MS/MS data for protein Dishevelled. ... 55
Figure 15. SRM and MS/MS data for protein Nanog. ... 56
Figure 16. SRM and MS/MS data for protein WIF1. ... 57
Figure 17. SRM and MS/MS data for protein Activin A. ... 58
Figure 18. SRM and MS/MS data for protein Frizzled1. ... 59
ix
Figure 21. SRM and MS/MS data for protein Patched. ... 62
Figure 22. SRM and MS/MS data for protein SFRP2. ... 63
Figure 23. SRM and MS/MS data for protein Wnt5a. ... 64
Figure 24. SRM and MS/MS data for protein Sonic hedgehog. ... 65
Figure 25. SRM and MS/MS data for protein HES1. ... 66
Figure 26. SRM and MS/MS data for protein GSK3β. ... 67
Figure 27. SRM and MS/MS data for protein Smoothened... 68
Figure 28. SRM and MS/MS data for protein SUFU. ... 69
Figure 29. SRM and MS/MS data for protein Cerberus. ... 70
Figure 30. SRM and MS/MS data for protein p53... 71
Figure 31. SRM and MS/MS data for protein Wnt2. ... 72
Figure 32. SRM and MS/MS data for protein Gli3. ... 73
Figure 33. SRM and MS/MS data for protein FRAT1. ... 74
Figure 34. SRM and MS/MS data for protein Cripto-1. ... 75
Figure 35. SRM and MS/MS data for protein Lefty1. ... 76
Figure 36. SRM and MS/MS data for protein DKK1. ... 77
Figure 37. SRM and MS/MS data for protein SFRP1. ... 78
Figure 38. SRM and MS/MS data for protein Nodal. ... 79
x
Figure 41. SRM and MS/MS data for protein Wnt1. ... 82
Figure 42. SRM and MS/MS data for protein CDKI1. ... 83
Figure 43. SRM and MS/MS data for protein Wnt3A. ... 84
Figure 44. SRM and MS/MS data for protein APC. ... 85
Figure 45. SRM and MS/MS data for protein Hey1. ... 86
Figure 46. SRM and MS/MS data for protein Notch1. ... 87
Figure 47. Target peptides were detected in tryptic digests of undifferentiated CA1K cell lysate. ... 90
Figure 48. Efficiency of dimethyl labeling of peptides.. ... 92
Figure 49. Optimization of scheduled SRM method settings. ... 94
Figure 50. Scheduled SRM data for dimethyl labeled H9 lysate. ... 97
Figure 51. Protein fold change for H9 BMP4-driven differentiation. ... 98
Figure 52. Sequence coverage for Nodal digest. ... 101
Figure 53. 1D SDS-PAGE fractionation schemes. ... 103
Figure 54. Sample SDS-PAGE Gel. ... 104
Figure 55. SRM chromatograms for peptide targets detected after SDS-PAGE fractionation. ... 105
xi
List of Appendices
Appendix A: List of SRM transitions. ... 131
Appendix B: Peak areas for transitions detected in scheduled SRM analysis of dimethyl
xii
List of Abbreviations
4-OHT – 4-hydroxytamoxifen
ACN – acetonitrile
AQUA – absolute quantification
bFGF – basic fibroblast growth factor
B-ME – β-mercaptoethanol
BMP4 – bone morphogenic protein 4
BSA – bovine serum albumin
CA1K – CA1 Sox17/ERT2 Puro Clone K cells
CE – collision energy
CID – collision induced dissociation
CM – conditioned media
DAPI - 4',6-diamidino-2-phenylindole
DCM – dichloromethane
DDA – data-dependent acquisition
DKK1 – Dickkopf-related protein 1
DMEM – Dulbecco’s Modified Eagle’s Medium
DMSO – dimethyl sulfoxide
DP – declustering potential
xiii
EDTA – ethylenediaminetetraacetic acid
ERT2 – human estrogen receptor ESI – Electrospray Ionization
FACS – fluorescence activated cell sorting
FBS – fetal bovine serum
GAA – glacial acetic acid
hESC – human embryonic stem cell
HPLC – high performance liquid chromatography
hPSC – human pluripotent stem cell
IAA – iodoacetamide
iPSC – induced pluripotent stem cell
IRES – internal ribosome entry site
iTRAQ – isobaric tag for relative and absolute quantitation
MALDI – matrix-assisted laser desorption/ionization
MEF – mouse embryonic fibroblast
mESC – mouse embryonic stem cell
MRM – multiple reaction monitoring
MS – mass spectrometry
xiv
Q1 – quadrupole 1
Q3 – quadrupole 3
RT – retention time
S/N – signal-to-noise
SCX – strong cation exchange
SD – standard deviation
SDS-PAGE – sodium dodecyl sulfate – polyacrylamide gel electrophoresis
SHH – Sonic hedgehog
SRM – selected reaction monitoring
SSEA1 - stage-specific embryonic antigen 1
SSEA3 - stage-specific embryonic antigen 3
1
Introduction
1.1 Human Pluripotent Stem Cells
Human pluripotent stem cells (hPSCs), which include human embryonic stem cells
(hESCs) and induced pluripotent stem cells (iPSCs) possess two unique characteristics.
They are pluripotent, that is, capable of differentiating into any of the three primary germ
layers of mesoderm, endoderm, and ectoderm. Secondly, they are capable of
self-renewal, meaning that they can proliferate indefinitely in culture while maintaining their
pluripotency, provided the proper conditions are maintained.1 Because of these properties, hPSCs are highly valued as a research tool for modeling in vitro
differentiation and early human development, as well as showing great promise for use in
regenerative medicine. In addition, hPSCs could be used as a model system for disease
and search for treatments. However, the mechanisms responsible for stem cell
pluripotency and self-renewal are still poorly understood, particularly at the protein level.
1.1.1
Human Embryonic Stem Cells
hESCs were first derived by Thomson et al. in 1998 from donated embryos generated
from in vitro fertilization2. The inner cell mass of the pre-implantation blastocyst was extracted and plated on a feeder layer of γ-irradiated mouse embryonic fibroblasts
(MEFs), which release cytokines and growth factors that promote pluripotency, and
allowed to expand. The derived cells exhibited characteristics such as a high nucleus to
cytoplasm ratio, high telomerase activity, and cell surface markers characteristic of
undifferentiated nonhuman ESCs.3 In addition, the colonies generated were not clonal expansions from a single cell, and were therefore heterogeneous while appearing
uniform. Upon injection into severe combined immunodeficient (SCID) mice, hESCs
generated teratomas, exhibiting the ability to generate mesoderm, endoderm and
ectoderm. Since 1998, according to Fraga et al., more than 1200 hESC lines have been
derived worldwide.4
hESCs differ from mouse embryonic stem cells (mESCs) in several different
doubling rate of 16 hours, hESCs colonies exhibit a flattened two-dimensional structure
and a doubling time of about 36 hours.6 In addition, while leukemia inhibitory factor (LIF) and bone morphogenic protein 4 (BMP4) are required to maintain mESC
pluripotency, they are not sufficient to maintain hESC pluripotency, and BMP4, in fact,
directs hESCs towards differentiation. 7 Surface marker SSEA1, which signifies pluripotency in mESCs, instead marks differentiation in hESCs. hESC cultures are
technically difficult to maintain, and prone to spontaneous differentiation. hESCs exhibit
poor survival upon dissociation, and cannot be expanded from the single cell state in the
absence of Rho-associated kinase (ROCK) inhibitor, and as such, must be passaged in
small clumps.8 Basic fibroblast growth factor (bFGF) has been identified as a required factor in stem cell growth media. 9, 10 Typically, hESC culture media consists of a basal media such as DMEM, a protein source (KnockOut Serum Replacement) and
self-renewal factors such as the aforementioned bFGF.
Due to the eventual push towards clinical use, there is a trend towards the use of hESC
culture in defined and xeno-free conditions.11 hESCs are frequently maintained in feeder-free conditions, in which instead of being plated on a MEF feeder layer, hESCs are plated
on an alternate matrix. These matrices include products such as Matrigel® (BD) and
Geltrex™ (Life Technologies), which are basement membranes derived from mouse
Engelbreth-Holm-Swarm tumors. Consisting primarily of laminin, collagen IV and
enactin, these basement membranes simulate the extracellular environment required to
support these cells in tissues12. However, hPSC growth on these matrices require the use of either a defined medium such as mTeSR™, or hESC media conditioned on a MEF feeder layer in order to supply the growth factors required to maintain pluripotency.
mTESR™ has been shown to maintain pluripotency in multiple hESC lines, including expression of factors such as Oct4, SSEA3, and SSEA4.13
1.1.2
Stem Cell Signaling/Important Pathways
Sox2, Oct4 and Nanog are transcription factors that are part of the core machinery of
presence of BMP4 can direct differentiation towards mesoderm or endoderm17. Nanog has been shown to repress endoderm differentiation. All three factors have been shown to
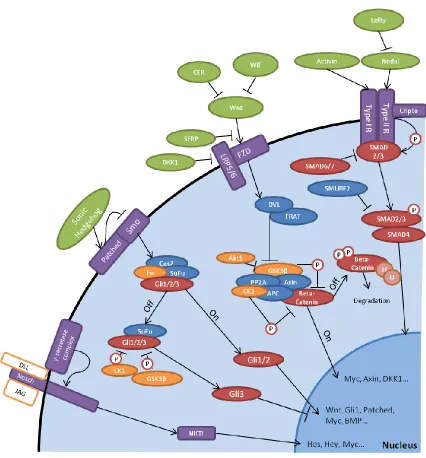
Figure 1. Stem cell signaling pathways. Notch, Hedgehog, Wnt, and Activin/Nodal
signaling pathways are among those that play a role in maintaining pluripotency and stem
cell fate. Transcriptional targets and crosstalk between proteins connect these pathways in
In addition to the core machinery of transcription factors, the canonical Wnt,
Nodal/Activin, Hedgehog, and Notch signaling pathways all play a role in maintaining
the balance of stem cell pluripotency, with cross-talk between pathways further
complicating characterization.19
The Wnt signaling pathway includes such proteins as Wnt1, Wnt2, Wnt3A, Wnt5A,
Cerberus, WIF1, Frizzled, DKK1, Axin1, β-Catenin, APC, GSK3β, DVL1, Akt1, SFRP1,
SFRP2 and FRAT1. Wnts are secreted developmental proteins that bind to Frizzled
transmembrane receptors.20 They are highly conserved across species and involved in embryogenesis patterning. When canonical Wnt signaling is inactive, the β-catenin
destruction complex forms, resulting in the phosphorylation, ubiquitination and
degradation of β-catenin. In the presence of Wnt signaling, the β-catenin destruction
complex is disrupted, and β-catenin levels are allowed to accumulate. β-catenin
translocates to the nucleus and acts as a co-activator for TCF/LEF transcription factors,
activating the transcription of Wnt responsive genes such as Myc and DKK1.
The β-catenin destruction complex is made up of GSK3β, APC, Axin-1, PP2A, and CK1.
GSK3β is a serine threonine protein kinase that is constitutively active. APC is a large
tumor suppressor protein that is part of the β-catenin destruction complex. It also plays a
role in cell migration, adhesion, transcriptional activation and apoptosis. SFRP1, SFRP2,
and WIF-1 are Wnt inhibitors, previously identified to be secreted by hESCs.21 DVL1 and FRAT-1 are positive regulators of Wnt signaling that inhibit GSK3B phosphorylation
of β-catenin. Akt1 is a serine-threonine protein kinase that suppresses apoptosis by
phosphorylation. It inhibits GSK3B to increase cell proliferation.
P53 is a tumor suppressor protein that plays many roles within cells, including acting as a
cell cycle regulator and a role in cell division, differentiation or apoptosis.22, 23 It can promote differentiation by suppressing Nanog.24 CDKI1 aka p21 is a cyclin dependent kinase inhibitor controlled by P53 involved in regulation of the cell cycle at G1.
NOTCH signaling plays a key role in cell fate, affecting implementation of
domain of the protein translocates to the nucleus and promotes transcription of
downstream factors. Hes1 and Hey1 are transcription factors downstream of Notch
signaling. Hes1 plays a role in cell proliferation and differentiation.26 Hey1 plays a role in neuronal and cardiac differentiation.
Activin/Nodal signaling has been shown to be vital for maintenance of pluripotency. 27 Activin/Nodal signaling is required to maintain Nanog expression.28 Nodal is a secreted protein that is responsible for formation of mesoderm and axial structures in the early
embryo. It is not expressed in adult cells, except in certain cancers.29 Lefty-1 is a member of the TGFβ family; it acts as an inhibitor of Nodal. Activin-A is a secreted homodimer
that plays a role in cell fate and embryogenesis patterning. TDGF/Cripto-1 is a
co-receptor for Nodal, also required for self-renewal and pluripotency.30, 31 Cerberus is a secreted protein that acts as an inhibitor of the Wnt and Nodal pathways.32
Sonic hedgehog (SHH) signaling is involved in cell proliferation and early embryo
patterning, and plays a role in hPSC differentiation.33 Patched is a receptor for Sonic hedgehog that associates with and suppresses the activity of the protein Smoothened.
Smoothened is a G-protein coupled receptor in tandem with Patched. SHH binding with
Patched stops inhibition of Smoothened. GLI3 is a transcription factor that activates
Patched expression during embryogenesis. It acts as both an activator and repressor of the
Hedgehog signaling pathway. SUFU functions in concert with Sox2 and Oct4 in the
Hedgehog pathway. It serves as a negative regulator of Sonic Hedgehog and β-catenin,
and sequesters GLI3.
Though these signaling pathways have been summarized, quantitative data at the protein
level is lacking. The crosstalk and effect of each pathway is largely affected by protein
expression levels, and many of these proteins are present at low abundance, resulting in
difficult detection by methods such as mass spectrometry. Nodal, Cripto and Lefty have
been shown to be highly expressed components of TGFβ signaling that support the
signaling pathway36. Upon activation and dimerization through Nodal or Activin signaling, Smad2/3 has been shown to maintain the pluripotent state by regulation of
Nanog expression, but its activity can be affected by the crosstalk between PI3K/Akt,
Raf/Mek/Erk, Wnt and GSK3B signaling.36 In the absence of PI3K/Akt signaling, Wnt signaling is no longer suppressed and β-catenin can direct Smad2/3 to activate genes
promoting differentiation, such as the mesendoderm marker MixL1. β-Catenin and Wnt
signaling has been shown to be both antagonistic and key to maintenance of pluripotency,
whereby large amounts of Wnt signaling results in high β-catenin expression promoting
differentiation, though a basal level of β-catenin is necessary to sustain pluripotency.37
1.1.3
Induced Pluripotent Stem Cells
While hESCs proved to be a valuable tool, the requirement of human embryos in order to
generate new cell lines has led to ethical questions and practical concerns that place limits
on embryonic stem cell research. In 2006, the Yamanaka group identified four factors
that enabled the reprogramming of fully differentiated somatic cells into the pluripotent
state.38 By introducing the factors Sox2, Klf4, Oct4 and c-Myc via retroviral transduction, MEFs began to exhibit stem-cell like morphology and markers. In addition, injection into
nude mice resulted in generation of tissues. These derived cells were named induced
pluripotent stem cells (iPSCs). One year later, the first human iPSCs were generated
using the same four factors, dubbed the “Yamanaka Factors”.39 For this research, Shinya Yamanaka was jointly awarded the 2012 Nobel Prize for Physiology or Medicine with
John Gurdon for discovering that mature cells can be reprogrammed to pluripotency.
Concurrently, the Thomson group also developed a method to generate iPSC lines using
Oct4, Sox2, Nanog and Lin28 as their reprogramming factors.40 In addition to avoiding the need for destruction of human embryos to obtain new pluripotent cell lines, iPSCs
present other research opportunities. The possibility of generating patient or disease
specific cell lines could lead to more clinical relevance, and generating more genetically
1.1.4
Variation among cell lines
Due to the variation inherent in the process of hPSC derivation and the overall
inefficiency in iPSC reprogramming, it is important that cell lines be well
characterized.43, 44 Many studies have looked at characterization of cell lines, at
transcriptional, epigenetic and proteomic levels. Bock et al. characterized 20 hESC and
12 IPSC lines by DNA methylation and gene expression, finding that variation between
cell lines can affect differentiation potential45. By characterizing gene expression or methylation sites that deviated from the reference distribution, the group was able to
develop a score card predicting a cell line’s ability to differentiate into particular lineages.
Similarly, a test set of iPSCs derived from different individuals was found to have
differing capacities for neural differentiation46. Another study found that iPSCs and hESCs expressed highly similar proteomes, but some metabolic, antigen processing, and
cell adhesion proteins were found to be differentially expressed.47
Before any therapeutic use for hPSCs is developed, we must better understand the
microenvironment surrounding them, as well as their individual properties and capacity
for differentiation. Though hPSCs are pluripotent and able to differentiate into any cell in
the body, harnessing that ability requires a profound understanding of the signaling
pathways at play. For instance, treatment of hPSCs with BMP4 will lead to
differentiation; however, time of exposure affects the type of differentiation that will
occur. Short-term exposure to BMP4 promotes mesoderm progenitor development, but
this also requires FGF and Nodal/Activin signaling.48 If that BMP4 signal is not inhibited, a feedback loop forms instead promoting the formation of trophoblast and
extraembryonic endoderm.49-51 In contrast, Seguin et al. have developed a CA1 cell line expressing a Sox17/ERT2 transgene that, when induced with tamoxifen, will promote
differentiation towards a stable definitive endoderm precursor state that maintains
expression of pluripotency markers Oct4 and Nanog.52, 53 Differentiation protocols such as these would be aided by a tool that could elucidate subtle changes in protein
1.2
Mass Spectrometry
Mass spectrometry (MS) is a method of determining quantity, structure and composition
of compounds by measuring the mass-to-charge ratio (m/z) of ions. Mass spectrometers
consist of three main parts: an ionization source, a mass analyzer, and a detector. The
ionization source ionizes the analyte. Two “soft” methods of ionization are commonly
used in proteomic analysis, matrix-assisted laser desorption/ionisation (MALDI) and
electrospray ionization (ESI). MALDI involves sample spotted on a plate and crystallized
in a matrix, and ionized using a laser. Typically, this results in singly charged ions with a
mass of [M+H]. Proteins can be identified by a technique known as Peptide Mass
Fingerprinting (PMF), in which peptides generated from an enzymatic, typically trypsin,
digest are detected and compared to a database. In the case of ESI, the analyte is sprayed
out of an electrically charged tip in droplets, which are desolvated and sent into the mass
analyzer. Compared to MALDI, ESI typically results in multiply charged ions, usually
doubly or triply charged in the case of peptides. One particular benefit of ESI is that it
can be easily integrated (i.e. on-line) with High Performance Liquid Chromatography
(HPLC), allowing for chromatographic separation and more effective analysis of protein
samples, as well as easier automation of protocols. The mass analyzer separates ions
according to their m/z ratio, and the abundance of ions is measured by the detector. There
are many types of mass analyzers, including Time-Of-Flight (TOF), Quadrupole (Q), Ion
Trap (IT), and Orbitrap. Multiple mass analyzers can be combined to form a hybrid
instrument that allows for tandem mass spectrometry (MS/MS). MS/MS allows for
sequence data to be obtained from peptides by introducing a fragmentation step between
multiple levels of MS scans. The fragmentation produces m/z peaks in the MS/MS scan
that correspond to the difference in amino acid residues, from which the peptide sequence
can be obtained. The data obtained is commonly analyzed using bioinformatics software,
including search databases such as MASCOT and OMSSA, which use predictive
algorithms to match MS data against a protein database in order to identify proteins in the
sample.54, 55 PEAKS is a de novo sequencing and database searching suite, with the unique feature of being able to combine searches from different tools.56 It relies heavily on mass accuracy, resolution, and spectral quality. The Trans-Proteomic Pipeline
vendor specific files to the open mzXML or mzML format, as well as validation,
identification and quantification analysis of the data set.57, 58 Despite the power of LC – MS/MS, it has several shortcomings. Sequencing speed limits the amount of peptides that
can be identified in each run, and sample complexity may cause abundant peptides to
mask detection of less abundant peptides.
1.2.1
Selected Reaction Monitoring
Selected reaction monitoring (SRM) is a targeted, quantitative technique used in mass
spectrometry, possible only on triple quadrupole mass spectrometers, such as the 4000
QTRAP® (AB SCIEX, Framingham, MA).59 Also known as multiple reaction monitoring (MRM), SRM has been used in drug identification and analysis of
metabolites, and is increasingly being used in proteomics. 60, 61 It involves the use of peptide precursor and fragment ion pairs known as “transitions” to identify peptides and
thus proteins. By monitoring multiple transitions per peptide and multiple peptides per
protein, SRM can serve to identify proteins with a great deal of specificity and selectivity.
Indeed, the technique is able to obtain quantitative data over a range of five levels of
magnitude, with a limit of detection between 10-50 attomoles under optimal conditions,
as opposed to low femtomole levels for other instruments.61, 62 A schematic of the mechanism of SRM can be seen in Figure 2. The first quadrupole is set to filter for the
precursor peptide ion at a defined m/z, while the second quadrupole serves as a collision
cell where collision induced dissociation (CID) occurs. The third quadrupole is set to
filter for the fragment ion generated at a defined m/z. The chromatograph of each
transition, including retention time and signal intensity is recorded. At its simplest, SRM
can be considered a double filter method, capable of focusing on the analyte of interest,
cutting through a more complex sample.63 It differs from other mass spectrometry techniques in that it is a targeted rather than a scanning technique. Whereas other MS
techniques perform survey scans, selecting the top N most abundant ions for MS/MS,
SRM detects solely the ions corresponding to the list of transitions input into the method.
No full MS spectrum is taken. As a result, it scans for only the targets listed, and is
proteins are monitored. Post-translational modifications that may change the m/z ratio of
Figure 2. Schematic of SRM. A tryptic digest of protein sample is loaded and subjected
to reverse-phase chromatography on a coupled HPLC system and ionized via
electrospray ionization. The instrument scans for and detects peptide transitions based on
a preloaded list of transitions. Precursor masses are selected in Q1, collision-induced
dissociation occurs in Q2, while Q3 selects for the fragment mass. Intensity and retention
A proper SRM assay relies heavily upon reproducible chromatography. Numerous factors
can affect the quality of chromatography, including changes in mobile phase, flow
restriction, and the column temperature. Well-defined chromatographic peaks require a
minimum of eight data points collected over the elution time. Effectiveness of an SRM
assay therefore relies heavily upon the optimization of several factors. The dwell time
refers to the time the instrument spends scanning for the individual transition, and as
such, a higher dwell time correlates with a higher sensitivity. The cycle time refers to the
time spent cycling through the entire list of transitions. If a given peptide has a
chromatographic peak width of thirty seconds, in order to properly detect that peak, cycle
time is limited to about 3.75 seconds in order to gather enough data points for a
quantifiable peak. Thus, the maximum number of transitions that can be scanned at any
given time are limited by both the cycle time and the dwell time.65 Rather than cycle through the preset list of transitions throughout the entire sample run, a scheduled method
may also be used. In a scheduled SRM method, each transition is associated with a
predicted LC elution time, and as such is only scanned for in a pre-specified window
around that time point. By doing this, transitions being scanned for concurrently are
decreased, dwell time and thus sensitivity can increase, and more total transitions can be
included in a single method, making more efficient use of instrument time. However,
total number of transitions is also limited by the instrument itself. For the 4000 QTRAP®, a maximum of 1000 transitions can be included within a single scheduled method.
Retention times can be predicted using software, or preferentially acquired manually
Figure 3. Potential fragment ions generated from peptide fragmentation. a,b,c ions
refer to N-terminal fragments, while x,y,z refer to C-terminal fragments. In Collision
When selecting peptide targets for SRM assays, several key criteria are necessary.60 Most importantly, peptides should be “proteotypic,” that is, both specific to the protein
target and confidently and consistently identified by mass spectrometry. These peptides
should reproducibly be obtained from the protease digest. Peptides should be kept to a
residue length of between eight and twenty-five amino acids, and residues prone to
oxidation such as methionine and tryptophan should be avoided. Doubly-charged
precursors are preferred, unless there is a histidine present in the peptide sequence,
making a triply-charged precursor more likely. CID usually results in peptides
fragmenting at the peptide bond, generating y and b ions, as seen in Figure3. Online
repositories such as the Global Proteome Machine Database (GPMDB) and SRMAtlas
contain libraries of both experimentally-derived and predicted transitions for peptides,
serving as a helpful resource.67, 68 However, due to the variation between instruments, it is best to select SRM targets based on own empirical data. In addition, many peptide
fragmentation spectra deposited are for ion-trap instruments, which may differ from triple
quadrupole fragmentation. Pure in silico predictions for protein and peptide targets may
not be appropriate for SRM assays, as the given protein or peptide may not properly
solubilize, ionize, or even be present after a tryptic digestion. Stergachis et al. developed
a method where optimal proteotypic peptides are discovered through digestion of
full-length proteins generated in vitro by cDNA clones69. This method could prove beneficial for generating assays for proteins present at low abundance that have not been observed
via shotgun proteomics.
There are a variety of online tools that can be used in developing SRM assays, as
reviewed by Cham et al.70 Skyline is a publicly available program developed by the MacCoss lab of the University of Washington capable of generating, visualizing, and
optimizing SRM protocols.71 Transitions can be selected from spectral libraries obtained from sources such as Peptide Atlas, the Global Proteome Machine (GPM), and the
National Institute of Standards and Technology (NIST), or from MS/MS data generated
from the protein of interest. Methods can be refined by importing previously acquired
SRM data and optimizing for collision energy. Collision energy optimization has been
areas can also be exported for downstream analysis. Though SRM is limited to detecting
the pre-selected transitions rather than discovering novel results and requires extensive
optimization, it remains a powerful tool in hypothesis-driven research.
Because of the targeted nature of SRM and being a method of protein detection and
quantification that does not require antibodies, proteomic studies using SRM are
becoming more commonplace, in particular within yeast cells, mammalian cells, and
human body fluids.73 In 2009, Picotti et al. were able to characterize the full dynamic range of the proteome of S. cerevisiae using SRM, to the point of detecting proteins as
low as 50 copies per cell.74 Within an unfractionated yeast digest they were able to characterize a range of proteins covering 4.5 orders of magnitude. In addition, they were
able to detect proteins that were previously unobserved in other proteomics experiments.
In 2010, SRM was used by Murphy et al. to identify glycolytic proteins in cancer cells.75 In 2010, Lopez et al. used SRM to verify putative protein biomarkers for Trisomy 21 in
serum.76 Lange et al. identified a set of virulence factors from Streptococcus pyogenes
via SRM.77
Chen et al. used SRM to screen for members of the Wnt/β-Catenin pathway in colon
tissue samples and colon cancer cell lines, as the pathway is disregulated in this cancer.78 Compared to results from Western blotting, differences in protein expression were easier
to discern using SRM, with certain proteins, such as β-catenin, being capable of being
detected in as few as 100 cells.
Apart from detection, SRM can also be used as a quantification tool. In order to estimate
protein abundance in the microbe Leptospira interrogans, SRM was used.79 Under what is known as the “best flyer” hypothesis, the most intense tryptic peptides for a protein
should be constant throughout a whole proteome. As such, anchor point proteins were
identified to generate a calibration curve. In an unfractionated, unlabeled sample, protein
abundance changes were found for 39 proteins upon treatment with antibiotics. Bisson et
al. combined SRM with affinity purification in order to characterize the signaling
GRB2-associated proteins were detected by SRM. These SRM assays were later used to identify
which proteins preferentially bound GRB2 SH2 or SH3 domains under various stimuli,
thus greatly increasing the knowledge of the signaling dynamics surrounding the GRB2
adaptor. An SRM-based study was also performed quantifying the temporal
phosphorylation profiles of the EGFR signaling network, taking advantage of SRM’s
reproducibility.81 Due to its sensitivity and selectivity, SRM can be used in a wide variety of studies, and it would be particularly useful in characterizing a targeted list of signaling
proteins within a complex background, such as a cell lysate.
1.2.2
Parallel Reaction Monitoring
An technique analogous to SRM known as parallel reaction monitoring (PRM), or
targeted MS/MS, has recently been described for the high-resolution/high mass accuracy
instrument the Q Exactive™ (Thermo). In place of the third quadrupole, an orbitrap mass
analyzer is used.82 Similar to SRM, pre-input targets are listed in the method, however, the orbitrap is capable of detecting all MS/MS fragments at once, thus eliminating the
time consuming step of transition optimization. The Domon group was able to detect and
quantify 770 yeast peptides in a single 60-minute experiment using this technique. 83 Using a synthetic peptide cocktail, the Coon group has shown that PRM provides
comparable or, at times, better than SRM.84 Though SRM is theoretically more sensitive than PRM due to a faster scan speed, the ability of PRM to obtain high-resolution data
eliminates the chance of interfering ions confounding target detection.85
1.2.3
Quantitative Proteomics
The ultimate goal of SRM is quantitation. Although label-free quantification methods are
widely used, reproducibility can be a concern, and without some sort of reference,
comparison across sample acquisitions can be difficult.86 Methods such as stable isotope labeling in with amino acids in cell culture (SILAC) and isobaric tag for relative and
absolute quantitation (iTRAQ) are commonly used; however, these methods are
examples of relative quantitation.87-89 Each method has both advantages and
disadvantages. An advantage of SILAC is that the label is incorporated upon protein
only be incorporated at the cellular level, it is expensive, and a great deal of optimization
must take place in order to ensure 100% label incorporation. Methods such as iTRAQ
are incorporated at the peptide level after a proteolytic digestion, and can allow for
analysis of up to eight samples simultaneously.89
In order to achieve absolute quantitation, a known standard must be used. The absolute
quantitation, or AQUA method involves synthesizing an isotopically labeled version of
the target peptide, and spiking a known amount into the sample.90 Typically the label is
13
C or 15N, as these labels do not result in a shift in chromatographic retention time, unlike deuterium and 18O containing compounds. Because of this, the synthetic peptide mimics the endogenous peptide in both retention time and fragmentation pattern, but
differs in mass. The absolute amount of the target peptide can be obtained from the
relative intensity of light to heavy transitions. The Gygi group confirmed the use of this
method by quantifying a K-48 polyubiqitinated peptide. Using this method, the copy
number per cell can be determined. Though effective, the synthesis of isotopically labeled
peptides can become expensive if high amounts are required.
Alternately, there has been success using dimethyl labeling as a method of relative
quantitation, as outlined in Figure 4.91 Key advantages of this method are its ability to be incorporated post-digest, thus being compatible with all protein samples, its quick
reaction time, and that it is inexpensive compared to other labeling techniques. A
disadvantage is a slight shift in retention time compared to unlabeled peptides. Samples
are treated with formaldehyde and sodium cyanoborohydride which introduces a
dimethyl label to primary amines in a peptide, typically at the N- terminus and on the
lysine side-chain. Using different isotopes of formaldehyde and sodium
cyanoborohydride resulting in labels of varying masses, typically allowing for a light
(+28 Da), medium (+32 Da), and heavy (+36 Da) label. By mixing these in a 1:1 ratio, up
to three samples could be analyzed in a single mass spectrometry experiment.92 Using this method, the Pinto lab was able to characterize the glycolytic proteome in MCF-7
breast cancer cells.75 SRM assays specific to dimethyl-labeled targets were used to monitor changes in protein expression in both insulin-growth factor-1 stimulated MCF-7
Figure 4. Dimethyl labeling of peptides. After tryptic digestion, peptides are treated
with formaldehyde followed by incubation with sodium cyanoborohydride, introducing a
dimethyl label to all primary amine groups present. Different isotopes of formaldehyde
1.3
Proteomics and Stem Cells
The proteome is the full protein complement of a cell under a set of given conditions.
Many studies investigating the transcriptome of hPSCs have been performed; however,
protein expression is not always directly correlated to the level of transcript, due to
post-transcriptional levels of regulation such as mRNA stability, protein degradation, protein
processing, alternative splicing, and rates of translation.93 Since proteins are the effectors of cellular processes, monitoring protein expression in addition to transcript is also
important. A major advantage of the proteomic approach is the ability to identify and
study many proteins with relatively little sample. Proteomic studies are frequently
performed using a “bottom-up” or “shotgun” approach, in which proteins are
enzymatically degraded to peptides, commonly using trypsin, and then analyzed by mass
spectrometry. Alternately, “top-down” proteomics involves the study of whole intact
protein mixtures by mass spectrometry. Due to the complexity of sample, there are
usually additional fractionation techniques ahead of LC-MS, including strong cation
exchange (SCX) or 1-D SDS-PAGE.94 SCX fractionation followed by reverse-phase LC-MS is known as Multi-Dimensional Protein Identification Technology (MuDPIT).95 Increasing the number of fractions often results in more protein identifications, however,
it significantly increases instrument time. Using multiple fractionation techniques is
complementary, and often results in increased protein coverage. Indeed, additional
fractionation has been shown to be more effective than repeated analyses in terms of total
number of proteins identified. 94, 96, 97 Ultra-long LC gradients have also been shown to increase identifications. Kocher et al. demonstrated the ability to detect 2761 proteins
from an unfractionated HeLa cell lysate over the course of a single-run 10 hour
gradient.98 Longer gradient and column lengths generally increase peptide identification, but they generally reach a point of diminishing returns.99
Due to the complex nature of regulation and wide variety of proteins involved, proteomic
studies of hPSCs have become increasingly common. Many levels of regulation are
present, so studies targeting the hESC membrane, the extracellular matrix and secreted
proteins have been conducted. The regulatory pathways and growth factors that govern
spectrometry technique known as iterative exclusion in order to analyze MEF and hESC
conditioned media.100 Iterative exclusion involves injecting the same sample numerous times, but including all previous identifications on an exclusion list, thus making it more
likely that low abundance proteins are identified on later injections. A large number of
previously undetected secreted growth factors were identified, including Activin A,
Lefty, and TGFβ, using this method.
Phosphorylation pathways have been shown to be important in hESC maintenance and
critical in cell signaling.101 Van Hoof et al. determined that the pluripotency-associated protein SOX2 becomes SUMOylated due to phosphorylation, suggesting that
phosphorylation may play a role in regulation.18 Rigbolt et al. conducted a temporal study characterizing the hESC phosphoproteome during differentiation.102 Two methods of differentiation were used, treatment with phorbol 12-myristate 13 acetate (PMA) and
culture in non-MEF-conditioned medium, in order to control for events specific to the
treatment and those caused by cell differentiation. Using a combined quantitative
proteomic and phosphoproteomic approach involving SCX, SILAC, and titanium dioxide
phosphopeptide enrichment, 6521 proteins and 23 522 phosphorylation sites were
profiled. It was found that numerous kinases, DNA methyltransferases and transcription
factors relating to differentiation were regulated by phosphorylation, notably the
transcriptional elongation complex PAF1, which binds to promoters of genes encoding
Oct4 and Nanog. Given the complexity of the network of factors promoting pluripotency,
a proteomics approach may be the best way to understand the interactions taking place.
Few hPSC studies involving SRM have been conducted. Yocum et al. used SRM to
verify and quantify early markers of neural differentiation such as collapsin response
mediator proteins 2 and 4 within hESCs grown in feeder-free conditions.103 Protein markers such as cytokeratin-8 identified in earlier global experiments as well as proteins
of significance such as Oct4 had SRM assays generated. Eight target proteins and 25
peptides were detected, though many targets that had not been detected in global
experiments were also left undetected in SRM analysis, suggesting that the target
SRM is a sensitive technique for detection of target proteins within hESCs. That
sensitivity could be applied to obtain quantitative data for such targets.
1.4
Thesis Objectives and Rationale
Because of the complexity of the networks and mechanisms responsible for hPSC
pluripotency, it would be beneficial to develop a targeted method capable of detecting
and quantifying a defined set of stem cell signaling proteins simultaneously.
Transcriptome studies have been performed, RNA transcript does not directly correspond
to protein expression, therefore it is important to analyze the proteome as well. Many of
these proteins have not been detected or quantified by conventional MS analysis. The
dynamic range and sensitivity of SRM might be able to overcome the sensitivity or
detection issues responsible for this.
In this thesis, an SRM protocol is developed with the intent of detecting and quantifying
the proteins and cell signaling factors responsible for maintenance of stem cell
pluripotency. This will provide a method capable of characterizing the “protein
fingerprint” of stem cell cultures, and serve as a starting point to analyze changes in
protein expression upon differentiation. We hypothesize this SRM protocol will provide
quantitative information on the expression of a curated set of pluripotency-related
proteins upon differentiation.
The objectives of this thesis are as follows. Firstly, two cell differentiation models within
which protein expression changes could be analyzed were characterized. These systems
included a BMP4-driven differentiation of H9 hESCs and a tamoxifen-induced
differentiation of CA1 Sox17/ERT2 hESCs towards definitive endoderm precursors. Secondly, SRM assays for proteins primarily from the NOTCH, Hedgehog, Wnt, and
Activin/Nodal signaling pathways were developed. Finally, quantitative protein
expression data was obtained through use of a consolidated scheduled SRM protocol for
analysis of differentiated and undifferentiated stem cell lysates.
By obtaining quantitative data in order to characterize the stem cell signaling networks
help improve understanding of the signaling networks and, in turn, the development of
defined media for optimal cell culture conditions, more effective conditions for
2
Methods
2.1
SRM Assay Development
Thirty-three initial protein targets were selected through a literature search, including
members of the canonical Wnt signaling pathway, the Activin/Nodal signaling pathway,
Hedgehog signaling pathway, and Notch signaling pathway. Protein sequences were
obtained from Uniprot and loaded into the SRM assay development software Skyline.
Proteins were digested in silico with trypsin, cleaving at arginine and lysine. Human
spectral libraries from GPMDB and NIST were loaded into Skyline. Peptides predicted to
be proteotypic were selected through use of several online applications, and through use
of criteria outlined by Lange et al.60Briefly, peptides selected had no missed cleavages, were 8-25 residues in length, were neither extremely hydrophilic or hydrophobic, and
lacked residues susceptible to oxidation like tryptophan and methionine. When
unavoidable, methionine oxidation was taken into account in transition mass.
PeptideCutter was used to predict efficiency of tryptic digestion, while the GPMDB was
used to identify whether target peptides were previously observed. Finally, target peptide
sequences were submitted to Protein BLAST by NCBI to confirm specificity for the
target protein.
2.2
Peptide Synthesis
Peptides were synthesized in-house on the MultiPepRS peptide synthesizer (Intavis) at
the 5-µmol level using the FMOC protocol on WANG Resin. Offline, arginine or lysine
residues were coupled to the resin before being used on the synthesizer.
Wang resin was suspended in a peptide synthesis vessel in dichloromethane (DCM), and
washed three times with DCM. The amino acid to be coupled was dissolved in DCM with
2,6-dichlorobenzoyl chloride and pyridine base, and allowed to mix for five minutes. The
activated amino acid solution was added to the peptide synthesis vessel and was allowed
to react with the resin for 4-6 hours, or overnight. Following coupling, resin was washed
six times with DCM. Resin coupling was quantitated using UV-Vis spectroscopy, if
substitution was less than desired (<0.3mmol/g), amino acid coupling was repeated.
deactivate hydroxyl groups on the resin. Resin was washed six times with DCM and
stored in a vacuum desiccator until use. After synthesis was complete, peptides were
dried and cleaved from resin with cleavage cocktail (95% trifluoroacetic acid, 2.5%
ddH2O, 2.5% triisopropylsilane) and precipitated by dropwise addition to cold diethyl
ether. Precipitated peptides were pelleted, solublized in 10% glacial acetic acid (GAA) in
ddH2O, and lyophilized. Lyophilized crude peptide was stored at -80°C. 1 nmol/mL stock
solutions of each peptide were made. Serial dilution was performed to create working
solutions of 100 fmol/µL. Peptide cocktails were injected into the 4000 QTRAP® to obtain MS/MS spectra. Briefly, an SRM-triggered DDA protocol was developed for each
peptide, to obtain both SRM transition and MS/MS sequence data, confirming peptide
identity. Y and b fragment ions were targeted for the doubly and triply charged
precursors of each target peptide. The top five transitions for each peptide were pooled
into a general SRM protocol for use on cell lysates to confirm endogenous detection.
2.3
Cell Culture
Unless otherwise stated, all cell culture reagents were obtained from Life Technologies.
Human embryonic stem cell lines H9 (WiCell) and CA1 were obtained from Dr. Cheryle
Seguin of The University of Western Ontario.2, 43, 52 hESCs were cultured and propagated on gamma-irradiated MEFs (CF-1 (GlobalStem), 0.5 M per 6 well plate, or 4DR), and fed
daily with hESC media (DMEM/F12, 20% KOSR, 1% NEAA, L-Glutamine,
β-mercaptoethanol (Fisher), and 4 ng/mL bFGF). 0.5M MEFs were plated on 6-well culture
plates coated with a 0.1% solution of gelatin. Cultures were incubated at 37°C and 5%
CO2. To prevent differentiation, at confluency, cells were passaged either mechanically
or using trypsin. Mechanical passaging was performed using a Pasteur pipette that was
heated and pulled into a picking tool. This pick was used to separate cell colonies into
small clumps, which were later plated on a new cell culture plate. For enzymatic
passaging, cells were washed twice with PBS, and treated with 0.5 mL 0.25% trypsin per
well for 2-3 minutes. Colonies were broken up with vigorous pipetting, collected, and
trypsin was deactivated with 1.5 mL hESC media. Colonies were passaged onto a fresh
Excess cells were suspended in cryopreservation media (50% hESC media, 45% KOSR,
5% DMSO) and stored in liquid nitrogen for future use. Fresh cultures were started by
thawing a vial of previously frozen hESCs obtained from liquid nitrogen storage. Vials
were thawed in a 37°C water bath until a single ice crystal remained. Vials were
disinfected with 70% ethanol. Thawed cells were diluted in 4 ml of hESC media and
plated into one well of a 6-well plate containing a MEF feeder layer. Media was changed
daily. Upon colony formation (up to two weeks), cells were passaged and expanded.
Before experiments, cells were passaged and cultured on the feeder-free basement
membrane Geltrex®. 6-well plates were coated with 30 µL/mL Geltrex® solution, and
stored at 37°C for at least 1 hour for polymerization to occur. Control cells were fed with
MEF-conditioned hESC media. To create MEF-CM, hESC media was conditioned on
MEFs for 48 hours, collected, filtered and aliquoted into 36 mL fractions and frozen at
-20°C until needed for cell culture. Fresh hESC media was added to frozen aliquots to
create a 70/30 hESC/MEF-CM media mixture which was used for feeder-free cell
culture. Differentiation media was identical to hESC media, except lacking bFGF and
instead containing either 0.1nM 4-OHT or 10 ng/mL rhBMP4 (R&D Systems). CA1
Sox17-ERT2 Clone K cell media was also supplemented with 0.6 ug/mL puromycin.
Cells were differentiated for 96 hours.
2.4
Protein Extraction
Adherent cells were washed twice with 2 mL of cold PBS (Life Technologies). Cells
were detached by incubating with 0.25% trypsin for 1-2 minutes, which was deactivated
with hESC media. Cells were washed with DPBS. Cells were lysed in urea cell lysis
buffer (8M urea, 50 mM ammonium bicarbonate, 1x HALT™ protease inhibitor cocktail (Thermo Scientific)) and incubated for 20 minutes on ice, with occasional vortex mixing.
To shear genomic DNA, ensure membrane lysis, and lower sample viscosity, cell lysates
were briefly sonicated. Samples were centrifuged at 10 000 × g for 10 minutes to remove
2.5
Bradford Assay
Protein samples were quantified by a modified Bradford assay. 104, 105 10 µL of sample was diluted to 80 µL using ddH2O. A 1 mg/mL solution of bovine serum albumin (BSA)
was used as a standard. A serial dilution scheme was performed on a 96-well plate as
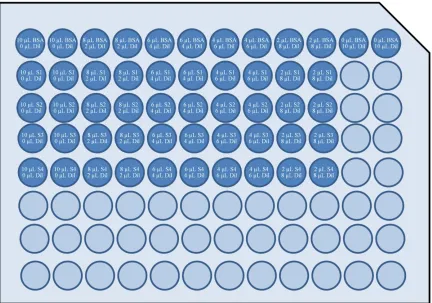
illustrated in Figure 5. Varying amounts of sample was added to each well along with a
diluent matching the make-up of the diluted sample. 200 µL of Coomassie Protein Assay
Reagent (Thermo Scientific) was added to each well and allowed to react for five
minutes. Absorbance at 595 nm was measured using a Victor3V 1420 Multilabel Counter (Perkin Elmer). Protein concentration was determined from the equation generated from
Figure 5. Bradford Assay setup. A serial dilution of BSA protein standard and samples
were resuspended to a total of 10 µL per well with diluent bringing lysis buffer
concentrations to acceptable levels for assay. 200 µL of Coomassie Protein Assay
2.6
Flow Cytometry
Cells cultured on Geltrex® were dissociated to a single-cell state with 1 mL of 0.25%
trypsin-EDTA solution. Trypsin was deactivated by adding it 1:1 to trypsin neutralizer
(Life Technologies). Cells were passed through a cell strainer, washed, and pelleted. Cell
count was determined by taking a 10 µL aliquot for use with a hemacytometer. Cells
were resuspended in FACS Buffer (PBS, 10% FBS) and divided equally among FACS
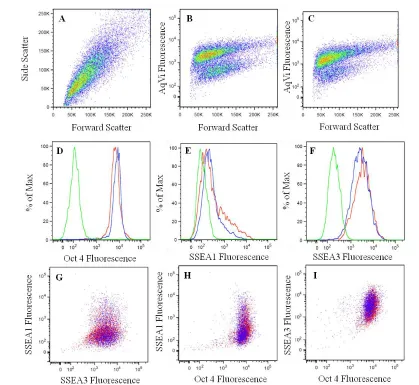
tubes. Cells were washed and pelleted. Cells were treated with aqua LIVE/DEAD® Fixable Dead Cell Stain (Invitrogen), incubated, washed and pelleted. Cells were treated
with surface marker conjugated-antibodies for Alexa Fluor® 647-SSEA1 and PE-SSEA3 (eBioscience), incubated for 20 minutes, then washed and pelleted. SSEA1 is a surface
marker of differentiation, while SSEA3 is a surface marker of pluripotency. Cells were
fixed with 200 µL 4% paraformaldehyde (PFA) solution for 10 minutes, washed, then
permeablized with 200 µL 0.1% Triton X-100 for 10 minutes and washed. Cells were
treated with antibodies for intracellular pluripotency marker Alexa Fluor® 488-Oct4 (eBioscience), incubated for 20 minutes, and then washed. Cells were analyzed using an
LSRII flow cytometer (BD Biosciences). For establishment of instrument parameters,
compensation controls, and fluorescence intensities, singly-stained compensation beads
(BD Biosciences) were used as well as unstained fixed and permeablized hESCs.
Fluorescence Minus One (FMO) controls were also analyzed, to help discriminate
between positive and negative signals. At least 20 000 events were acquired for fully
stained samples. Differentiated and undifferentiated samples were paired and run on the
same day. Flow cytometry data was analyzed in software FlowJo. All analysis was
performed on the gated live cell population, designated as being negative for aqua
LIVE/DEAD® fluorescence. Experiments were conducted in duplicate.
2.7
Immunofluorescence
Cells cultured on Geltrex were washed twice with PBS and incubated in fixing solution
(4% paraformaldehyde, 10% sucrose in PBS) at room temperature for 20 minutes. Cells
were washed with PBS. Cells being stained for intracellular markers were treated with
room temperature. Cells were washed with PBS, and treated with DAKO Protein Block
to eliminate nonspecific staining. Primary antibodies for Oct-4, SSEA4 and SSEA1
(Millipore) were added at a 2 µg/mL concentration in 0.1% BSA solution and rocked for
1 hour. Plates were sealed with Parafilm and incubated at 4°C overnight. Primary
antibody solution was removed, secondary antibody solution was added at a 1 µg/mL
concentration in 0.1% BSA solution, and rocked for 30 minutes to 1 hour. Secondary
antibodies used were Alexa Fluor® 488 goat anti-mouse IgG and Alexa Fluor® 568 goat anti-mouse IgM (Invitrogen). Secondary antibody solution was collected, cells were
rinsed with PBS. Cells were treated with 0.3 nM DAPI for nuclear staining, washed, and
then imaged by fluorescent microscopy with the Leica STP6000 at 10X magnification.
2.8
Localization of SOX17
CA1 Sox17/ERT2 Clone K cells were manually passaged onto Geltrex-coated glass
coverslips and allowed to attach for 24-hours. Cells were treated for 2 hours with 0.1 uM
4-OHT, washed, fixed, permeablized, treated with DAKO protein block and stained with
SOX17 mouse anti-human Alexa Fluor® 488-conjugated antibody (BD Pharmigen) for one hour. Cells were treated with DAPI for nuclear staining. Immunofluorescence
confocal microscopy was conducted on the LSM510 Meta Confocal Microscope (Zeiss).
2.9
RT-PCR
Total RNA was extracted from cells through use of 5-Prime PerfectPure RNA Extraction
Kit. 400 µL of lysis solution was added per well of confluent cells, and plates were
incubated and rocked for five minutes at room temperature. Lysis solution was pipetted
vigorously, and added to the RNA purification column. Purification columns were
centrifuged at 13 000 g for 1 minute and collection tubes were replaced after each step.
RNA was washed once with 400 µL Wash 1 solution, twice with 200 µL Wash 2
solution, and eluted with 50 µL of Elution solution. Total RNA was quantified by using
either a Nanodrop or plate reader. Absorbance ratios of 260 nm/280 nm and
260nm/230nm were monitored for sample quality. After quantification, RNA samples
were stored at -80°C until further use.
(Applied Biosystems). 2 μg of RNA sample was mixed with 10 µL of master mix (2.0 µL
10X RT buffer, 0.8 µL 25X dNTP, 2.0 µL 10X RT random primers, 1.0 µL reverse
transcriptase, 4.2 µL nuclease-free H2O) and brought up to 20 µL with ddH2O. The
mixed samples were placed in a thermocycler set at 25°C for 10 minutes, 37°C for 120
minutes, 85°C for 5 minutes and kept at 4°C. 1:100 dilutions of synthesized cDNA were
used in RT-PCR reactions. SYBR Green Master Mix (Bio Rad) was used. Samples were
incubated at 95°C for 3 minutes. Samples were then amplified at 95°C for ten seconds
followed by annealing at 60°C for forty cycles. Melt curve data was obtained by
increasing temperature from 65°C to 95°C in 0.5°C increments. Primers for targets can be
seen in Table 1. Markers of endoderm Cerberus, CXCR4, DLX5, GATA4 and GATA6
were used to confirm endoderm formation in CA1K differentiation system. Sox17 was
monitored to confirm constitutive expression of the transcript across differentiation.
Pluripotency markers Oct4, Nanog and Nodal were used to monitor loss of pluripotency
in both H9 and CA1K differentiation systems. All samples were normalized to GusB
expression. Each biological replicate was run in triplicate for each target. RT-PCR data
Table 1. List of Real-Time RT-PCR Primers.
Gene
Gene Accession
No. Forward Primer Reverse Primer
TBP NM_003194 TGTGCACAGGAGCCAAGAGT ATTTTCTTGCTGCCAGTCTGG
CER1 NM_005454 ACAGTGCCCTTCAGCCAGACT ACAACTACTTTTTCACAGCCTTCGT
CXCR4 NP_001008540 CACCGCATCTGGAGAACCA GCCCATTTCCTCGGTGTAGTT
DLX5 NM_005221 CGCCTCGCTGGGATTG CTTGATCTTGGATCTTTTGTTCTGAA
GATA4 NM_002052 TCCAAACCAGAAAACGGAAGC GCCCGTAGTGAGATGACAGG
GATA6 NM_005257 GCGGGCTCTACAGCAAGATG ACAGTTGGCACAGGACAATCC
NANOG NM_024865 TGATTTGTGGGCCTGAAGAAA GAGGCATCTCAGCAGAAGACA
OCT4 NM_002701 TGGGCTCGAGAAGGATGTG GCATAGTCGCTGCTTGATCG
SOX17 NM_022454 GGCGCAGCAGAATCCAGA CCACGACTTGCCCAGCAT
NODAL NP_060525 TGACTTCTCCTTCCTGAGCC GGGACAAAGTGACAGTGAATAG
2.10
Dimethyl Labeling
Subsequent to tryptic digestion, peptides were labeled by isotopic dimethyl labeling for
quantification purposes.107 Samples were treated with formaldehyde or deuterated-formaldehyde (Sigma), vortexed, and incubated for five minutes. Sodium
cyanoborohydride was added to the samples, which were allowed to incubate for two
hours. Undifferentiated samples were given the “light” label, and differentiated samples were given the “heavy”. After labeling, reactions were quenched by the addition of 10%
formic acid, and samples were mixed 1:1 and desalted as previously described. Combined
samples were brought to dryness in a vacuum centrifuge and reconstituted in 10% formic
acid for MS analysis.
2.11
Gel Electrophoresis
Samples were separated by 1D gel electrophoresis. 100 ug of protein lysate was diluted
1:2 with 2X loading buffer (4% SDS, 20% glycerol, 120 mM Tris-Cl pH 6.8, 200 mM
DTT, 0.1% bromophenol blue) and loaded onto a 1.5 mm 12% SDS-PAGE gel. 2 µL of
PrecisionPlus DualColour Protein Standard (Bio-Rad) was added to provide a molecular
weight ladder. Gels were run at a constant voltage of 200V. Finished gels were fixed for
one hour or overnight in fixing solution (50% methanol, 10% glacial acetic acid in
water), stained in Coomassie stain solution (50% methanol, 10% glacial acetic acid, 0.1%
Brilliant Blue R-250 in water) for 25-40 minutes, and destained in destain solution (45%
methanol, 10% glacial acetic acid, in water) until background was clear. Gel was
scanned, imaged, and stored in 5% glacial acetic acid at 4°C until use.
2.12
In-gel Tryptic Digestion
Gel lanes were cut into fractions, which were cut into ~2 mm cubes, put in
microcentrifuge tubes and destained with alternating washes with destaining solution (1
M ammonium bicarbonate/20% acetonitrile in ddH2O) and washing solution (50%
methanol/5% acetic acid in ddH2O). Once gel pieces were completely destained, they
were dehydrated with acetonitrile. Gel pieces were then rehydrated with
allowed to reduce for 30 minutes. Excess DTT solution was removed, and iodoacetamide
solution (100mM IAA in 100mM ammonium bicarbonate) was added, and gel pieces
were allowed to reduce for 30 minutes. IAA solution was removed, and gel pieces were
dehydrated with acetonitrile, allowed to rehydrate with 100 mM ammonium bicarbonate,
then dehydrated once more with acetonitrile. Gel pieces were completely dried in a
vacuum centrifuge. Gel pieces were fully rehydrated with trypsin (Fisher) solution (20
ug/mL trypsin in 50 mM ammonium bicarbonate), and allowed to incubate on ice for 10
minutes. Excess trypsin solution was removed, gel pieces were covered in 50 mM
ammonium bicarbonate and allowed to digest overnight at 37°C, for at least 18 hours.
Supernatants were collected, followed by two extractions with 10% formic acid, and a
final extraction with acetonitrile. Supernatants were pooled and volume was reduced in a
vacuum centrifuge. Prior to MS analysis, samples were reconstituted in 10% formic acid.
2.13
In-Solution Tryptic Digestion
100 ug of protein lysate was resuspended up to 100 µL in 50 mM ammonium
bicarbonate. The sample was reduced with 5 µL of DTT solution (200 mM DTT in
100mM ammonium bicarbonate) at room temperature for 45 minutes, vortexing
occasionally.. Samples were centrifuged at 5000xg for 30 seconds. Sample was alkylated
with 20 µL IAA solution (200 mM iodoacetamide in 100 mM ammonium bicarbonate) at
room temperature for 45 minutes, vortexing occasionally. Excess IAA was neutralized by
adding 10 µL of DTT solution, and left to incubate for 45 minutes at room temperature.
Sample was diluted with 50 mM ammonium bicarbonate to bring buffers to levels
acceptable for a trypsin digest. Trypsin solution was added to sample (1:25 trypsin to
protein) and sample was left to digest overnight for at least 18 hours at 37°C. Tryptic
samples were acidified 1:2 with 10% formic acid and desalted using 1 mL C-18 SPE
columns (Phenomenex). Columns were primed with 3×1 mL aliquots of Buffer B
(acetonitrile + 0.1% formic acid), and washed with 3×1 mL aliquots of Buffer A (ddH2O
+ 0.1% formic acid). Sample was loaded and washed with 3×1 mL aliquots of Buffer A.
Sample was eluted with 400 µL Buffer C (50% Buffer A, 50% Buffer B). Eluent was
brought to dryness using a vacuum centrifuge and reconstituted in 10% formic acid