Seismic velocity variations on the San Andreas fault caused by the 2004
M
6
Parkfield Earthquake and their implications
Yong-Gang Li1, Po Chen1, Elizabeth S. Cochran2, and John E. Vidale2
1Department of Earth Sciences, University of Southern California, Los Angeles, California 90089-0740, USA 2Institute of Geophysics and Planetary Physics, University of California at Los Angeles, Los Angeles, California 90095, USA
(Received February 28, 2006; Revised July 6, 2006; Accepted August 7, 2006; Online published March 15, 2007)
Repeated earthquakes and explosions recorded at the San Andreas fault (SAF) near Parkfield before and after the 2004 M6 Parkfield earthquake show large seismic velocity variations within an approximately 200-m-wide zone along the fault to depths of approximately 6 km. The seismic arrays were co-sited in the two experiments and located in the middle of a high-slip part of the surface rupture. Waveform cross-correlations of microearthquakes recorded in 2002 and subsequent repeated events recorded a week after the 2004 M6 mainshock show a peak of an approximately 2.5% decrease in seismic velocity at stations within the fault zone, most likely due to the co-seismic damage of fault-zone rocks during dynamic rupture of this earthquake. The damage zone is not symmetric; instead, it extends farther on the southwest side of the main fault trace. Seismic velocities within the fault zone measured for later repeated aftershocks in the following 3–4 months show an approximate 1.2% increase at seismogenic depths, indicating that the rock damaged in the mainshock recovers rigidity—or heals—through time. The healing rate was not constant but was largest in the earliest post-mainshock stage. The magnitude of fault damage and healing varies across and along the rupture zone, indicating that the greater damage was inflicted and thus greater healing is observed in regions with larger slip in the mainshock. Observations of rock damage during the mainshock and healing soon thereafter are consistent with our interpretation of the low-velocity waveguide on the SAF being at least partially softened in the 2004M6 mainshock, with additional cumulative effects due to recurrent rupture.
Key words:Parkfield earthquake, temporal velocity variation, rock damage and healing.
1.
Introduction
In order to relate present-day crustal stresses and fault motions to the geological structures formed by previous ruptures we must understand the evolution of fault systems on many spatial and time scales. Extensive research in the field, in laboratories, and with numerical simulations have illuminated that the fault zone undergoes high, fluctuating stress and pervasive cracking during an earthquake (e.g., Aki, 1984; Mooney and Ginzburg, 1986; Scholz, 1990; Rice, 1992; Kanamori, 1994). Rupture models that involve variations in fault-zone fluid pressure over the earthquake cycle have been proposed (e.g., Dieterich, 1978; Blanpied
et al., 1992, 1998; Olsen et al., 1998). Structural fault variations (e.g., Das and Aki, 1977; Rice, 1980) and rhe-ological fault variations (e.g., Sibson, 1977; Angevine et al., 1982) as well as variations in strength and stress may affect the earthquake rupture (e.g., Vidale et al., 1994; Beroza et al., 1995). Karageorgi et al. (1997) and Ko-rneevet al.(2000) detected and modeled traveltime changes in vibroseismograms in a localized region where the 1966
M6 Parkfield earthquake initiated and attributed these vari-ations to hydrological changes correlated with a signifi-cant pulse in fault slip and seismicity during 1987–1995.
Copyright cThe Society of Geomagnetism and Earth, Planetary and Space Sci-ences (SGEPSS); The Seismological Society of Japan; The Volcanological Society of Japan; The Geodetic Society of Japan; The Japanese Society for Planetary Sci-ences; TERRAPUB.
However, earthquake-related fault-zone damage and heal-ing have been documented quantitatively in only a few stud-ies (e.g. Maroneet al., 1995; Massonnetet al., 1996; Liet al., 1998; Yasuharaet al., 2005). The origin of the spatial and temporal variability in the fault zone properties also re-mains a major mystery. Repeated seismic surveys using ex-plosions along rupture zones of the 1992M7.4 Landers and 1999M7.1 Hector Mine, California earthquakes (Li and Vi-dale, 2001; Liet al., 2003; Vidale and Li, 2003) showed that seismic velocities within the shallow part of the fault zone increased by a few percentages within 1–6 years af-ter the mainshocks, most likely due to the closure of par-tially fluid-filled cracks that opened during the mainshocks. These observations illuminate a conceptual framework of fault-zone damage and healing progression associated with major earthquakes.
The low-velocity and low-resistivity zone on the San An-dreas fault (SAF) near Parkfield has been revealed by many researchers (e.g., Lees and Malin, 1990; Li et al., 1990; Ben-Zion and Malin, 1991; Michelini and McEvilly, 1991; Eberhart-Phillips and Michael, 1993; Thurberet al., 1997; Unsworth et al., 1997). Using fault-zone trapped waves recorded at the SAF near Parkfield (Liet al., 1997, 2004; Korneevet al., 2003), an approximately 100- to 200-m wide low-velocity waveguide has been delineated on the SAF at seismogenic depths at which shear-velocities are reduced by 20–40%. This distinct low-velocity zone is thought to
Fig. 1. (a) Map shows the location of seismic arrays (solid lines) deployed across and along the San Andreas fault and north strand at the site near Parkfield, California in 2002 and 2004, the M6 earthquake in 1966 and 2004 (grey stars), repeated shot PMM (black stars). Solid squares: Microearthquakes on Julian date R291 and R293 in 2002 and the SAFOD target event on R285 in 2004. Dots: Aftershocks of the
M6 earthquake on September 28, 2004 at Parkfield, California. Open squares: clusters of repeated aftershocks used in our previous study for post-mainshock fault healing (Liet al., 2006). Inset: Array A consists of 35 PASSCAL RT130s and 2 Hz L22 sensors with station spacing of 25 m. Coordinates of station ST0 of Array A, located on the SAF main trace are 35◦N54.566and 116◦W26.954. Arrays B and C consist of five stations spaced at 50 m. Station ST0 was located on the main fault trace. Fault lines and topographic map are provided by Michael Rymer of the USGS. (b) The vertical section along the San Andreas fault at Parkfield shows the locations of the seismic array, shots, the 1966 and 2004M6 earthquakes, and repeated events in 2002 and 2004 used in this study.
be caused by intense fracturing during earthquakes, brec-ciation, liquid-saturation, and possibly high pore-fluid pres-sure nears the fault. Recent results from the San Andreas Fault Observatory at Depth (SAFOD) drilling and borehole logs show a low-velocity zone on the SAF with an approxi-mately 25–30% velocity reduction and high porosity a cou-ple of hundred meters wide at the approximately 3.2-km depth, indicating a damage zone associated with the SAF (Hickmanet al., 2005). Byerlee (1990) and Rice (1992) note that pore fluids may migrate up from depth and that the fault-zone acts as a channel due in part to its greater permeability than that found in the adjacent blocks. High pressure-water comes up from depth, and the highly frac-tured fault-zone acts as a fluid channel. High permeability
and low strength have been measured in a damage zone cen-tered at the main trace of the Nojima fault in the 1995 Kobe earthquake (Lockneret al., 2000).
The M6 Parkfield earthquake that occurred on Septem-ber 28, 2004 provides us with a rare opportunity to examine the possible variations in the volume and magnitude of the low-velocity anomalies on the SAF over the earthquake cy-cle. After this earthquake, we deployed a dense seismic ar-ray at the same sites as used in our experiment in the fall of 2002. The data recorded for repeated explosions detonated within the SAF in 2002 and after the 2004 M6 Parkfield earthquake show decreases of a few percentages in terms of seismic wave velocity within an approximately 200-m-wide zone along the fault strike at the shallow depth, most likely due to the co-seismic damage of rocks during dynamic rup-ture in thisM6 mainshock (Liet al., 2006). The data from clustered aftershocks at depths up to 7 km show velocity recovery by approximately 1.2% within the fault zone in a 3-month period after the mainshock, indicating that the damaged rock has been healing following the mainshock. The width (∼200 m) of the damage zone characterized by larger velocity changes is consistent with the low-velocity waveguide model on the SAF near Parkfield derived from fault-zone trapped waves (Liet al., 1997, 2004; Korneevet al., 2003).
In this paper, we present the data recorded in our repeated seismic surveys at Parkfield in the fall of 2002 and after the 2004 M6 earthquake. Results from waveform cross-correlation of the data for repeated microearthquakes before and after the 2004 mainshock further validate the progres-sion of co-seismic damage and post-mainshock healing on the SAF at seismogenic depths associated with this earth-quake.
2.
Data and Results
Fig. 2. (a) Vertical-component seismograms recorded at Array A for three repeatedM1.0 microearthquakes occurring at a depth of 6 km and range of 8 km from the array on Julian date R291 in 2002 and on R339 and R350 in 2004. Seismograms have been<8 Hz filtered. Stations ST0 and E15 were located on the main fault (SAFm) and north strand (SAFn), respectively. The firstP- andS-waves arrive at approximately 2.2 s and 4.5 s. Fault-zone trapped waves (FZTW) are dominant between 5.5 s and 8.5 s at stations in the range of approximately 150–200 m marked by two bars. (b) Overlapped seismograms at working stations of Array A for the event on R291 in 2002 (black lines) and its repeated event on R339 in 2004 (gray lines). Seismograms have been<5 Hz filtered. FirstP-arrivals from repeated events are aligned. Similar waveforms are recorded, but waves travel slower after the 2004M6 Parkfield earthquake. (c) Seismograms recorded at Arrays B and C along the SAF main fault and north strand for these two repeated events, showing larger arrival delays at stations of Array B than Array C for the event in 2004. (e, f) Cross-correlations of seismograms for repeated events on R291 in 2002 and on R339 in 2004 (d) at stations of Array A within and outside of the fault zone and (e) at stations of Arrays B and C, showing larger traveltime increases at stations close to the SAF main fault.
the mainshock, sampling at 100 Hz. We culled 21 clusters of repeated events from approximately 800 aftershocks in our recorded data using the catalog of the Northern Cali-fornia Seismic Network (R. M. Nadeau, personal commu-nication, 2004). Each cluster includes at least five repeated aftershocks occurring at the same place, with the location difference among them being smaller than 100 m and the difference in magnitude being smaller than 0.5. The loca-tion precision of the Parkfield earthquakes in the catalog is less than a few tens of meters in relative distance. Repeated aftershocks in each cluster show similar waveforms with a correlation coefficient higher than 0.8. The data from clus-tered aftershocks have been used to examine the fault heal-ing after the 2004M6 earthquake (Liet al., 2006).
When we examined the data of the 2004 Parkfield after-shocks, we found some clustered aftershocks occurring at the same locations of the microearthquakes recorded at our seismic array in 2002, which located beneath Middle Moun-tain and the SAFOD drilling site, respectively (Fig. 1(b)).
We used the moving-window waveform cross-correlation method (Karageorgiet al., 1992, 1997; Niuet al., 2003) to measure the changes in seismic wave traveltimes for these repeated events recorded before and after the 2004 M6 Parkfield earthquake and to evaluate variations in velocity structure on the SAF associated with thisM6 earthquake.
Fig. 3. (a) Overlapped seismograms at working stations of Array A for the event on R291 in 2002 and its repeated event on R288 in 2004. Seismograms have been<5 Hz filtered. Other notations are the same in Fig. 2(b). (b) The maximum traveltime increases of seismic waves in 2–10 s at stations versus distances from the main fault trace measured by waveform cross-correlations between the event on R291 in 2002 and its repeated events on R288, R339, and R350 in 2004. (c) Traveltime increases and velocity decreases in percentages and standard deviations for shear wave and fault-zone trapped waves at all available stations, measured by moving window cross-correlations between the event on R291 in 2002 and six repeated events on R288 to R350 in 2004.
depth of 6 km and approximately 5 km northwest of the ar-ray (Fig. 1). Prominent fault-zone trapped waves (FZTW) with relatively large amplitudes and long wavetrains follow-ing S-waves appeared at stations within an approximately 200-m-wide zone near the main fault trace. Figures 2(b) and (c) illustrate overlapped seismograms at three arrays across and along the fault for microearthquakes on R291 in 2002 and on R339 in 2004, showing similar waveforms for them, but seismic waves traveled slower for the repeated event after the 2004M6 Parkfield earthquake. Note that sta-tions on Array B along the main fault trace registered larger traveltime changes than those on Array C along the north fault strand. Figure 2(d) and (e) illustrates moving-window cross-correlations of waveforms recorded at Arrays A, B, and C for these two repeated events in 2002 and 2004, and shows approximately a 35- to 65-ms delay in the traveltime
of fault-zone-trapped waves, which are dominant between 5.5 s and 8.5 s at stations within the fault zone, but a less than 20-ms delay in traveltime for theS-wave and later coda at stations in surrounding rocks. Stations on the north fault strand registered a traveltime delay of approximately 25–35 ms in a traveltime of between 5.5 and 8.5 s. In our compu-tation, we aligned the firstP-arrivals for repeated events to avoid errors in event origin times in the catalog so that the true traveltime delays for S and trapped waves may con-tain small undetermined changes in P traveltime. Assum-ing that velocity changes were uniform in the crust sampled by these waves, the increases in traveltime are straightfor-ward to interpret. In 2004, the dominant trapped waves ar-rived between 5.5 and 8.5 s, with a 35–65 ms delay, so the shear wave velocity within the fault zone decreased by ap-proximately 0.7% on average plus unmeasured changes for the P-wave between R291 in 2002 and R339 in 2004. In contrast, the shear wave velocity in surrounding rocks de-creased by<0.25% during the same time period, according to an approximately 10 ms traveltime delay forS-waves ar-riving at approximately 4.5 s. To justify this simplification for estimating velocity variations from measured traveltime changes, we show the synthetic traveltime delays between the repeated events using the depth-variable velocity model in the discussion section.
-waves and normalized to the earliest event on R288 among them. Again, the results show velocity decreases after the
M6 Parkfield earthquake on September 28, 2004 (R273), with the largest change—approximately 2.3%—occurring within approximately a 200-m-wide zone along the SAF main trace and moderate changes occurring at the north fault strand.
Assuming that there was no significant change in seismic velocity between the fall of 2002 and September 28, 2004 at the Parkfield region, the velocity changes measured in our repeated seismic surveys are most likely associated with the September 28, 2004M6 Parkfield earthquake that caused a velocity decrease due to co-seismic damage of fault-zone rocks with cracks opening in dynamic rupture. The dam-aged rock then recovered its rigidity with time after the mainshock due to closure of the cracks. Although processes associated with aseismic transients have been shown to in-fluence wave propagation at Parkfield (Niu et al., 2003), there were no such transients and resolvable measurements in seismic velocity in this area between the fall of 2002 and the 2004 M6 earthquake (Rubinstein and Beroza, 2005). A seasonal water table change and rainfall would affect the seismic velocity at a shallow depth (Karageorgiet al., 1997). However, as we carried out repeated experiments at Parkfield in the same season of 2002 and 2004, there were no significant variations in water table. The driller showed that the water table in the shot-hole at Middle Mountain was at the depth of approximately 25 m in the fall of 2002 and 2004. Thus, it is plausible to attribute our observed velocity changes at Parkfield to the 2004M6 earthquake. We found that the damage zone is not symmetric but instead extends farther on the southwest side of the main fault trace. In our previous study of fault-zone structure at Parkfield (Liet al., 2004), we delineated an approximate 150-m-wide, dis-tinct low-velocity waveguide on the main SAF and a branch waveguide with a smaller velocity reduction on the north strand at this site. The width of this zone, which is char-acterized by the largest velocity decreases caused by the recent M6 earthquake, is consistent with the width of the low-velocity zone on the SAF delineated using fault-zone trapped waves. Observations of seismic velocity changes before and after the 2004 M6 Parkfield earthquake indi-cate that the low-velocity waveguide on the SAF has been at least partially softened, with additional cumulative dam-age due to recurrent ruptures. We interpret the data as in-dicating that the north strand may have experienced minor breaks due to secondary slip and strong shaking from rup-tures on the main fault during the major earthquakes on the SAF, including the 2004M6 mainshock.
The above examples show a larger delay in traveltime be-tween the event in 2002 and the earlier repeated event in 2004, indicating that seismic velocities within the fault zone might have recovered with time after the 2004 M6 earth-quake. In order to confirm this trend, we examined travel-time delays between the event on R291 in 2002 and its ten repeated events occurring on R281–R360 from 1 week to approximately 3 months after the 2004M6 mainshock. Fig-ure 4(a) depicts seismograms of these repeated aftershocks at stations W1 and E7, which are located within and out of the fault zone, respectively. P-arrivals for all events are
Fig. 4. (a) Vertical-component seismograms recorded at stations W1 and E7 of Array A for the microearthquake on R291 in 2002 (black line) and ten repeated events from R281 to R360 in 2004 (gray lines), showing larger traveltime increases at station W1 within the fault zone than at station E7, 175 m located off the fault. Seismograms have been low-pass (<5 Hz) filtered. FirstP-arrivals from repeated events are aligned at approximately 2.2 s. (b) Left: Moving window cross-correlations of waveforms show traveltime increases between the event on R291 in 2002 and its ten repeated events in 2004, with the largest increase for the earliest repeated event on R281 and a decreasing trend with dates after the mainshock. Traveltime increases are much larger at station W1 than station E7 in the same time period. Right: The maximum traveltime delays and shear velocity changes in percentages measured at stations W1 and E7 between the event on R291 in 2002 and its repeated events in 2004. The curve is the logarithmic fit to measurements of traveltime changes, with a constant of velocity change 0.012/day in logarithm.
Fig. 5. (a) Vertical-component seismograms recorded at six stations of Array A for aM1.4 earthquake occurring at a depth of 5 km and at a distance (range) of 18 km NW of the array on Julian date R293 in 2002 and a repeated event on R355 in 2004. Seismograms have been low-pass (<5 Hz) filtered and are plotted using a common scale for all traces. The firstP-arrivals from repeated events are aligned at approx-imately 4.2 s. Moving-window cross-correlations of waveforms for the repeated events show the largest traveltime increases at stations ST0 and W1 within the fault zone. Station W15 located at the north fault strand registered moderate traveltime increase. (b) Vertical-component seismograms at stations W1 and E3 within and outside of the fault zone for five repeated aftershocks occurring on the SAF at the loca-tion of SAFOD target events at a depth of approximately 3 km. First
P-arrivals from these events are aligned at approximately 3.6 s. Seis-mograms for the latest event on R023 in 2005 (black line) are overlaid by those from four repeated aftershocks in 2004 (gray lines), showing that seismic waves traveled the fastest for the latest event. Waveform cross-correlations between the event on R023 in 2005 and its earlier repeated events show that traveltimes from these events decrease with time after theM6 mainshock.
fault zone for these repeated aftershocks in 2004 relative to those for the event on R291 in 2002. The increases in seismic velocity with time after the mainshock indicate that the damaged rock has been healing, based on its rigidity re-covery, after the earthquake. However, the healing rate was not constant, but decreased logarithmically with time, simi-lar to our previous observations at rupture zones of the 1992 Landers and 1999 Hector Mine earthquakes (Liet al., 2003;
Vidale and Li, 2003).
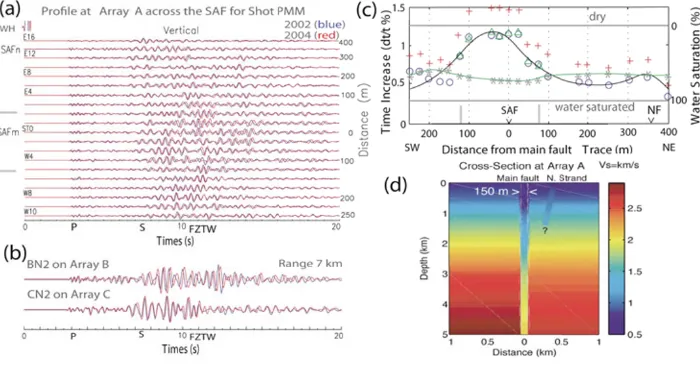
Fig. 6. (a) Vertical-component seismograms recorded at Array A across the SAF for repeated shot PMM detonated within the low-velocity fault zone at 7 km NW of the array on October 16, 2002 (R289) and December 28, 2004 (R364). Seismograms have been low-pass (<3 Hz) filtered and are plotted using a common scale for all traces in each plot. The shot origin time is at 0 s.P- andS-waves arrive at approximately 3 s and 7 s. Fault-zone trapped waves (FZTW) with large amplitudes and long wavetrains are dominant betweenSarrival and 15 s at stations in the range of approximately 150 m, as marked by two bars. Similar waveforms were recorded for the repeated shots, but these waves traveled slower after theM6 Parkfield earthquake in 2004. WH denotes the station located at the wellhead of shot-hole; the unclipped firstParrivals show identical arrival times for the repeated shots. (b) Vertical-component seismograms recorded at station BN2 of Array B and CN2 of Array C for repeated shot PMM in 2002 and 2004, showing similar waveforms, but with a larger delay at Array B along the main fault than at Array C along the north fault (NF) strand. (c) Traveltime increases in percentages forP(red crosses),S(blue circles), and trapped waves (green circles), as measured by cross-correlations of seismograms at Array A across the SAF for repeated shot PMM in 2002 and 2004, showing seismic velocity decreases. The solid curve is a polynomial fit to traveltime increases ofS-waves in 2004. A pair of vertical grey bars denotes a 150- to 200-m-wide zone with greater travel time increases. The ratio of traveltime changes for P-waves toS-waves (green stars with a curve) indicates the degree of water saturation in cracks. Two horizontal light-colored lines indicate the ratios predicted for a range of water percentage for Poisson solid. (d) The low-velocity waveguide model on the SAF near Parkfield derived from fault-zone trapped waves (Liet al., 2004). The main fault zone is marked by an approximately 150-m-wide waveguide in which velocities are reduced by 30–40% andQis 10–50 between the surface and at a 5-km depth. The north strand is marked by a minor waveguide.
which is smaller than the value measured for the cluster of repeated events in the middle of a high-slip part of the surface rupture during the similar time period, as shown in Fig. 4.
3.
Discussions and Conclusion
We have used the data from repeated explosions det-onated within the SAF near Parkfield before and after the 2004 M6 earthquake to measure the seismic velocity changes associated with this earthquake. Figure 6(a) shows seismograms with similar waveforms recorded at the cross-fault Array A for the repeated shots detonated on October 16, 2002 and December 30, 2004. However, seismic waves traveled slower after the 2004 M6 earthquake, with the largest traveltime increases occurring in an approximately 200-m-wide zone along the main fault, moderate increases occurring at the north strand, and much smaller changes oc-curring in surrounding rocks (Fig. 6(b)). Moving-window cross-correlations of waveforms for the repeated shots show a decrease of approximately 1.3% in shear-velocity within the fault zone. We also measured traveltime changes for re-peated aftershocks in 21 clusters located at different depths along the rupture of the 2004 earthquake and found that the maximum shear-velocity increased by approximately 1.2% within the fault zone beneath Middle Mountain during the 3 months (approx.) starting 1 week after the mainshock (Liet al., 2006). Assuming that there were no significant changes in seismic velocity at the Parkfield area during the time pe-riod between the shot in 2002 and the 2004M6 earthquake, we estimate a net decrease in shear-velocity of at least
ap-proximately 2.5% owing to co-seismic damage of fault-zone rocks caused by dynamic rupture of this M6 earth-quake even though we lack data in the first week after the mainshock. We note that the ratio of traveltime changes for
P- toS-waves is 0.57 within the rupture zone and approxi-mately 0.65 in the surrounding rocks [Fig. 6(c)], indicating that cracks within the fault zone are more wet than those outside of the zone according to equations for the elastic moduli of the medium with cracks (Garbin and Knopoff, 1975). Water may be coming up from depth, with the highly fractured fault-zone acting as a fluid channel.
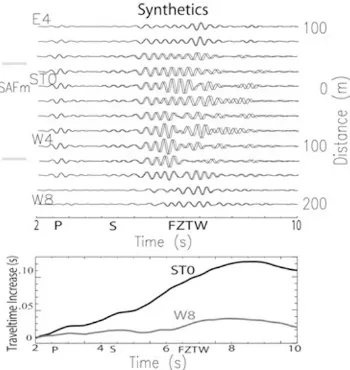
Fig. 7. Top: Vertical-component of finite-difference synthetic seismo-grams at stations of array A for the two repeated events on R291 in 2002 (black lines) and on R281 in 2004 (gray lines) using the fault-zone model shown in Fig. 6(d). Model parameters used for the event in 2002 are the same as those in the model resulted from our previous experiment at this site in 2002 (Liet al., 2004). Velocities are reduced by 2.5% and 0.5% within and out of the fault-zone, respectively, for computation of seismograms for the event in 2004. Seismograms have been<5 Hz filtered. FirstP-arrivals from repeated events are aligned. bottom: Moving-window cross-correlations of seismograms for the re-peated events at stations ST0 and W8 of array A within and out of the fault zone. Other notations are the same as in Fig. 2.
models (e.g., Scholz, 1990).
In the present paper, we report data from micro-earthquakes recorded at our array in October 2002 and their repeated events recorded at the same array site after the 2004 M6 Parkfield earthquake in order to determine the seismic velocity changes on the SAF at seismogenic depth before and after this earthquake using the moving-window waveform cross-correlation for these repeated events. The measurements of traveltime changes (Figs. 2 and 3) indi-cate an approximately 2.5% shear-velocity decrease within the fault zone between R291 in 2002 and R281 in 2004, 1 week after the M6 Parkfield earthquake. This value is consistent with our previous estimation of the net velocity decrease on the SAF caused by this M6 earthquake using the data from repeated shots and clustered aftershocks, as described above. We interpret our data as indicating that the 2004 M6 mainshock caused additional damage to the rocks, while the low-velocity damage structure on the SAF has cumulated effects in terms of recurrent rupture of his-torical earthquakes.
We simulated seismograms for the event on R291 in 2002 using a three-dimensional finite-difference code (Graves, 1996) in terms of the depth-variable structure model shown in Fig. 6(d) and for its repeated event on R281 in 2004, with the velocities reduced by 2.5% within the fault zone and by 0.5% in wall-rocks from original values in this model. Fig-ure 7 shows synthetic seismograms at the cross-fault array and traveltime delays measured by moving-window cross-correlation of waveforms at stations STO and W8 within and outside of the fault zone. The synthetic traveltime de-lays between these repeated events are in general in
accor-Fig. 8. S-wave velocity changes within the rupture zone associated with theM6 Parkfield earth-quake on September 28, 2004. TheSvelocity decreased by approximately 1.3% in the time period between the two repeated shots on October 16, 2002 and December 28, 2004. Measure-ments for repeated microearthquakes occurring in 2002 and in 1 week after the 2004M6 mainshock show an approximately 2.5% decrease in
Svelocity, most likely due to the co-seismic rock damage during the mainshock. Measurements for repeated aftershocks show that theS ve-locity within the rupture zone increased by approximately 1.2% in the following 3 months, indicating fault healing with rigidity recovery of damaged rocks.
dance with observations (Fig. 4(b)).
The low-velocity anomalies on the SAF might vary over the earthquake cycle. Our measurements of the changes in traveltime for repeated aftershocks show an approximately 1.2% increase in shear-velocity within the rupture zone dur-ing the 3 months (approx.) startdur-ing 1 week after the 2004
M6 Parkfield earthquake (Fig. 4) and indicate that the fault healed through rigidity recovery of damaged rocks in the post-seismic stage due to the closure of cracks that opened in the mainshock. The healing rate decreases logarithmi-cally through time, with a greater healing rate in the earlier stage of the inter-seismic period (Fig. 8).
We find that the magnitude of rock damage and healing varies across the SAF, with the largest value within an ap-proximately 150- to 200-m-wide low-velocity zone (Figs. 3 and 6) that experienced greater damage in the 2004 M6 earthquake. The damage zone is asymmetric, broader on the southwest side of the main fault trace. The asymmetry may imply that the fault zone has accumulated significant cumulative damage due to previous large earthquakes on the SAF. When a fault ruptures, it may preferentially damage the already weakened rocks in the zone, even though those rocks are not symmetrically distributed on either side of the main slip plane (Chesteret al., 1993). Alternately, greater damage may be inflicted in the extensional quadrant than in the compressional quadrant near the propagating crack tip (Andrews, 2005). We shall use fault-zone guided waves and the coda wave interferometry method (Snieder and Vri-jlandt, 2005) to study if the width of the damage zone also changed due to thisM6 earthquake.
fault-zone guided waves on the SAF southwest of Middle Mountain, possibly due to dewatering by fracture closure and fault-normal compression. Our observations are con-sistent with the results obtained from 21 clusters of after-shocks along the 2004 rupture at Parkfield (Liet al., 2006) and with our previous tentative conclusion based on obser-vations of fault healing at the Landers and Hector Mine rup-ture zones that greater damage was inflicted and, therefore, greater healing is observed in regions with a larger slip in the mainshock (Liet al., 2003). Our calculation of an ap-proximately 2.5% decrease in velocity using the formula for cracked media (O’Connell and Budiansky; also refer to Liet al., 2003) revealed that the apparent crack density within the rupture zone increased by approximately 0.035, which caused an approximately 5% decrease in shear rigid-ity of the fault-zone rock during the dynamic rupture of the 2004 M6 Parkfield earthquake. The subsequent 1.2% in-crease inSvelocity suggests that the apparent crack density within the rupture zone decreased by 0.017 in the following 3 months (approx.).
Rubinstein and Beroza (2005) observed significant trav-eltime delays caused by the 2004 M6 Parkfield earthquake at the seismic network stations for repeated earthquakes oc-curring at depths of approximately 3 km near the SAFOD drilling site before and after the 2004M6 earthquake. They measured traveltime increases exceeding approximately 25 ms in Scoda for the repeated SAFOD target events occur-ring on October 21 and 23, 2003, approximately 1 year be-fore the M6 earthquake, and on September 28, 2004, im-mediately after the mainshock at borehole station MM of Parkfield Seismic Network, located approximately 200 m NE of the SAF main trace (Fig. 1(a)). They also observed direct S-wave arrival delays of up to 7 ms to many of the surface stations but much smaller delays at borehole sta-tions in the Parkfield area. These researchers attribute the time delays to cracks opened during the strong shaking of theM6 Parkfield earthquake at depths shallower than 100– 300 m. Crack opening is likely favored at shallow depths with soft rock and lower confining crustal stress in a broad distance range from the epicenter due to strong ground mo-tion. Our stations, in contrast, were located much closer to the fault than the network stations of Rubinstein and Beroza (2005). The data presented here from the shots and after-shocks located on or close to the fault mainly document the changes within the fault zone rather than the changes in sur-rounding rocks. The smaller (<0.3%) background changes in traveltime registered at off-fault stations of our seismic array seem to be consistent with the observations of Rubin-stein and Beroza (2005) at shallow depths. We interpret the observed velocity decrease within the fault zone as being mainly due to crack opening caused by the dynamic rupture of the latest M6 earthquake. Shaking-induced weakening may also effect the rupture propagation because the pre-existing weak, low impedance fault zone is susceptible to damage (Fialkoet al., 2002; Vidale and Li, 2003).
During the fault healing, the reduction of crack density may be controlled by a combination of mechanical and chemical processes on the active fault. Fault healing may be affected by time-dependent frictional strengthening (Vidale
et al., 1994; Marone, 1998), rheological fluid variations or
changes in the state of stress (Blanpiedet al., 1998), cemen-tation, recrystallization, pressure solution, crack sealing and grain contact welding (Hickman and Evans, 1992; Olsen
et al., 1998), and the fault-normal compaction of the rup-ture zone (Massonnetet al., 1996; Boettcher and Marone, 2004) as well as chemical healing from the mineralogical lithification of gouge materials over longer time period at seismogenic depth (Angevineet al., 1982). In addition, the ‘crack dilatancy’ mechanism (Nur, 1972) associated with the earthquake is likely to operate in co-seismic fault dam-age and post-mainshock healing even if other processes are also active. The temporal changes in crack-induced anisotropy near the Nojima fault that ruptured in the 1995
M7.1 Kobe earthquake have been observed in shear-wave splitting (Tadokoroet al., 1999; Ikuta and Yamaoka, 2004). However, there was no clear change in the magnitude of shear-wave splitting after the 1999 Hector Mine earthquake (Cochranet al., 2003), suggesting that the shear-wave split-ting may be not sensitive enough to detect small changes in crack density because the velocity change influences both the fast and slow orthogonally-polarized shear waves.
Stress-related temporal changes in seismic velocity caused by the 1989 Loma Prieta, California earthquake have been reported (Ellsworthet al., 1992; Dodge and Beroza, 1997; Schaff and Beroza, 2004). Baisch and Bokelmann (2001) suggest that co-seismic deformation caused by this earthquake might lead to crack opening either by local-izations of shear stress or by elevated pore fluid pressure. Concentrated deformation at low-strength fault zones may also help to cause damage. After the earthquake, relaxation processes, such as crack healing, fluid diffusion, and post-seismic deformation, cause the cracks to close again at an approximately logarithmic recovery rate (Dieterich, 1972; Richardson and Marone, 1999). As rocks heal, either con-tinued right-lateral deformation due to the regional stress field that dominates the co-seismic displacements or fault-normal compression owing to a reduction in crack volume can contribute to the healing process. The variation in ap-parent crack density inferred by seismic velocity measure-ments reflects changes in either crack volume or a rear-rangement of aspect ratio caused by the earthquake. We tentatively conclude that the cracks that opened during the mainshock closed soon thereafter. This conclusion is con-sistent with our interpretation of the soft low-velocity fault-zone waveguide on the SAF being at least partially weak-ened in the 2004M6 mainshock, but with possible signifi-cant cumulative effects as well.
Our observations of fault zone damage and healing asso-ciated with the latest M6 Parkfield earthquake are in gen-eral consistent with the model of velocity evolution owing to damage and healing for Landers and Hector Mine earth-quakes (Vidale and Li, 2003). However, the magnitude of damage and healing observed near Parkfield on the SAF is smaller than those observed on the Landers and Hector Mine rupture zones. This difference is probably related to the smaller magnitude mainshock and smaller slip and, pos-sibly, by differences in stress drop, pore-pressure, and rock type.
EarthScope Grant EAR-0342277, USGS Grant NEHRP20060160, and partially by the Southern California Earthquake Center. Spe-cial thanks to S. Hickman, W. Ellsworth, and M. Zoback of SAFOD PIs for their coordination in our experiments for seismic characterization of the SAFOD drilling. We acknowledge J. Varian, G. Varian, G. Work, and B. Mosby for permission to conduct our experiment on their lands, and the IRIS for the use of PASSCAL instruments. We are grateful to P. Malin, C. Thurber, S. Roecker, M. Rymer, R. Catchings, A. Snyder, R. Russell, L. Powell, B. Nadeau, N. Boness, D. McPhee, and F. Niu for their collaborations in our research at Parkfield. We thank Editor Eiichi Fukuyama, reviewer T. Mizuno, and an anonymous reviewer for their helpful and comments on the manuscript. SCEC is funded by NSF Cooperative Agreement EAR-0106924 and USGS Cooperative Agreement 02HQAG0008. The SCEC contribution number for this paper is 962.
References
Aki, K., Asperities, barriers, characteristic earthquakes, and strong motion prediction,J. Geophys. Res.,89, 5867–5872, 1984.
Andrews, D. J., Rupture dynamics with energy loss outside the slip zone,
J. Geophys. Res.,110, B01307, dio:10.1029. 2005.
Angevine, C. L., D. L. Turcotte, and M. D. Furnish, Pressure solution lithi-fication as a mechanism for the stick-slip behavior of faults,Tectonics, 1, 151–160, 1982.
Baisch. S. and G. H. R. Bokelmann, Seismic waveform attributes before and after the Loma Prieta earthquake: scattering change near the earth-quake and temporal recovery,J. Geophys. Res.,106, 16,323–16,337, 2001.
Ben-Zion, Y. and P. Malin, San Andreas fault zone head waves near Park-field, California,Science,251, 1592–1594, 1991.
Beroza, G. C., A. T. Cole, and W. L. Ellsworth, Stability of coda wave attenuation during the Loma Prieta, California, earthquake sequence,J. Geophys. Res.,100, 3977–3987, 1995.
Blanpied, M. L., D. A. Lockner, and J. D. Byerlee, An earthquake mecha-nism based on rapid sealing of faults,Nature,359, 574–576, 1992. Blanpied, M. L., C. J. Marone, D. A. Lockner, J. D. Byerlee, and D. P.
King, Quantitative measure of the variations in fault rheology due to fluid-rock interactions,J. Geophys. Res.,103, 771–786, 1998. Boettcher, M, S. and C. Marone, Effects of normal stress variation on the
strength and stability of creeping faults,J. Geophys. Res.,109, B03406, doi:10.1029/2003JB002824, 2004.
Byerlee, J., Friction, overpressure and fault-normal compression,Geophys. Res. Lett.,17, 2109–2112, 1990.
Chester, F. M., J. P. Evans, and R. L. Biegel, Internal structure and weak-ening mechanisms of the San Andreas fault,J. Geophys. Res.,98, 771– 786, 1993.
Cochran, S. E., J. E. Vidale, and Y. G. Li, Near-fault anisotropy following the Hector Mine earthquake,J. Geophys. Res.,108, B9, 2436–2447, ESE 11, 2003.
Das, S. and K. Aki, Fault plane with barriers: A versatile earthquake model,
J. Geophys. Res.,82, 5658–5670, 1977.
Dieterich, J. H., Time-dependent friction in rocks,J. Geophys. Res.,77, 3690–3697, 1972.
Dieterich, J. H., Time-dependent friction and the mechanics of strike-slip,
Pure Appl. Geophys.,116, 790–806, 1978.
Dodge, D. and G. C. Beroza, Source array analysis of coda waves near the 1989 Loma Prieta, California mainshock: Implications for the mech-anism of coseismic velocity changes,J. Geophys. Res.,102, 24,437– 24,458, 1997.
Eberhart-Phillips, D. and A. J. Michael, Three-dimensional velocity struc-ture, seismicity, and fault structure in Parkfield region, central Califor-nia,J. Geophys. Res.,98, 15737–15758, 1993.
Ellsworth, W. L., A. T. Cole, G. C. Beroza, and M. C. Verwoerd, Changes in crustal wave velocity association with the 1989 Loma Prieta, Califor-nia earthquake,EOS,73, 360, 1992.
Fialko, Y., D. Sandwell, D. Agnew, M. Simons, P. Shearer, and B. Min-ster, Deformations on nearby faults induced by the 1999 Hector Mine earthquake,Science,297, 1858–1862, 2002.
Garbin, H. D. and L. Knopoff, Elastic moduli of a medium with liquid-filled cracks,Quart. Appl. Math. October,32, 301–303, 1975. Graves, R. W., Simulating seismic wave propagation in 3D elastic
me-dia using staggered-grid finite differences,Bull. Seismol. Soc. Am.,86, 1091–1106, 1996.
Hickman, S. H. and B. Evans, Growth of grain contacts in halite by solution-transfer: Implications for diagenesis, lithification, and strength recovery, inFault Mechanics and Transport Properties of Rocks, pp. 253–280, Academic, San Diego, Calif., 1992.
Hickman, S. H., M. D. Zoback, and W. L. Ellsworth, Structure and Com-position of the San Andreas fault zone at Parkfield: Initial results from SAFOD Phase 1 and 2,EOS, Trans. Am. Geophys, Union,83(47), 237, 2005.
Ikuta, R. and K. Yamaoka, Temporal variation in the shear wave anisotropy detected using the accurately controlled routinely op-erated signal system (ACROSS), J. Geophys. Res., 109, B09305, doi:10.1029/2003JB002901, 2004.
Kanamori, H., Mechanics of earthquakes,Ann. Rev. Earth Planet. Sci.,22, 207–237, 1994.
Karageorgi, E., R. Clymer, and T. McEvilly, Seismological studies at Park-field: II: Search for temporal variations in wave propagation using vibro-seis,Bull. Seismol. Soc. Am.,82, 1388–1415, 1992.
Karageorgi, E. D., T. V. McEvilly, and R. W. Clymer, Seismological stud-ies at Parkfield: IV: Variations in controlled-source waveform parame-ters and their correlation with seismicity, 1987 to 1995,Bull. Seismol. Soc. Am.,87, 39–49, 1997.
Korneev, V. A., T. V. McEvilly, and E. D. Karageorgi, Seismological stud-ies at Parkfield VIII: Modeling the observed travel-time changes,Bull. Seismol. Soc. Am.,90, 702–708, 2000.
Korneev, V. A., R. M. Nadeau, and T. V. McEvilly, Seismological studies at Parkfield IX: Fault-zone imaging using guided wave attenuation,Bull. Seismol. Soc. Am.,80, 1245–1271, 2003.
Langbein, J., R. Bocherdt, D. Dreger, J. Fletcher, J. L. Hardbeck, M. Hellweg, C. Ji, M. Johnston, J. R. Murray, R. Nadeau, M. J. Rymer, and J. A. Trieman, Preliminary report on the 28 September 2004, M 6.0 Parkfield, California earthquake,Seismol. Res. Lett.,76, No. 1, 10–26, 2005.
Lees, J. M. and P. E. Malin, Tomographic images of P wave velocity variation at Parkfield, California,J. Geophys. Res.,95, 21,793–21,804, 1990.
Li, Y. G. and J. E. Vidale, Healing of the shallow fault zone from 1994– 1998 after the 1992 M7.5 Landers, California, earthquake,Geophys. Res. Lett.,28, 2999–3002, 2001.
Li, Y. G., P. C. Leary, K. Aki, and P. E. Malin, Seismic trapped modes in Oroville and San Andreas fault zones,Science,249, 763–766, 1990. Li, Y. G., W. L. Ellsworth, C. H. Thurber, P. E. Malin, and K. Aki,
Ob-servations of fault-zone trapped waves excited by explosions at the San Andreas fault, central California,Bull. Seismol. Soc. Am.,87, 210–221, 1997.
Li, Y. G., J. E. Vidale, K. Aki, F. Xu, and T. Burdette, Evidence of shal-low fault zone strengthening after the 1992 M7.5 Landers, California, earthquake,Science,279, 217–219, 1998.
Li, Y. G., J. E. Vidale, S. M. Day, D. D. Oglesby, and E. Cochran, Post-seismic fault healing on the 1999 M7.1 Hector Mine, California earth-quake,Bull. Seismol. Soc. Am.,93, 854–869, 2003.
Li, Y. G., J. E. Vidale, and S. E. Cochran, Low-velocity damaged structure on the San Andreas fault at Parkfield from fault-zone trapped waves,
Geophys. Res. Lett.,31, L12S06, pp. 1–5, 2004.
Li, Y. G., P. Chen, E. S. Cochran, J. E. Vidale, and T. Burdette, Seismic evidence for rock damage and healing on the San Andreas fault asso-ciated with the 2004 M6 Parkfield earthquake, Special issue for Park-field M6 earthquake,Bull. Seismol. Soc. Am.,96, pp. S349–S363, doi: 10.1785/0120050803, 2006.
Lockner, D. A., H. Naka, H. Tanaka, H. Ito, and R. Ikeda, Permeability and strength of core samples from the Nojima fault of the 1995 Kobe earthquake, in Proceedings of the International Workshop on the Nojima Fault Core and Borehole Data Analysis, Tsukuba, Japan, Nov 22–23, 1999, USGS Open file Report 00-129, edited by H. Ito, K. Fujimoto, H. Tanaka, and D. A. Lockner, 147–152, 2000.
Marone, C., The effect of loading rate on static friction and the rate of fault healing during the earthquake cycle,Nature,391, 69–72, 1998. Marone, C., J. E. Vidale, and W. L. Ellsworth, Fault healing inferred from
time dependent variations in source properties of repeating earthquakes,
Geophys. Res. Lett.,22, 3095–3098, 1995.
Massonnet, D., W. Thatcher, and H. Vadon, Detection of postseismic fault-zone collapse following the Landers earthquake,Nature,382, 612–616, 1996.
Mooney, W. D. and A. Ginzburg, Seismic measurements of the internal properties of fault zones,Pure Appl. Geophys.,124, 141–157, 1986. Niu, F. L., P. G. Silver, R. M. Nadeau, and T. V. McEvilly, Stress-induced
migration of seismic scatters associated with 1993 Parkfield aseismic transient event,Nature,426, 544–548, 2003.
Nur, A., Dilatancy, Pore fluid, and premonitory variations of ts/tp travel times,Bull. Seismol. Soc. Am.,62, 1217–1222, 1972.
O’Connell, R. J. and B. Budiansky, Seismic velocities in dry and saturated cracked solids,J. Geophys. Res.,79, 5412–5426, 1974.
Olsen, M., C. H. Scholz, and A. Leger, Healing and sealing of a simulated fault gouge under hydrothermal conditions for fault healing,J. Geophys. Res.,103, 7421–7430, 1998.
Rice, J. R., The mechanics of earthquake rupture, inPhysics of the Earth’s Interior, edited by A. M. Dziewonski and B. Boschi, North-Holland, Amsterdam, pp. 555–649, 1980.
Rice, J. R., Fault stress states, pore pressure distributions, and the weakness of the San Andreas fault, inFault Mechanics and Transport Properties of Rocks, edited by B. Evans and T.-F. Wong, pp. 475–503, Academic, San Diego, Calif., 1992.
Richardson, E. and C. Marone, Effects of normal stress vibrations on frictional healing,J. Geophys. Res.,104, 28,859–28,878, 1999. Rubinstein, J. and G. C. Beroza, Depth constrain on nonlinear strong
ground motion from the 2004 Parkfield earthquake,Seismol. Res. Lett., 32, L14313, doi: 10.1029/2005GL023189, 2005 (submitted). Schaff, D. P. and G. C. Beroza, Coseismic and postseismic velocity
changes measured by repeating earthquakes, J. Geophys. Res.,109, B10302, doi: 10.1029/2004JB003011, 2004.
Scholz, C. H.,The Mechanics of Earthquakes and Faulting, Cambridge
Univ. Press, New York, 1990.
Sibson, R. H., Fault rocks and fault mechanisms,J. Geol. Soc. London, 133, 191–213.
Snieder, R. and M. Vrijlandt, Constraining Relative Source Locations with Coda Wave Interferometry: Theory and Application to Earthquake Dou-blets in the Hayward Fault, California,J. Geophys. Res.,110, B04301, 10.1029/2004JB003317, 2005.
Tadokoro, K., M. Ando, and Y. Umeda (1999). S wave splitting in the af-tershock region of the 1995 Hyogo-ken Nanbu earthquake,J. Geophys. Res.,104, 981–991, 1997.
Thurber, C. H., S. Roecker, W. Ellsworth, Y. Chen, W. Lutter, and R. Sessions, Two-dimensional seismic image of the San Andreas fault in the northern Gabilan Range, central California: Evidence for fluids in the fault zone,Geophys. Res. Lett.,24, 1591–1594, 1997.
Unsworth, M., P. Malin, G. Egbert, and J. Booker, Internal structure of the San Andreas fault at Parkfield, CA,Geology, 356–362, 1997. Vidale, J. E. and Y. G. Li, Damage to the shallow Landers fault from the
nearby Hector Mine earthquake,Nature,421, 524–526, 2003. Vidale, J. E., W. L. Ellsworth, A. Cole, and C. Marone, Rupture variation
with recurrence interval in eighteen cycles of a small earthquake, Na-ture,368, 624–626, 1994.
Yasuhara, H., C. Marone, and D. Ellsworth, Fault zone restrengthening and frictional healing: The role of pressure solution,J. Geophys. Res.,110, B06310, doi:10.1029/2004JB003327, 2005.