Aftershock observation of the Noto Hanto earthquake in 2007
using ocean bottom seismometers
Tomoaki Yamada1, Kimihiro Mochizuki1, Masanao Shinohara1, Toshihiko Kanazawa1,
Asako Kuwano1, Kazuo Nakahigashi1, Ryota Hino2, Kenji Uehira3, Takeo Yagi1,
Naoto Takeda1, and Shinichi Hashimoto1
1Earthquake Research Institute, University of Tokyo, Tokyo 113-0032, Japan 2Graduate School of Science, Tohoku University, Sendai 980-8578, Japan 3Institute of Seismology and Volcanology, Kyushu University, Shimabara 855-0843, Japan
(Received June 30, 2007; Revised February 3, 2008; Accepted February 25, 2008; Online published November 7, 2008)
The Noto Hanto earthquake in 2007 (Mj6.9) occurred on March 25, 2007 near the west coast of the Noto
peninsula, Honshu, Japan. To study the aftershock activity under the sea, we deployed pop-up type ocean bottom seismometers (OBSs) from April 5 to May 8, 2007. We combined data from ten ocean bottom and four onshore seismic stations located around the rupture area of the earthquake and determined the preliminary distribution of the aftershocks. Most of the offshore aftershocks are located in a depth range between 2 and 10 km, and no earthquakes are observed in the lower crust. Hypocenters of deep events occurring at depths greater than 5 km are confined to an area northeastward from the largest aftershock in offshore region. Most of the aftershocks aligned along a high angle and southeast dipping plane, which is consistent with the geometry of the active faults revealed by previous seismic reflection surveys.
Key words:The 2007 Noto Hanto earthquake, OBS, aftershock distribution.
1.
Introduction
A large earthquake occurred at a depth of approximately 10 km near the west coast of the Noto peninsula, Hon-shu, Japan, at 09:42 Japan Standard Time (JST, UT+9) on March 25, 2007 with the Japan Meteorological Agency (JMA) magnitude (Mj) of 6.9. This earthquake, referred to
as the 2007 Noto Hanto earthquake, strongly shock some regions of the Ishikawa prefecture, with a maximum seis-mic intensity of 6 Upper on the JMA scales, one person was killed and more than 350 people were injured as of June 14, 2007 (reported by Fire and Disaster Management Agency, Japan). Small tsunamis were also observed in the Hokuriku region, with a height of 22 cm in Nagahashi, Suzu City and 18 cm in Kanazawa. According to the JMA, this earthquake had a compressional axis on the strike of WNW-ESE, and its focal mechanism is a reverse fault type, which has a slight strike slip component. Many studies show that the rupture area of the earthquake lies under both on-shore and offon-shore regions (e.g. Horikawa, 2007; Tobitaet al., 2007). Many aftershocks occurred following the main-shock, the largest of which occurred at 18:11 on March 25 and at 07:16 on March 26, 2007 (JST) with a magnitude of Mj5.3. The former event occurred at the northeastern
edge, which is in the onshore region, and the latter event was located at the southwestern edge, which is the off-shore region, of the 1-day distribution of the aftershocks until a day after the mainshock. The aftershock activity
be-Copyright cThe Society of Geomagnetism and Earth, Planetary and Space Sci-ences (SGEPSS); The Seismological Society of Japan; The Volcanological Society of Japan; The Geodetic Society of Japan; The Japanese Society for Planetary Sci-ences; TERRAPUB.
came low near the northeastern edge after the largest after-shock in onshore region. In contrast, the afterafter-shock activity progressively spread south-westward from the largest after-shock in the offshore region. Many afterafter-shocks occurred in the offshore region, although dense temporary seismic stations were only deployed on land after the occurrence of the mainshock for estimating the precise aftershock dis-tribution (Sakaiet al., 2008). Moreover, existence of active faults had been known in the offshore region only. Determi-nation of the precise positions of aftershocks is important to study a relation of active fault system and hypocentral dis-tribution of aftershocks. Generally, it is difficult to estimate precise hypocenters, especially the depths of foci, in the ma-rine area from the land seismic network. Therefore, we car-ried out an ocean bottom seismographic observation in a collaborative effort by three universities in Japan to reveal the aftershock activity of the 2007 Noto Hanto earthquake precisely. In this paper, we introduce this offshore observa-tion, present the estimated hypocentral distribution of after-shocks under the sea especially regarding their depth, and discuss seismic activity in relation with foreknown active faults.
2.
Observation
Eleven days after the 2007 Noto Hanto earthquake, we deployed 12 ocean bottom seismometers (OBSs) around the source region using the M/V Fujisan-maru (Dokai Marine Systems Ltd., chartered by Earthquake Research Institute, University of Tokyo) in order to study the aftershock ac-tivity of this event, especially under the marine area. The OBSs used in our observations had been originally
m
Fig. 1. Map showing the location of the seismic stations used in this study in the Hokuriku region, Japan. Crosses indicate the positions of the temporal ocean bottom seismometers (OBSs) and permanent stations of onshore seismometers used in this study. The star denotes the epicenter of the 2007 Noto Hanto earthquake determined by the Japan Meteorological Agency (JMA). The thick broken lines cover the area for relocation in this study. Topographic features are also shown and the contour intervals are 200 m. Insert indicates index map of the study area. The rectangle shows the location of the study area.
oped by Kanazawa and Shiobara (1994) and are equipped with a three-component 4.5-Hz geophones. The seismic waveform data are continuously recorded onto hard-disk units housed in the pressure sphere. The sampling fre-quency and dynamic range of the system were 128 Hz and 16 bit, respectively. The accuracy of the timing is kept within 0.05 s by using a high-precision quartz oscillator that is calibrated against a GPS clock before and after the obser-vation. From May 8, we retrieved ten OBSs using the same vessel though two OBSs could not be recovered. The loca-tions of the OBS recovered and used in this study are shown in Fig. 1 and Table 1. The dimensions of the OBS network are about 15 ×25 km, and the OBS spatial intervals are from 5 to 10 km. The coverage and the intervals were re-stricted by the number of the available OBSs, by requests of commercial fishermen, and by the spacing required for precise determinations of focal depths.
3.
Data and Hypocenter Determination
We combined data from the ten recovered OBSs and four permanent on-land stations installed by the National Research Institute for Earth Science and Disaster Preven-tion (NIED) or Earthquake Research Institute, University of Tokyo (ERI) around the aftershocks area. P- and S -wave arrival times were manually picked using the WIN system (Urabe and Tsukada, 1991). For hypocenter deter-mination, we selected 765 events by the following criteria: (1) those occurred from April 6 to May 8, 2007, (2) their arrival times can be clearly identified on more than nine stations, and (3) their preliminary epicenters determined by the JMA using onshore seismic network are within an area ranging from 37◦N to 37◦20N and 136◦15E to 136◦37.5E. We employed a joint hypocenter determination (JHD) tech-nique (Kisslinget al., 1994) in order to simultaneously
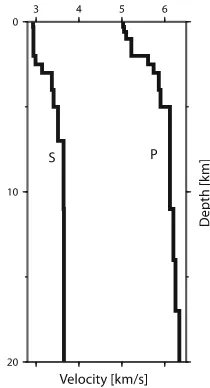
de-Fig. 2. One-dimensional velocity models of theP- andS-waves from 0 to 20 km depth. The velocity models were obtained by the simultaneous inversion.
Fig. 3. Travel-time corrections for the P- andS-waves derived from the JHD relocations. (a) P-wave (b) S-wave. The circles indicate the positive residuals, while the crosses denote the negative residuals. Reference sizes are also shown.
termine the hypocenter parameters, the one-dimensionalP -andS-wave velocity models (Fig. 2), and the station cor-rections for the P- and S- arrival times at the 14 stations (Fig. 3). The initial velocity parameters are based on the ve-locity model by Mikumoet al.(1998), and the initial values of the hypocenters are determined by using the initial ve-locity model and the maximum-likelihood estimation tech-nique of Hirata and Matsu’ura (1987). After the application of JHD,VpandVsare well resolved down to 10 km, and the root-mean-square (RMS) of the travel time residuals was re-duced from 0.159 s to 0.084 s.
4.
Results
Staton Latitude Longitude Altitude (m) Period
Fig. 4. Distribution of the relocated hypocenters from April 6 to May 8, 2007 using both onshore and offshore seismic data. Size of circles correspond to the magnitude determined by the JMA. Crosses indicate the positions of seismic stations. Focal depths are color-coded.
directions. Most of aftershock clusters have focal depths of 2–5 km, but focal depths of the events in a northern cluster centered at 37◦19N, 136◦38E are especially shallow (0– 2 km). There are a few aftershocks at a depth shallower than 2 km in the whole OBS observation area, except for the northern cluster. Furthermore, no aftershock was de-termined at a depth deeper than 15 km. Earthquakes were observed only in the upper crust.
5.
Discussion
The hypocenter determined by the OBS and land sta-tion network can correspond to those determined from the data of the land seismic network by the JMA. We compare our results to those determined by the JMA for examining the differences of foci included in the OBS network or not
136.2 136.4 136.6 136.8 137.0 0
Fig. 5. Comparison between the hypocenters determined by the JMA (green circles) and those determined in this study (red circles). The dark and light blue crosses indicate positions of the OBSs and the onshore seismometers, respectively. Vertical section along the longitude is shown at bottom of figure. An oblique section in the middle denotes the vertical section along the NE-SW direction which is parallel to the rupture of the 2007 Noto Hanto earthquake.
Fig. 6. Comparison between surface traces of active faults revealed by a previous marine survey (Katagawaet al., 2005; Okamura, 2008) and the hypocenter distribution, which is a combined result by a temporal land seismic network (Sakaiet al., 2008) and our results. Size of circles corresponds to magnitude, and focal depths are distinguished by a color code. Crosses indicate positions of seismic stations. Upper: Distribution of epicenters of the aftershocks. Black lines named as F14, F15, F16 show active faults by Katagawaet al.(2005), and pink line shows active faults by Okamura (2008). Open and solid black stars indicate epicenter of the mainshock and a largest aftershock in onshore region determined by Sakaiet al.(2008), respectively. Blue star denotes relocated the epicenter of the largest aftershock in offshore region. Lower: Depth distributions of the hypocenters in the rectangles in the upper figure. Brown and red inverted triangles indicate seafloor positions of active faults by Katagawaet al.(2005) and Okamura (2008), respectively.
correlation also seems between the hypocenters determined by a dense on-land seismic array (Sakaiet al., 2008) and our hypocenters. Therefore, the differences in hypocenter loca-tions are mainly ascribed to the difference in spatial cov-erage of the seismic networks. From the point of view of spatial coverage, the OBS and on-land dense seismic net-works are considered to have better controls on hypocenter determination of offshore and onshore aftershocks, respec-tively. For further discussion, we refer to the hypocenters in the onshore region determined by the dense on-land seis-mic network (Sakaiet al., 2008) and our hypocenters in the marine area (Fig. 6).
The location of the largest aftershock in marine area is also shown in Fig. 6. It is relocated using a relative method (Yamada et al., 1997) because the OBS observation had been not started yet when the event occurred. First, we
se-lected aftershocks close to the largest one using travel time differences among land seismic stations and then fixed the locations of the selected aftershocks based on our determi-nation using OBS data. Second, we compared travel time differences of the fixed events with those of the largest one for hypocentral determination. The estimated hypocenter has a depth of 6 km and the epicenter is located at a bound-ary zone of the aftershock distribution, especially in terms of focal depth.
mecha-nism solution of the main shock by the JMA. Also note that OBS data show just the same dip angle of the flat plane in offshore region close to the coast line although a dip angle of the offshore aftershock distribution seems to change with depth from the land observation. These are approximately consistent with the geometry of distribution of aftershocks determined by a 3-dimensional tomography method on land (Katoet al., 2008).
On the contrary, aftershocks at the southwest side from the largest one are only distributed in a shallow zone as 2– 5 km (Fig. 6(a), (b) and (c)). The distribution has some gaps and each cluster seems to have a southeast dipping plane, though it is not so distinct. Moreover, these southwestern activities started after the largest aftershock although the northeastern activity had started immediately after the main shock (Sakaiet al., 2008). These results lead us to conclude that the southeast dipping plane of the northeastern distribu-tion represents a source fault plane of the main shock and that the southwestern events are activated after the main ac-tivity of the northeastward.
We will now take a look at relations between active faults and seismic activity. Previous offshore seismic re-flection surveys revealed southeast-dipping reverse faults trending NE-SW in the west of the Noto Peninsula (Kata-gawa et al., 2005; Okamura, 2008). There are some off-shore active faults documented by sonic reflection surveys as above, while only geological faults are known onshore in the source region of the present event. It is one of the most important questions to be answered: if any known active fault is responsible for the 2007 Noto Hanto earthquake or not.
We compare the active faults to aftershocks (Fig. 6). Fig-ure 6 clearly indicates that offshore aftershocks, especially eastward from the largest aftershock, are distributed around the deeper extension of seafloor traces of active faults F14, F15 and F16 described in Katagawaet al. (2005), which is estimated to dip southeastward. This strongly suggests that the offshore active faults off the west coast of the Noto peninsula are responsible for the generation of the 2007 event although aftershocks did not occurred at a very shal-low zone, such as 0–2 km. In the area southwest from the largest aftershock, aftershocks seem to distribute at exten-sion of an active fault Fg by Okamura (2008) (Fig. 6(b) and (c)).
The dip angle is lower than one of the northeastern events if the southwestern aftershocks represent the fault plane, Fg. It should be noted, however, that there is a possibility of apparent low in a dip angle because we can also inter-pret that aftershocks occurred on unknown faults which are different strikes. A high-dense offshore reflection survey was conducted after the OBS observation, and the results would clarify fault distribution. It calls for a more detailed comparison analysis between such a detailed fault map and aftershocks to determine which faults have broken, and it remains as a matter for further study.
6.
Conclusions
In order to obtain a more precise offshore aftershock dis-tribution, especially regarding with their depths, of the 2007 Noto Hanto earthquake, 12 OBSs were deployed on April
5, and ten OBSs were retrieved on May 8. We combined data from the OBSs data with those from the permanent stations on land around the aftershock area and relocated aftershocks using the JHD technique. Most of the after-shocks are located at depths ranging from 2 to 10 km in the offshore region, and no earthquakes are observed in the lower crust. Upper limits of the depths are approximately the same, however lower limits vary along the strike of the mainshock. The changes of the lower limit correspond with the largest aftershock located near the southwestern edge of the rupture area of the mainshock dramatically. The lower limit of the southwestern side from the largest one is shal-lower than that of the northeasetern side. The aftershocks located northeastward from the largest one distribute along a southeast dipping NE-SW plane that approximately corre-sponds with the rupture area of the 2007 Noto Hanto earth-quake. The aftershock distribution is in remarkable agree-ment with configurations of the foreknown active faults.
Acknowledgments. We would like to express our gratitude to
Mr. I. Ogino for his help with the preparation for the OBS ob-servation. The skillful work of the officers and crews of the M/V Fujisan-maru is appreciated. Ishikawa Prefectural of Fisheries Co-operative Associations, Prefectural office of Ishikawa, and Mr. M. Nagata of the Ministry of Education, Culture, Sports, Science and Technology (MEXT) cooperated with the OBS observation. The group for the aftershock observations of the 2007 Noto Hanto earthquake provided us information of hypocenters determined by their urgent land seismic network data. We used seismic data from ERI and NIED, information of hypocenters located by JMA, and focal solutions determined by F-net, NIED. This study is sup-ported by the Grant-in-Aid for Special Purposes (No. 19900001), MEXT, Japan. The work is also conducted as a part of the 2nd new program of research and observation for earthquake predic-tion (2004 to 2008). Comments by reviewers (Dr. S. Kodaira and Dr. Y. Murai) helped us improve the manuscript. Most of the fig-ures were created using GMT (Wessel and Smith, 1995).
References
Hirata, N. and M. Matsu’ura, Maximum-likelihood estimation of hypocen-ter with origin time eliminated using nolinear inversion technique,Phys. Earth Planet. Inter.,47, 50–61, 1987.
Horikawa, H., Source process of the 2007 Noto-Hanto earthquake (M6.9), Abstr. Japan Geoscience Union Meet., Z255-P008, 2007.
Kanazawa, T. and H. Shiobara, Newly developed ocean-bottom seismome-ter, Abstr. Japan Earth Planet. Sci. Joint Meet., I11-P82, 1994 (in Japanese).
Katagawa, H., M. Hamada, S. Yoshida, H. Kadosawa, A. Mitsuhashi, Y. Kono, and Y. Kinugasa, Geological development of the west sea area of the Noto Peninsula district in the Neogene Tertiary to Quaternary, central Japan,J. Geogr.,114, 791–810, 2005 (in Japanese with English abstract).
Kato, A., S. Sakai, T. Iidaka, T. Iwasaki, E. Kurashimo, T. Igarashi, N. Hirata, T. Kanazawa, and Group for the aftershock observations of the 2007 Noto Hanto Earthquake, Three-dimensional velocity structure in the source region of the Noto Hanto Earthquake in 2007 imaged by a dense seismic observation,Earth Planets Space,60, 105–110, 2008. Kissling, E., W. L. Ellsworth, D. Eberhart-Phillips, and U. Kradolfer,
Ini-tial reference models in local earthquake tomography,J. Geophys. Res., 99, 19635–19646, 1994.
Mikumo, T., H. Wada, and M. koizumi, Seismotectonics of the Hida re-gion, central Honshu, Japan,Tectonophysics,147, 95–119, 1998. Okamura, Y.,Geological Map West of Noto Peninsula, Geological Survey
of Japan, Tsukuba, 2008 (in press).
Tobita, M., S. Ozawa, T. Nishimura, H. Yarai, H. Suito, M. Murakami, H. Une, A. Yamada, K. Takano, T. Yutsudo, M. Ishimoto, N. Ishikura, S. Kawamoto, and T. Amagai, Crustal Deformation and Fault Model of The Noto Hanto Earthquake in 2007,Abstr. Japan Geoscience Union Meet., Z255-P018, 2007.
Urabe, T. and S. Tsukada, A workstation-assisted processing system for waveforme data from microearthquake network,Abstracts of Spring Meeting of Seismological Society of Japan, p. 70, 1991 (in Japanese). Wessel, P. and W. H. F. Smith, New version of generic mapping tools
released,EOS Trans. AGU,76, 329–336, 1995.
Yamada, T., T. Kanazawa, and S. Tsukada, Hypocenter determination by routine network using results of high-density temporal observation, Ab-str. Japan Earth and Planetary Science Joint Meet., B22-P20, 1997 (in Japanese).