ADSORPTION OF FLUORIDE FROM INDUSTRIAL WASTEWATER IN FIXED BED COLUMN
USING JAVA PLUM (SYZYGIUM CUMINI)
TEJ PRATAP SINGH
1, SANJAY GHOSH
2, MAJUMDER CB
1*
1Department of Chemical Engineering, IIT Roorkee, Roorkee - 247 667, Uttarakhand, India. 2Department of Biotechnology, IIT Roorkee - 247667, Uttarakhand, India. Email: cbmajumder@gmail.com
Received: 05 May 2016, Revised and Accepted: 16 September 2016
ABSTRACT
Objective: The quality of drinking water is important for public safety and quality of life. Thus, providing every person on earth safe drinking water seems to be the biggest challenge in front of mankind. For this purpose, here we have investigated the fluoride removal capacity of java plum. Methods: In this study, removal of fluoride from industrial wastewater using fixed-bed reactor adsorption techniques by java plum seed (Syzygium cumini) was investigated. Fixed-bed column experiments were carried out for different bed depths, influent fluoride concentrations, and various flow rates. The Thomas model and bed depth service time model were applied to the experimental results. Both model predictions verify the experimental data for all the process parameters studied, indicating that the models were suitable for java plum (S. cumini) seeds (Biosorbent) fix-bed column design.
Results: The empty bed residence time (EBRT) model optimizes the EBRT, and the Thomas model showed that the adsorption capacity is strongly dependent on the flow rate, initial fluoride concentration, and bed depth and is greater under conditions of a lower concentration of fluoride, lower flow rate, and higher bed depth.
Conclusion: The experimental results were encouraging and indicate that java plum (S. cumini) seed is a feasible option to use as a biosorbent to remove fluoride in a fixed bed adsorption process.
Keywords: Adsorption, Column experiment, Thomas model, Empty bed residence time, Java plum.
INTRODUCTION
According to a report of 2013, 1 in every 9 people (approximately 783 million) lack access to safe water. Furtermore, more than 6-8 million people die from a disaster or water related disease [1]. Fluoride contamination in drinking water due to natural and anthropogenic activities has been recognized as one of the major problems worldwide imposing serious threat to human health. A maximum of 1.5 mg fluoride is permitted by WHO in 1 L of water [2]. Fluoride concentration in drinking water above 1.5 mg/L may cause serious harms to human health.
More than 200 million people in 29 counties are suffering from fluoride contamination of groundwater. Some of the countries in which fluoride contamination of groundwater have been significant include India, Argentina, and Ethiopia [3,4]. Widespread occurrence of fluoride above the prescribed limit in groundwater meant for human consumption has caused multidimensional health problems, most common being dental fluorosis, and skeletal fluorosis [5,6]. Maximum permissible amount of fluoride by various organizations worldwide has been reported in Table 1 [7].
A report published by Rajiv Gandhi National Drinking Water Mission in 1983 identified 15 states including Delhi as endemic for fluorosis. Table 2 depicts states which are presently, endemic for fluorosis [8].
Problem of fluorosis is increasing day by day as fluoride level is gradually getting higher than the prescribed maximum desirable limits. The fluoride level in water in India ranges from 2 to 29 ppm, whereas the permissible level in drinking water according to WHO standard is 1.0-1.5 ppm. In tropical countries, skeletal fluorosis occurs even with drinking low level of fluoride. Epidemiological observation revealed
absorption, fluoride ion is quickly distributed throughout the body, easily crossing the membranes, and going into tissues. It accumulates in body due to the high reactivity of fluoride ion with calcium of teeth and bones. It forms calcium fluorophosphates (fluorapatite) crystal and leaves unbound calcium in the same tissue, which gets calcified and in turn results in stiffness of tissues and joints. This finally leads to skeletal fluorosis in a later stage. That’s why fluoride is called as bone-seeking mineral and bones as sink for fluoride. About 90% of the fluoride retrieved in body is associated with calcified tissues.
Several defluoridation methods proposed and tested worldwide are mostly based on the principles of precipitation [9], adsorption [10-12], and ion exchange [13]. However, the defluoridation methods developed so far lack viability at the end-user level due to one or more reasons such as high-cost technology, limited efficiency, unnoticeable break through, deteriorated water quality, and taboo limitations [14]. These methods involve the use of alum, lime, aluminum sulfate, gypsum-fluorite filters, magnesite, dolomite, poly aluminum chloride, granulated bone media, bone charcoal, and activated carbon, and activated alumina, superphosphate, and tri-calcium phosphate [15,16]. Among above-mentioned methods, adsorption is one of the most economically feasible techniques used for water defluoridation. In this paper, we have studied the adsorption of fluoride in fixed bed column using java plum (Syzygium cumini) as previously in several literatures java plum had been used as biosorbent for several harmful contaminants [17,18]. Here, a fixed bed column has been used specifically because their residence time distribution studies proved them to be a good model for adsorption [18]. This paper basically represents the study of the defluoridation capacity of the java plum seed.
METHODS
Research Article
washed three times from the tap water to remove the dust. Java plum (S. cumini) seed was primarily dried in the sunlight for 2 days and then dried in hot air oven in the range of 80-100°C for 36 hrs. The material is subsequently placed in an airtight container for further use.
Column adsorption experimental
This experiment was carried out in a reactor column of SS pipe with an objective to remove fluoride from wastewater. The schematics diagram of the experimental setup was shown in Fig. 1. SS pipe column of various length (Z1=20, Z2=40, Z3=60, Z4=80 and Z5=100 cm) and 8.5 cm internal
diameter were used while the height of reactor was 100 cm and net volume 5.03 L. It was equipped with a total of four equidistant ports (excluding inlet and outlet) of 1.25 cm diameter for collecting liquid sample along the height of reactor. The top and bottom portion were connected with the main column by two flange joints, supported on SS screen (mesh no: 16 BSS, width aperture: 1.00 mm). The reactor is filled with weighted amount of java plum (S. cumini) seeds (biosorbent) having a particle size of 2-4 mm as a fixed-bed absorber. The bed was supported and closed by cotton pad and rubber, respectively, to prevent the flow
of adsorbent together with the effluent. Then, the bed was rinsed with distilled water and left overnight to ensure a closely packed arrangement of a particle without voids, channels, or cracks. Synthetic fluoride solution of known concentration (20 mg/L) was fed through a bed of java plum (S. cumini) seeds in up-flow mode to avoid channeling due to gravity and to ensure a uniform distribution of the effluent thought out the column. The experiments were carried out at room temperature. A peristaltic pump was used to control the flow rates (12, 23 and 40 ml/min) and maintained constant during each experiment. Periodic flow rate check carried out by collecting sample at the effluent for a given time and measured using measuring cylinder. A sample of effluent was collected at 1 hr interval and analyzed by spectrophotometric (SPADNS) method for fluoride ion concentration using ultraviolet spectrophotometer (Hach, DR 5000). The volume of treated water was measured at 1 hr interval, and the average flow rate was calculated based on these values because the flow rate becomes unstable as the bed depth is high due to a higher flow resistance. The desired breakthrough concentration (Cb) was determined
at 7.5% of the initial concentrations (20 mg/L). Table 3 shows various features and measurements of reactor used in this study.
Mathematical modeling Thomas model
Thomas model was one of the most general and widely used models in the column performance theory. Thomas model was based on the assumption that the process follows Langmuir kinetics of adsorption-desorption with no axial dispersion. The prediction of column adsorption process requires prediction of breakthrough curves for the effluent. The maximum adsorption capacity of an adsorbent is also required in the design of column. The mathematical representation for a fixed bed column with ideal break through curve can be expressed as follows [19,20]:
C
The linearized form of the column,
ln C
C0: Initial solute concentration (mg/L),
Ct: Solute concentration at time, t, (mg/L),
Qv: Volumetric flow rate (ml/min),
q0: Maximum solid phase concentration of solute (maximum column
adsorption capacity) (mg/g), kT: Thomas rate constant (L/min mg);
V: Throughput volume (L), m: Mass of adsorbent (g).
kT and q0 can be determined from the slope and the intercept of the
linear plot of ln[(C0/Ct)−1] verse V, respectively.
Thomas model was based on the following assumptions: i. Langmuir kinetics of the adsorption-desorption;
ii. No axial dispersion which was derived with the assumption that the rate driving force obeys second-order reversible reaction kinetics Table 1: Permissible limit of fluoride in drinking water
prescribed by various organizations
Organization Maximum permissible
limit of fluoride ions International standard for drinking water 0.5
U.S. Public Health Standard 0.8
The committee on public health engineering manual and code of practice, Govt. of India
1.0
Indian Council of Medical Research
recommendation 1.0
ISI recommendation 1.5
WHO Guidelines 1.5
Bureau of Indian Standard 1.2
Table 2: Summarized information on the occurrence of excessive fluoride in ground water in India
State Number of habitation with excess fluoride State Number of habitation with excess of fluoride
Andhra Pradesh 7548 Madhya Pradesh 201
Gujarat 2378 Orissa 1138
Karnataka 860 Punjab 700
Kerala 287 Rajasthan 16,560
Meghalaya 33 Tamil Nadu 527
Haryana 334 Uttar Pradesh 1072
Himachal Pradesh 488 West Bengal 21
iii. A constant separation factor;
iv. It was applicable to either favorable or unfavorable isotherms.
The main weakness of the Thomas solution was that its derivation was based on second-order reaction kinetics. Adsorption was usually not limited by chemical reaction kinetics but was controlled by inter-phase mass transfer [21,22].
The empty bed residence time model (EBRT)
The EBRT was a design producer for the design of an absorber. Major design parameters were:
i. EBRT or empty bed contact time (EBCT) ii. Adsorbent exhaustion rate.
These parameters can be correlated for a fixed bed column to determine the operating and capital costs of adsorption system [23,24] had been reported that EBCT was a critical parameter in the adsorption processes especially if the adsorption mainly depends on the contact time between the adsorbent and adsorbate.
The EBRT is defined as the time required for the liquid to fill the empty column and it determines the residence time during which the solution treated become constant with the adsorbent:
EBRT(minute Bed volume
Volumetricflow rateof theliquid
)= (3)
The adsorbent exhaustion rate is the mass of the adsorbent used per volume of liquid treated at the breakthrough:
Adsorbent exhaustion rate(g/L) = Mass of adosrbent used Volume of lliquid treated at breakthrough (4)
The adsorbent exhaustion rates were plotted against the EBRT values, and a single operating line could be constructed to correlate these two variables. Thus, to select the optimum combination of adsorbent exhaustion rate and the liquid retention time, the operating line should first be established.
The Equations (3,4) revealed that with the lower adsorbent exhaustion rate,volume treated at the breakthrough point became larger, and hence, longer EBRT and smaller amount of adsorbent was needed per unit volume of feed treated which implied a lower operating cost; however, larger column would be used. On the other hand, the higher the adsorbent exhaustion rate, the smaller the EBRT, the higher the operating cost, and smaller column were needed which would reduce the construction cost.
RESULTS
Fixed-bed design models
The bed depth service time model (BDST), the EBRT model and the Thomas model were selected for this study which was used to predict, optimize and describe the fixed-bed column operation, respectively.
BDST model
Fig. 2 showed the BDST plots (Tb versus D), which was constructed from
Table 4 for the influent fluoride concentration of 20 mg/L and flow rates of 12, 23 and 40 ml/min at 7.5% breakthrough time for 20, 40, 60 and 100 cm bed heights. The coefficients N0 and K for the three flow
rates were calculated based on equation:
T N D
Tb: Service at breakthrough point (h),
N0: Bed capacity (mg cm3),
D: Packed-bed column depth (cm), v: Linear flow rate through the bed (cm/h), C0: Influent fluoride concentration (mg/L),
Cb: Breakthrough fluoride concentration (mg/L),
K: Adsorption rate constant (L/mgh).
The equation of a straight line on BDST curve could be expressed as y = ax + b;
ln ,the adsorptive capacity of the system, N0 and the
rate constant, K, could be evaluated from the slope and intercept of a straight line plotted as the service time against the bed depth from experimental data, respectively. The minimum bed depth (Dmin) which
represented the theoretical depth of adsorbent able to prevent the adsorbent concentration from exceeding Cb, was obtained when Tb=0,
according to the following equation:
D the performance of the bed if there was change in the initial solute concentration C01 to a new C02. Hutchins proposed that the new slope a2
and new intercept b2 could be estimated by equation [25].
a a C
McKay stated that if design data were required for a change in volumetric flow rate of solute to the some adsorption system, the new slope with the intercept remaining unchanged could be written as [25].
a a Q
Table 3: Salient feature of column reactor
S. No. Description Value
1 Diameter of reactor (cm) 8.0
2 Total height of reactor (cm) 100
3 Volume of reactor (L) 5.03
4 Number of sampling points 5.0
5 Height of sampling point (cm) 100
6 Diameter of sampling point (cm) 1.25
7 Total weight of absorbent (g) 2420
8 Density of bed (g/ml) 0.7166
Effect of bed depth
The adsorption of fluoride onto java plum (S. cumini) seeds was presented in the form of breakthrough curves where the concentration ratio Ct/Co
was plotted against time (h). Figs. 3-5 showed the breakthrough curves of fluoride adsorption onto java plum (S cumini) seeds at different bed depth (20, 40, 60, and 100 cm) and at a constant flow rate of 12, 23 and 40 ml/min. The result indicated that breakthrough volume Vb
and breakthrough time Tb increases with increasing bed depth.The
breakthrough time Tb was directly related with D according to the
equation T =N DC V
KC C
C
b 0 0
0 b
−
−
1
1
0
ln , thus as bed depth increased
the breakthrough time also increased which in turn lead to an increase in treated volume (Vb). When the bed depth increases, the adsorption
performance increases due to increase in adsorption mass which provided greater adsorption site.
The breakthrough curve indicated in Fig. 3 showed that at lower bed depths, the shape of the curve does not show the characteristic S-shape profile produced in ideal adsorption systems, but exclusively for the 100 cm column the shape in approaching S-shape curve. Increasing bed depth increases the EBRT from 106.03 to 530.04 for 12 ml/min flow rate, and similar trends were also followed with other flow rates.
Fig. 2: Bed depth service time plot at 7.5% breakthrough in a fixed-bed column at different flow rates
Fig. 3: Effect of bed depth on breakthrough time at a constant flow rate of 23 ml/min (C0=20 mg/L)
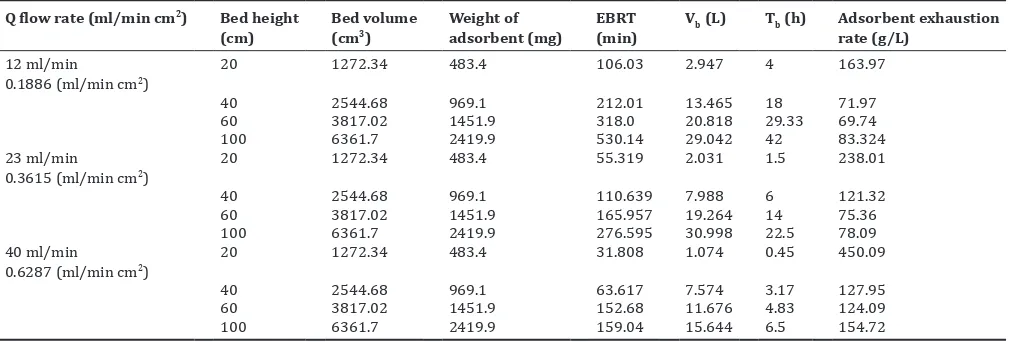
Table 4: Data of variable bed depth at a fixed flow rate in a fixed-bed column for the removal of 20 mg/L of fluoride by java plum (S. cumini) seeds (Biosorbent)
Q flow rate (ml/min cm2) Bed height
(cm) Bed volume (cm3) Weight of adsorbent (mg) (min)EBRT Vb (L) Tb (h) Adsorbent exhaustion rate (g/L) 12 ml/min
0.1886 (ml/min cm2) 20 1272.34 483.4 106.03 2.947 4 163.97
40 2544.68 969.1 212.01 13.465 18 71.97
60 3817.02 1451.9 318.0 20.818 29.33 69.74
100 6361.7 2419.9 530.14 29.042 42 83.324
23 ml/min
0.3615 (ml/min cm2) 20 1272.34 483.4 55.319 2.031 1.5 238.01
40 2544.68 969.1 110.639 7.988 6 121.32
60 3817.02 1451.9 165.957 19.264 14 75.36
100 6361.7 2419.9 276.595 30.998 22.5 78.09
40 ml/min
0.6287 (ml/min cm2) 20 1272.34 483.4 31.808 1.074 0.45 450.09
40 2544.68 969.1 63.617 7.574 3.17 127.95
60 3817.02 1451.9 152.68 11.676 4.83 124.09
100 6361.7 2419.9 159.04 15.644 6.5 154.72
EBRT: Empty bed residence time, S. cumini: Syzygium cumini
Fig. 4: Effect of bed depth on breakthrough time at a constant flow rate of 12 ml/min (C0=20 mg/L)
Effect of flow rate
Fig. 6 shows that the influence of rate on the time of breakthrough at fixed-bed depth of 100 cm. An increase in flow rate from 23 to 40 ml/min reduces the volume of treated at the breakthrough and therefore decreased the service time of the bed. As could be seen from Table 4, 30.998 L of water was treated at a flow rate of 23 ml/min while 15.644 L was treated at a flow rate of 40 ml/min and the breakthrough time also reduced from 22.5 to 6.5 h for 23 and 40 ml/minflow rates, respectively. This was due to the decrease in contact time between the fluoride and adsorbent at
higher flow rate. As the adsorption rate was controlled by intraparticle diffusion, an early breakthrough occurs leading to a low bed adsorption capacity [26]. When the flow rate decreased, the contact time in the column was longer, and intra-particle diffusion then became effective. Thus, the adsorbate would have more time to diffuse into the particles of the adsorbent and a better adsorption capacity was obtained. The slope of the BDST plot would be higher for smaller flow rates.
Effect of EBCT
Fig. 7 as a plot of the adsorbent exhaustion rate against EBRT at various adsorbent bed height such as 20, 40, 60, and 100 cm. It could be seen from Fig. 7 that adsorbent exhaustion rate decreased with increasing EBRT. As shown in Table 5, the data of variable bed depth (20, 40, 60, and 100 cm) at a different flow rate (12, 23, and 40 ml/min) in a column reactor for the removal of fluoride. The data in Table 5 showed that EBRT, Vb and Tb increased with increasing bed depth. It was clear that
when the EBRT increase with a flow rate, the bed volume would have to be longer, thus allowing more solution to be treated but resulting in a lower adsorbent exhaustion rate.
Thomas model
The data collected from continuous flow mode studies was used to determine the kinetic parameters using the Thomas model which was widely used for column studies. The Thomas model was used in describing the adsorbtion kinetics and evaluating the maximum solid phase concentration (q0) and the rate constant (kT). The linearized Thomas
model plot was shown in Figs. 8-11. From the plot, the rate constant kT and
the maximum solid phase concentration of the solute qo were collected,
and Table 6 shows summary of the linearized Thomas model parameters.
Characterization of java plum (S. cumini) Scanning electron micrograph (SEM)
The surface morphology of the java plum (S. cumini) examined by SEM Fig. 12a and b showed the SEM of java plum (S. cumini) adsorbent used for adsorption studies. It was revealed from these Figs. 12a and b that this adsorbent had irregular and porous surface. Difference in the adsorbent capacity of adsorbent was mainly due to the difference in their surface porosity.
Energy dispersive x-ray analysis (EDAX)
EDAX of java plum (S. cumini) before and after adsorption of fluoride ions were shown in Fig. 13a and b. From Figs. 13a and b, it was clear Fig. 6: Effect of flow rate on breakthrough time in a 100 cm fixed
bed column; (a) 40, (b) 23, (c) 12 ml/min (C0=20 mg/L)
Table 5: Constant of BDST curve
Q flow rate (ml/min cm2 ) V (cm/h) Slope Intercept Depth
D (cm) N0 (mg/cm
3) K (L/mg h) ×10−3 X (mg/g)
0.1886 11.316 0.464 −2.29 4.963 0.105012 54.8479 0.358
0.3615 21.69 0.268 −3.771 14.071 0.11625 33.307 0.382
0.6287 37.722 0.072 −0.248 3.445 0.0543 506.45 0.1929
BDST: Bed depth service time
Fig. 7: Adsorbent exhaustion rate versus empty bed residence time
Table 6: Linearized Thomas model parameter at 7.5% breakthrough
D (cm), C0 (mg/L), Q (ml/min) KT (L/mg min)×10−3 Q
0 (mg/g) R2 Equation of line
20, 20, 12 0.257 0.596 0.884 Y=−0.428x+3.83
40, 20, 12 0.088 0.999 0.968 Y=−0.148x+4.399
60, 20, 12 0.120 2.476 0.874 Y=−0.170x+6.314
100, 20, 12 0.083 3.116 0.917 Y=−0.138x+6.44
20, 20, 23 0.124 1.654 0.888 Y=−0.108x+2.680
40, 20, 23 0.117 1.214 0.918 Y=−0.102x+3.715
60, 20, 23 0.136 0.893 0.990 Y=−0.118x+4.746
100, 20, 23 0.156 0.678 0.993 Y=−0.136x+6.923
20, 20, 40 0.81 0.483 0.993 Y=−0.405x+2.936
40, 20, 40 0.222 1.33 0.956 Y=−0.222x+4.431
60, 20, 40 0.312 0.6013 0.983 Y=−0.156x+4.221
that various elements such as carbon, oxygen and very small amount of calcium were present in virgin adsorbent but fluoride was not present there. When the EDAX of the adsorbent was carried out after the adsorption of fluorides ion, fluoride was present on the surface of adsorbent about 0.62 wt.% which confirmed the adsorption of fluoride by this adsorbent.
Fourier transform infrared (FTIR)
Functional groups present in biosorbent before and after adsorption was determined using FTIR spectroscopy (Thermo Nicolet, Magna 7600). The samples were prepared by pellet (pressed disk) method Fig. 8: Linearized Thomas model plot at 7.5% breakthrough for adsorption of 20 mg/L fluoride solution with 12 ml/min flow rate
at a different bed depths
Fig. 9: Linearized Thomas model plot at 7.5% breakthrough for adsorption of 20 mg/L fluoride solution with 23 ml/min flow rate
at a different bed depths
Fig. 10: Linearized Thomas model plot at 7.5% breakthrough for adsorption of 20 mg/L fluoride solution with 40 ml/min. flow
rate at a different bed depths
Fig. 11: Linearized Thomas model plot at 7.5% breakthrough for adsorption of 20 mg/L fluoride solution with 23 ml/min flow rate
at a bed depth of 100 cm
by mixing same amount of KBr in each sample. The selected spectral range was from 4000 to 400 (1/cm). Functional groups present on the surface of the peels were determined by the FTIR spectroscopy method. Fig. 14a and b showed FTIR spectra of biosorbent, on the surface of adsorbent many functional groups were present (Table 7).
The range of different wave number assign the functional groups present in the adsorbent. The amine bond stretching lie in the wave range of 3400-3500, similarly for the very broad OH (2500-3300), NH2
Scissoring stretching (1550-1650), alkanes (1370-1390), alcohols, and phenols ion stretching (970-1250).
CONCLUSION
In this study, we investigated the possibility of using java plum (S. cumini) seed for adsorbtion of fluoride in a packed bed column. The experimental results were encouraging and indicate that java plum (S. cumini) seed was a feasible option to use as a bio-adsorbent to remove fluoride in a fixed bed adsorption process.
Treated volume of water depends on column operating variables such as bed depth, concentration and flow rate and changing them could change treated volume. It was observed that if bed depth is lowered or anyone among flow rate and influent concentration was increased, a decrease in treated volume was noted. This decrease in treated volume further decreases the service time of the bed.
The BDST model was successfully applied to analyze the column performance and to evaluate the model parameter. The BDST equations of linear relationship between the bed depth and the service time were obtained with R2=0.961, 0.984 and 0.919 for 12, 23 and 40 ml/min flow
rate, respectively.
The EBRT model which optimizes the EBRT and the sorbent utilization rate was successfully applied with optimum contact time greater than about 159.04, 276.59 and 530.14 min for 40, 23 and 12 ml/min flow rates, Fig. 12: Scanning electron micrograph micrograph of java plum (Syzygium cumini) seeds: (a) Before biosorption process, (b) after
biosorption process
respectively, with the corresponding usage rate of 154.72, 78.09 and 83.32 g/L. The optimum dose for batch system was 3.9 g/50 ml.
The application of Thomas model has shown that the adsorption capacity was strongly dependent on the flow rate, initial fluoride concentration, and bed depth and was greater under conditions of a lower concentration of fluoride, lower flow rate, and higher bed depth. Moreover, the Thomas rate constant decrease with increasing bed depth, decreasing initial concentration, and flow rate.
REFERENCES
1. Available from: http://www.unwater.org/water-cooperation-2013/en/. 2. WHO. Guidelines for Drinking Water Quality. Geneva: World Health
Organization; 1984.
3. Jha SK, Nayak AK, Sharma YK. Fluoride occurrence and assessment of exposure dose of fluoride in shallow aquifers of Makur, Unnao district Uttar Pradesh, India. Environ Monit Assess 2009;156(1-4):561-6. 4. Rosso JJ, Puntoriero ML, Troncoso JJ, Volpedo AV, Fernández Cirelli A.
Occurrence of fluoride in arsenic-rich surface waters: A case study in the Pampa Plain, Argentina. Bull Environ Contam Toxicol 2011;87(4):409-13.
Table 7: FTIR analysis for java plum (S. cumini) adsorbent in tabular form
Wave number (1/cm) 3400-3500 2500-3300 1550-1650 1370-1390 970-1250
Compound Amines Carboxylic acids
and derivatives Amines Alkanes Alcohols and phenols
Groups N-H (1° amines), 2 bands O-H (very Broad) NH2 Scissoring
(1° amines) CH2 and CH3 deformation C-O FTIR: Fourier transform infrared
5. World Health Organization. Guidelines for Drinking-Water Quality: Incorporating First Addendum Recommendations. Vol. 1. Geneva, Switzerland: WHO; 2006. p. 375-6.
6. Ortiz-Pérez D, Rodríguez-Martínez M, Martínez F, Borja-Aburto VH, Castelo J, Grimaldo JI, et al. Fluoride-induced disruption of reproductive hormones in men. Environ Res 2003;93(1):20-30.
7. Malay DK, Salim AJ. Comparative study of batch adsorption of fluoride using commercial and natural adsorbent. Res J Chem Sci 2011;1(7):68-75.
8. Reardon EJ, Wang YX. A limestone reactor for fluoride removal from wastewaters. Environ Sci Technol 2000;34:3247-53.
9. Liao XP, Shi B. Adsorption of fluoride on zirconium(IV)-impregnated collagen fiber. Environ Sci Technol 2005;39(12):4628-32.
10. Lv L. Defluoridation of drinking water by calcined MgAl-CO3 layered double hydroxides. Desalination 2007;208:125-33.
11. Pommerenk P, Schafran GC. Adsorption of inorganic and organic ligands onto hydrous aluminum oxide: Evaluation of surface charge and the impacts on particle and NOM removal during water treatment. Environ Sci Technol 2005;39(17):6429-34.
12. Castel C, Schweizer M, Simonnot MO, Sardin M. Selective removal of fluoride ions by a two-way ion-exchange cyclic process. Chem Eng Sci 2000;55:3341-52.
13. Bulusu KR, Sundaresan BB, Pathak BN, Nawlakhe WG, Kulkarni DN, Fig. 14: (a) Fourier transform infrared (FTIR) analysis of java plum (Syzygium cumini) before adsorption of fluoride, (b) FTIR analysis of
java plum (S. cumini) after adsorption of fluoride
Fig. 13: (a) Energy dispersive X-ray analysis (EDAX) image of java plum (Syzygium cumini) seeds before biosorption, (b) EDAX image of java plum (S. cumini) seeds after biosorption
Element Weight % Atomic % Net Int. Error %
C K 48.97 56.83 65.9 7.16
O K 48.33 42.11 51.49 11.41
Al K 0.61 0.31 2.4 65.56
K K 2.09 0.74 4.99 31.42
Element Weight % Atomic % Net Int. Error %
C K 49.57 57.43 60.71 7.57
O K 47.02 40.89 47.97 11.53
F K 0.62 0.45 0.54 86.13
Mg K 0.23 0.13 0.78 76.84
Al K 0.63 0.32 2.38 65.93
Si K 0.69 0.34 2.77 63.75
Ca K 1.24 0.43 2.34 63.37
a b
Thergaonkar VP. Fluorides in water, defluoridation methods and their limitations. J Inst Eng Environ Eng Div 1979;60:1-25.
14. Phantumvanit P, Songpaisan Y, Möller IJ. A defluoridator for individual households. World Health Forum 1988;9(4):555-8.
15. Rao NV, Mohan R, Bhaskaran CS. Studies on defluoridation of water. J Fluor Chem 1988;41:17-24.
16. Aksu Z, Gönen F. Biosorption of phenol by immobilized activated sludge in a continuous packed bed: Prediction of breakthrough curves. Process Biochem 2004;39:599-613.
17. Mumtazuddin S, Azad AK. Removal of arsenic using mango, java plum and neem tree barks. IJAPBC 2012;1(3):372-6.
18. Singh TP, Bhatnagar J, Majumder C. Distribution of residence time for packed bed column reactor using a packing of bio-adsorbent (java plum seed). IJSET 2015;4(5):757-60.
19. Mathialagan T, Viraraghavan T. Adsorption of cadmium from aqueous solutions by perlite. J Hazard Mater 2002;94(3):291-303.
20. Perrich JR. Activated Carbon Adsorption for Wastewater Treatment. Boca Raton, FL: CRC Press Inc.; 1981.
21. McKay G, Bino MJ. Simplified optimization procedure for fixed bed adsorption systems Water Air Soil Pollut 1990;51(1):33-41.
22. Negrea A, Lupa L, Ciopec M, Negrea P. Experimental and modelling studies on As (III) removal from aqueous medium on fixed bed column. Chem Bull Politehnica Univ Timisoara Romania Ser Chem Environ Eng 2011;56:2.
23. Guo H, Stüben D, Berner Z, Kramar U. Adsorption of arsenic species from water using activated siderite-hematite column filters. Journal of Hazard Mater 2008;151:628-35.
24. Hutchins RA. New method simplifies design of activated-carbon systems. Chem Eng 1973;80:133-8.
25. Mckay G, Blair HS, Gardner JR. The adsorption of dyes on to chitin in fixed- bed columns and batch adsorbers. J Appl Polym Sci 1984;29:1400-9.