R E S E A R C H
Open Access
Performance analysis of an enhanced
cooperative MAC protocol in mobile ad hoc
networks
Jaeshin Jang
1*and Balasubramaniam Natarajan
2Abstract
In this paper, we evaluate the performance of an enhanced cooperative MAC with busy tone (eBT-COMAC) protocol in mobile ad hoc networks via a combination of theoretical analysis and numerical simulation. Our previously proposed BT-COMAC protocol was enhanced by (1) redesigning the minislots used in the helper node selection procedure; (2) specifying complete frame formats for newly defined and modified control frames; and (3) using a new metric (the received SNR rather than the received power) in the helper node competition. In this eBT-COMAC protocol, cooperation probability is calculated based on a geometric analysis, and a Markov chain-based model is used to derive steady-state probabilities for backoff-related parameters. These results are used to analytically characterize two performance measures: system throughput and channel access delay. Numerical simulation of a mobile wireless network where all communication nodes are assumed to be uniformly distributed in space and move independently based on a random waypoint model is used to validate the analytical results and demonstrate the performance gains achieved by the proposed eBT-COMAC protocol.
Keywords: Cooperative communication, eBT-COMAC protocol, Helper node selection, Received SNR
1 Introduction
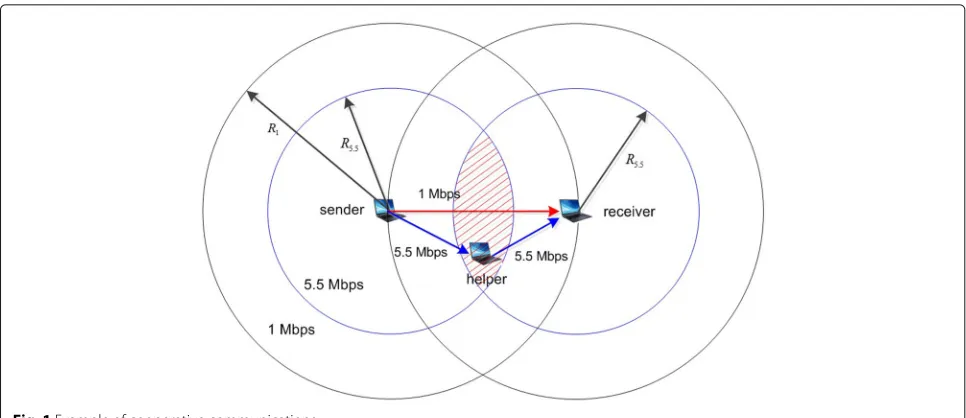
With the remarkable development of wireless technolo-gies, 4G mobile communication systems can support peak data transmission rates up to 3 Gbps [1]. However, when mobile nodes are located around a cell boundary or when two mobile nodes in a mobile ad hoc network [2] are located far away from each other, severe fading occurs, resulting in a large number of transmission errors. This form of wireless channel impairment can be overcome with multiple input multiple output (MIMO) technology. However, it is not always possible to include multiple antennas in a small mobile node. Cooperative commu-nication is an alternative approach for overcoming the effect of channel fading [3]. An example of coopera-tive communication is shown in Fig. 1. If any node is located at an intermediate position between a sender and a receiver node, for example, in the shaded area in Fig.1,
*Correspondence:[email protected]
1Department of Electronic Telecommunications Mechanical and Automotive Engineering, Inje University, 197 Inje-ro, Gimhae, Gyeongnam 50834, South Korea
Full list of author information is available at the end of the article
this helper node can assist in the transmission process and help increase system throughput. In any cooperative communication scheme, finding the best helper node is critical. Helper node selection schemes are classified as two types: proactive and reactive schemes. In a proac-tive scheme, every mobile node maintains its relay table where wireless channel status with its neighboring nodes is stored [4–8, 23]. Each node shares a relay table with its neighboring nodes by periodically broadcasting some messages. Therefore, when a sender node wants to send a data packet to its destination node, it can find its helper node based on its relay table. In reactive schemes, the sender node begins the search for a helper node after the exchange of control frames [9,10,13–15,20]. Although it takes time to select an optimal helper node, this reac-tive scheme guarantees that the newly selected helper node has a more conducive wireless channel than that in a proactive scheme. Initial studies in the area of coopera-tive medium access control (MAC) protocols focused on proactive schemes. However, reactive helper node selec-tion schemes have gained popularity because (1) proactive schemes impose a greater load on both the network and
Jang and NatarajanEURASIP Journal on Wireless Communications and Networking (2018) 2018:76 Page 2 of 15
Fig. 1Example of cooperative communications
processors within a node; and (2) there is no guarantee that the helper node chosen via a proactive scheme is optimal at data transmission time. In this work, we are interested in enhancing system performance with a new reactive helper node selection process in wireless local area networks (WLANs).
1.1 Related work
Most studies on cooperative MAC protocols follow the IEEE 802.11 WLAN design principle [11] and thus, only IEEE 802.11-based cooperative MAC protocols with link adaptation [12] are surveyed in this paper. There are three typical studies on reactive helper node selection schemes. In [13], three busy signals are used to find an optimal helper node, which is not energy efficient. A three-step helper node selection scheme was adopted in two pre-vious studies [14, 15] consisting of GI (group indica-tion), MI (member indicaindica-tion), and K minislot contention. The optimal cooperation region and system parameters were determined in [14] while an additional energy met-ric was used to select the best helper node in order to increase network lifetime in [15]. However, all three of these schemes use data transmission rates-related metrics for their helper node selection procedures, which has its drawbacks, as will be discussed in Section1.2
There have also been several recent studies on cooper-ative MAC protocol design [16–19]. In [16], three trans-misson modes are suggested where relay nodes were chosen based on proactive mechanisms: direct transmis-sion, cooperative relay transmistransmis-sion, and two-hop relay transmission. Cooperative relay transmission mode is used for increasing system throughput while the two-hop relay transmission mode helps extend the service range. However, there is no suggested algorithm for choosing
an appropriate mode. In [17], a new cooperative MAC protocol based on a three-way handshake with request to send (RTS), clear to send (CTS), and relay ready to send (RRTS) is proposed. Its reactive relay node selection scheme is based on the fact that the fastest relay candi-date will reply to an RRTS frame earlier. However, [17] does not consider the possibility of relay node compe-tition and approaches to deal with collisions. In [18], a helper node initiated cooperative MAC protocol is pro-posed. Helper nodes are decided in advance with the help of a relay table, and they initiate cooperative communica-tion by sending a helper clear to send (HCTS) frame when the transmission rate between sender and receiver nodes falls below a threshold. In [19], three data transmission modes similar to those suggested in [16] are discussed. In contrast to [16], an algorithm to find a suitable trans-mission mode is suggested in [19]. It is described that the optimal helper node is chosen via the shortest path algorithm. However, there is no detailed discussion on how to select the optimal helper node. Therefore, issues such as helper node competition and whether the short-est path can be decided without additional control frame exchanges remain unanswered. In this paper, we aim to address these issues via the design and analysis of a new cooperative MAC protocol.
1.2 Contributions
node selection scheme. The key difference between our proposed helper node selection scheme and prior work [14, 15] is that we use a received signal-to-noise ratio (SNR) value in the minislot contentions rather than trans-mission rates, which were used in two previous studies. In general, the received SNR is closely related to transmis-sion rates. However, because the number of transmistransmis-sion rates is limited (i.e., in IEEE 802.11b, there are four data transmission rates: 1, 2, 5.5, and 11 Mbps), the previ-ous schemes may have the problem that candidate helper nodes with the same transmission rates can experience continuous collisions in minislot contentions. The main contributions of our study include the following:
• The use of a new reactive helper node selection scheme with received SNR as the selection metric; • Clear design of the packet formats for the required
control frames for eBT-COMAC protocol in order to support the helper node selection scheme;
• Presentation and validation (via computer simulation) of a comprehensive mathematical analysis of the throughput and delay associated with eBT-COMAC; • The provision of increased system throughput
performance with the eBT-COMAC protocol that is 58% higher than IEEE 802.11 WLAN [11] and 6% higher than prior work [14];
• Easy extension of the entire approach to current standards, although IEEE 802.11b WLAN is the standard considered in this work.
This paper consists of five sections. A detailed expla-nation of the eBT-COMAC protocol is presented in Section2; the system model and performance analysis are discussed in Section 3. The numerical results from the analysis and simulation are described in Section 4, and Section5presents the conclusions.
2 eBT-COMAC protocol
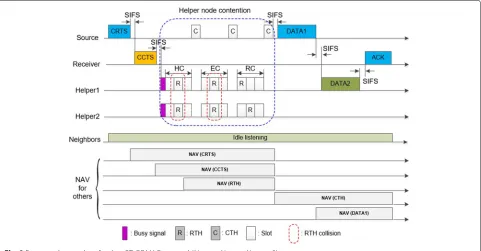
The frame exchange procedure for the eBT-COMAC pro-tocol for cooperative communications is given in Fig.2. Any sender node that has data to send begins its trans-mission by sending a cooperative request-to-send (CRTS) frame. When the receiver successfully receives the CRTS frame, it replies with a cooperative clear-to-send (CCTS) frame. After receiving the CRTS and CCTS frames, all mobile nodes located between the sender and receiver nodes can calculate two transmission rates, RSH,RHR,
based on the received SNR. The direct transmission rate RSRcan be obtained from the physical layer convergence
procedure (PLCP) header of the CCTS frame. Any can-didate helper node whose two-hop effective rate (Re2) is
greater than the one-hop effective rate (Re1) sends a short
busy signal to notify all surrounding nodes that there is at least one eligible candidate helper node and thus, the
helper node selection procedure will start. The helper node selection procedure consists of three steps: harsh contention (HC), exact contention (EC), and random con-tention (RC). Each concon-tention consists of several minislots or slots. The size of each HC and EC minislot is the same as slot size (σ), as shown in Table4, and the size of RC slots is the same as the request-to-help (RTH) frame transmission time at the basic rate. If any optimal node is decided from the helper node selection scheme, this node plays the role of the helper node, at which time two-hop communication begins. The effective transmission rate represents the ratio of DATA length in bits to the required time period in seconds from the end of the busy signal to the successful reception of the acknowledgement (ACK) frame. One- and two-hop effective transmission rates are calculated as follows [20]:
Re1,2 = number of HC (EC) minislots;NRC is the number of RC
slots;TACK,RTH,CTHare the transmission times of control
frames ACK, RTH, and clear-to-help (CTH), respectively, andRSH(HR) corresponds to the DATA frame
transmis-sion rates between a sender and a helper (a helper and a receiver) node;SIFSis a MAC parameter representing short interframe space.
Detailed control frames used in the eBT-COMAC pro-tocol are described in Fig.3. The eBT-COMAC protocol is designed based on the IEEE 802.11 WLAN standard. Two control frames, the RTH and CTH frames, are newly sug-gested and the CRTS frame has a new field “PKT_LEN,” which stands for data packet length in bytes. The CTH frame has two different formats, namely, long CTH and short CTH. The long CTH is a full-sized frame with three optional fields, helper node address (HA), and two possi-ble transmission rates between sender and helper nodes (RSH) and helper and receiver nodes (RHR). This long CTH
is used when helper node selection competition is suc-cessful. On the other hand, the short CTH does not have three optional fields and it is used when the helper node selection competition fails. That is, long CTH is a positive response but short CTH is a negative response for RTH transmissions in HC, EC, and RC contention.
2.1 Helper Node Selection
Jang and NatarajanEURASIP Journal on Wireless Communications and Networking (2018) 2018:76 Page 4 of 15
Fig. 2Frame exchange chart for the eBT-COMAC protocol (NHC = NEC = NRC = 3)
selection procedure starts after the sender and the receiver nodes exchange CRTS and CCTS frames. The helper node selection scheme in eBT-COMAC consists of three steps. The goal of HC and EC minislot contention is to find the optimal helper node, and the RC slot con-tention is to select one helper node on a probabilistic basis. The metric used in this contention is a utilityU, cor-responding to the received SNR in the dB scale, i.e.,U ≡ logSNRrcvd. HC and EC consist ofNHC andNEC
minis-lots. The contention is carried out with the help of an RTH
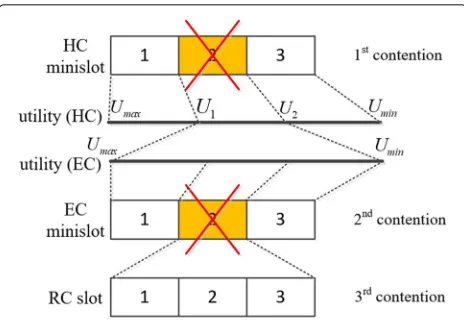
frame transmission in the appropriate minislot. Earlier, HC and EC minislots are assigned for the candidate helper nodes with greater utility values. In HC and EC minis-lot contention, if any candidate helper node observes that another node has transmitted an RTH frame earlier than itself, it exits the competition. The utility window between Umax and Umin is uniformly divided, and the mapping
rule between the utility values and HC and EC minis-lot numbers can be explained by examining Fig. 4when NHC = NEC = 3. Here,Ui=U|rmmax−iUinc,i = 1, 2,
Fig. 4Example of mapping between utility values and minislots
whereUinc= Umax−3Umin. If there is a collision in minislot
2 at HC minislot contention, those candidates involved in the collision begin their contention again at the EC minis-lots. In this case,U1andU2in the HC contention become
UmaxandUminin the EC minislot contention. If there is a
continuous collision in the EC minislot contention, those candidates involved in the collision move into the RC slot contention. The RC slot contention is based on random selection. Those candidate nodes that are involved in the RTH frame collision in the EC minislot contention gen-erate a random number between 1 andNRC. Then, they
transmit their RTH frame in the assigned slot. If there is more than one successful slot in this contention, the candidate that sent its RTH in the earlier slot has prior-ity and then this candidate is chosen as the final helper node. The sender node decides the winner of the compe-tition. If a helper node wins the competition, the sender node transmits a long CTH frame. Otherwise, the sender node transmits a short CTH frame. The “feedback” field in the CTH frame contains the competition result (C_result). “11” in “C_result” means that the competition was suc-cessful and “00” means failure in the competition. The flow chart for the operation at a candidate helper node is shown in Fig.5.
3 Performance evaluation
Our goal is to analyze the eBT-COMAC protocol and quantify its throughput and channel access delay. The procedure to achieve this goal involves several inter-mediate results. First, cooperation probability and suc-cessful helper node selection probability are derived. Then, the steady-state probability for the three system state variables related to the backoff operation are eval-uated. Finally, based on the calculation of average time slot size, the system throughput and channel access delay are derived. We begin by highlighting the assump-tions underlying this process. First, nodes are assumed
to be uniformly distributed within the communication area. Second, to calculate the success probability in the helper node selection competition, we use an approximate approach, the classical definition of probability. Actually, it is almost impossible to derive an exact equation for the success probability because of the dynamic charac-teristics of helper node selection competition. Therefore, Eq. (3) has a characteristic that is sensitive to the num-ber of minislots and the numnum-ber of helper nodes, which will be described in Section4. Next, it is assumed that all frames, including the DATA frame are susceptible to packet transmission error, which is a more realistic con-sideration than in previous studies [5–15, 21, 22]. For completeness, several system variables required for the performance analysis of the IEEE 802.11b CSMA/CA and eBT-COMAC protocols are defined in Table1.
We begin the analysis of the proposed protocol with the derivation of the cooperation probability. Let us con-sider an example in Fig.1where the sender and receiver nodes are far apart and thus can communicate with each other only at a rate of 1 Mbps. In this case, a helper node, located in the shaded area, can help increase the system throughput for communication between the sender and the receiver nodes.
Lemma 1The cooperation probability phcorresponds to
ph =
p1
S1(r2,r5.5,r1)
πr21 +p2
S1(r5.5,r5.5,r2)
πr22
+p5.5
S1(r11,r11,r5.5)
πr5.52
pr. (2)
where, ri,pi, and pr are defined in Table 1, and S1(·)
represents the size of overlapping area in Fig.1.
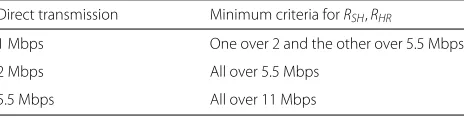
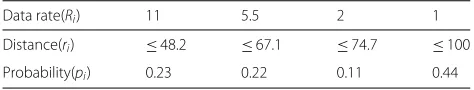
ProofThe minimum participation criteria for cooper-ative communication is given in Table2 when the rela-tion between data transmission rates and ranges for IEEE 802.11b has those values in Table 3 [20]. The coopera-tion probabilityphcan be approximately expressed as the
weighted sum of various ratios of the overlapped area to the transmission area of the sender node when the direct transmission rate is 1, 2, and 5.5 Mbps, respectively. For example, when the direct transmission rate is 1 Mbps with the probability p1, πr12 is the transmission area of the
sender node andS1(r2,r5.5,r1)represents the overlapped
Jang and NatarajanEURASIP Journal on Wireless Communications and Networking (2018) 2018:76 Page 6 of 15
Fig. 5Flow chart depicting the process at a candidate helper node
As described in Section 2, the helper node selection scheme consists of three steps: HC, EC, and RC competi-tions. The probability of successful helper node selection in each step is provided in Lemma2.
Lemma 2The probability that the optimal helper node is selected successfully from three-step competitions corresponds to
Table 1Definition of system parameters
r The maximum value of the backoff stage
m The maximum value of the contention window size
Ns(Nh) The number of sender (helper) nodes
τ CRTS frame transmission probability on a wireless channel
pm(pd) Control (DATA) frame transmission error
probability due to a bad wireless channel
pc CRTS frame transmission failure probability due
to collision
psr Helper node selection success probability
pfr Helper node selection failure probability
Ri Data transmission rate in Mbps
fori=1, 2, 5.5, 11
ri Maximum distance (m) for eachRi
pi Probability for transmitting DATA atRi
ph Cooperation probability that at least one
candidate helper node is in cooperation
pr Probability that a receiver node is located within
its sender node’s transmission range
psr = ps1(1−pm)+ {1−ps1(1−pm)}ps2 ·(1−pm)+ {1−ps1(1−pm)}
· {1−ps2(1−pm)}ps3(1−pm) (3)
Proof In the first step, let us define the possible number of candidates participating in HC the minislot contention as M1 = phNh. Then the probability ps1 that the best
helper node is selected successfully in the HC minislot contention can be calculated as the ratio of the number of successful transmissions of the RTH frame to the total number of possible transmissions.
ps1 ≡
A (NHC)M1
(4)
A =
⎧ ⎨ ⎩
0, M1<1
NHC, M1=1 NHC−1
i=1 (NHC−i)M1−1, M1>1
In the second step, let us define the possible number of candidates participating in the EC minislot contention as M2. Although an HC minislot is assigned to a candidate
Table 2Minimum participation criteria for cooperative communication
Direct transmission Minimum criteria forRSH,RHR
1 Mbps One over 2 and the other over 5.5 Mbps
2 Mbps All over 5.5 Mbps
Table 3Transmission rates and ranges
Data rate(Ri) 11 5.5 2 1
Distance(ri) ≤48.2 ≤67.1 ≤74.7 ≤100
Probability(pi) 0.23 0.22 0.11 0.44
helper node based on its utility value, let us assume that the location of the HC minislot where the helper node competition is successful is uniformly distributed between 1 andNHC. Then, it is easy to see thatM2 = M1/NHC.
The probabilityps2 that the best helper node is selected
successfully in the EC minislot contention can be calcu-lated as the ratio of the number of successful transmis-sions of the RTH frame to the total number of possible transmissions.
In the third step, the RC slot contention, let us define the possible number of candidates participating in the RC slot contention asM3, whereM3 = M2/NEC. Then, the
prob-abilityps3that the best helper node is selected successfully
in the RC slot contention can be calculated as the ratio of the number of successful transmissions of the RTH frame to the total number of possible transmissions.
ps3 ≡
Finally, the probability that the optimal helper node is selected successfully is the weighted sum of the successful selection of helper nodes at each step, which is provided in Eq. (3).
RTH frame transmission failure occurs when an optimal helper node is not decided from the three-step competi-tions. This failure probabilitypfrcorresponds to
pfr =1−psr. (7)
The frame transmission procedure in the eBT-COMAC protocol, including the backoff operation for each station, is modeled as a Markov chain with the system state vector:
• b(t): backoff stage of the sender node, b(t)=0, 1,· · ·,r
• c(t): value of the backoff counter, c(t)=0, 1,· · ·,Wb(t)−1
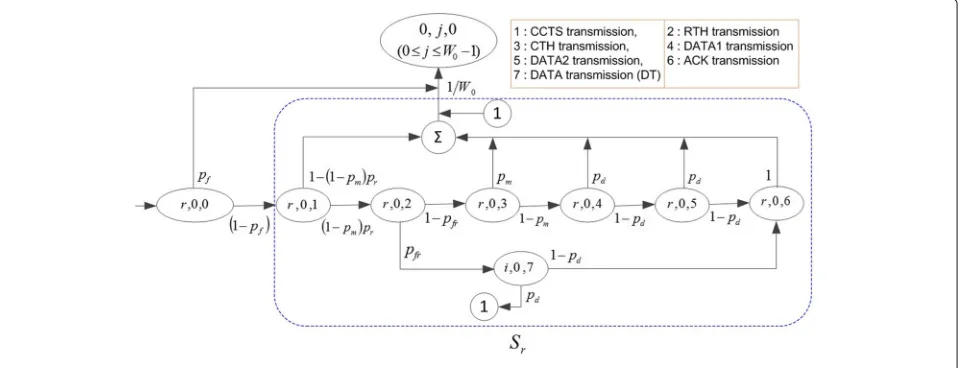
• o(t): frame transmission phase,o(t)=0, 1,· · ·, 7.
Here, the variable o(t) represents the sending phase for each frame, which is shown in Fig. 7: 0 represents the sending phase of a CRTS frame; 1 refers to a CCTS frame, 2, 3, 4, and 5 are for RTH, CTH, DATA1, and DATA2, repectively; 6 represents an ACK frame; and 7 is for DATA frame at direct transmission. We attempt to derive steady-state probabilities for this system state vector. Our mathematical analysis approach is carried out based on previous research in [21–23]. It is assumed that every sender node always has data frames to trans-mit in its buffer, which is known as a saturated traffic model.
The eBT-COMAC protocol uses the same retransmis-sion scheme as IEEE 802.11b and thus, the contention window size at each retransmission is determined by the following rule:
Transmission failure for the CRTS frame could occur due to collisions with other frames or a bad wireless channel. Therefore, the CRTS frame transmission failure probability is given by
pf =pc+pm−pcpm. (9)
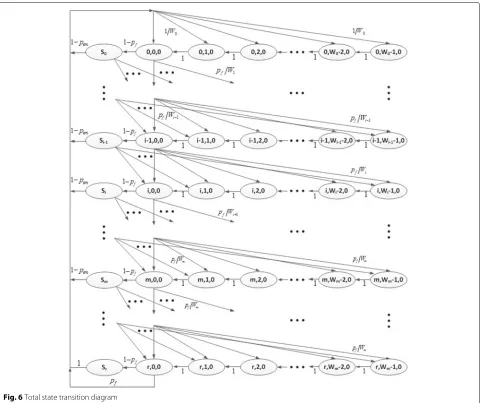
Let us define the steady-state probability as αijk ≡ limt→∞prob.{b(t)=i,c(t)=j,o(t)=k}. State transition
rate diagrams for eBT-COMAC are shown in Figs.6, 7, and8. Figure6 shows the total state transition rate dia-gram, and the detailed descriptions ofSi, 1≤i≤rlocated
Jang and NatarajanEURASIP Journal on Wireless Communications and Networking (2018) 2018:76 Page 8 of 15
Fig. 6Total state transition diagram
Fig. 8State transition diagram forSr
By the iterative method, steady-state probabilities can be derived with the additional condition that the sum of all probabilities is one. That is,
r
In the calculation of the steady-state probabilities, the CRTS frame transmission probabilityτ and the transmis-sion failure probability for a CRTS frame due to collitransmis-sion pcshould be expressed as
τ =
Two performance measures were considered for the performance analysis. One is the system throughput in bps, and the other performance measure is the average channel access delay in seconds. In order to derive the system throughput, two types of average delays should be calculated in advance. The first one isDS, the average time
delay from the transmission of the CCTS frame to the suc-cessful reception of the ACK frame, and the second one isDE, the average time delay from the transmission of the
CCTS frame to transmission failure with the CCTS, RTH, CTS, DATA, or ACK frame.
Lemma 3The average time delays from the transmission of the CCTS frame to the successful reception of the ACK frame for direct and cooperative transmission, respectively, correspond to
DS1 = D1S+DE2+D7S+D6S (17)
DS2 = D1S+D2S+DS3+D4S+D5S+D6S, (18)
where, DkS is the average time delay spent at phase k for successful frame transmission. D2Eis the average time delay spent at phase 2 because of frame transmission error; it will be derived in the Lemma4.
Jang and NatarajanEURASIP Journal on Wireless Communications and Networking (2018) 2018:76 Page 10 of 15
be derived first. According to the sequence of frame exchanges, these delays are given by
D1S = TCCTS+SIFS
islot contention periods. It is assumed that the location of the HC or EC minislot where the helper node com-petition is successful is uniformly distributed between 1 andNHCorNEC. Then, they can be expressed asTHC =
NHC
2 σ +TRTH and TEC = NEC
2 σ + TRTH, respectively.
TBT refers to the time period of the busy tone signal. In
the above equation, TDATAc(d) represents the data
trans-mission period in the cooperative (direct) transtrans-mission at each data transmission rate. These values can be derived as follows:
Then, the average time delays from the CCTS transmis-sion to successful reception of the ACK frame for direct transmission and two-hop transmission are as given in Eqs. (17) and (18).
Lemma 4The average time delay from the CCTS frame to any frame transmission failure corresponds to
DE = D1E
where, the probability Pteis defined for its normalization
condition and it corresponds to
ProofThe average time delaysDkE, k = 1, 2,· · ·, 7, are given by
D1E = TCCTS+SIFS
D2E = TBT+THC+TEC+NRCTRTH+2TCTHS D3E = TCTHL+SIFS
D4E = TDATAc+SIFS=D 5 E
D6E = TACK
D7E = TDATAd+SIFS.
For example, the phasek = 2 represents the transmis-sion of RTH frames and it means helper node selection competition. Thus,D2E refers to the required time delay for complete failure of the helper node selection proce-dure. This delay consists of a busy tone signal, HC and EC contention periods, RC slots, and two short CTH frame transmissions in the HC and EC contentions, respec-tively. Then, the average time delay from the CCTS frame to complete transmission failure can be expressed as a weighted sum of consumed time delays until complete transmission failure in each phase. If complete failure occurs at the phasek = 4, then, frame transmissions at phases 1, 2, and 3 should be successful. Thus, the time delay from the CCTS frame to DATA frame transmission failure isD1S+D2S+D3S+D4E. Therefore, the average time delay from the CCTS frame to any frame transmission failure corresponds to Eq. (21).
The following two theorems provide the expression for evaluating two performance measures of interest: system throughput and channel access delay.
Theorem 1(system throughput)The system throughput is defined as the length of successfully transmitted data in bits during a unit of time, and corresponds to
TH= PtrPs(Pa1+Pa2)(Ld+Lh) E[S]
bps (22)
where, Lhis the sum of the MAC header and PLCP header,
E[S] is the average slot time, Ptr is the probability that
there is at least one CRTS frame transmission by Nsmobile
users in the considered time duration, and Psis the
prob-ability that the transmitted CRTS frame is successfully received by the helper node without collision and trans-mission error. Pa1 and Pa2 are the probabilities that no
transmission errors occur during the period from the CCTS frame to ACK frame transmission for direct and two-hop transmissions, respectively.
ProofSince CRTS frame transmission by each sender node is modeled as a Beroulli distribution with the proba-bilityτ, two probabilitiesPtrandPsare derived as
Ptr = 1−(1−τ)Ns (23)
Ps =
Nsτ(1−τ)Ns−1
Ptr (1−
pm). (24)
The probabilitiesPa1andPa2correspond to
Pa1 = (1−pm)2prpfr(1−pd) (25)
Pa2 = (1−pm)3pr(1−pfr)(1−pd)2. (26)
Let us defineSas slot time, representing the time inter-val between two consecutive idle slots. There are four different types of slot times. First, when there is no trans-mission on the channel, the slot time means the slot durationTI = σ. Second, when the transmission of the
CRTS frame results in failure due to collision or a bad wireless channel, the slot time becomesTF. Third, when
the source node does not receive the ACK frame, even after successful transmission of the CRTS frame, the slot time becomes TE. Finally, if the total transmission
sce-nario is successful, then this slot time is TS1 for direct
transmission or TS2 for a two-hop transmission. These
slot time types are indicated as
TI = σ
TF = TCRTS+DIFS+σ
TE = TCRTS+SIFS+DE+DIFS+σ
TS1 = TCRTS+SIFS+DS1+DIFS+σ
TS2 = TCRTS+SIFS+DS2+DIFS+σ.
Then, the average value ofSis the weighted sum of the four different slot times and is given by
E[S] = (1−Ptr)TI+PsPtr(Pa1TS1+Pa2TS2) +PsPtr(1−Pa)TE+Ptr(1−Ps)TF. (27)
The probability that the given DATA frame is trans-mitted successfully is the product of three probabilities derived in Eqs. (23)–(26):Ptr,Ps, andPa1+Pa2. Because
the system throughput can be expressed as the ratio of the total length of the DATA frame successfully transmitted in bits to the average time slot, it corresponds to Eq. (22).
Jang and NatarajanEURASIP Journal on Wireless Communications and Networking (2018) 2018:76 Page 12 of 15 Here, W represents the minimum contention window size, CWmin and TA = TCRTS + SIFS + {DS1pfr+
DS2(1−pfr)}, and PS(i)represents the probability that one
sender node receives the ACK frame successfully at the i-th backoff stage.
ProofThe probabilityPS(i)can be approximately
mod-eled as a geometric distribution with the parameterpst.
Here, the probabilitypst represents the successful
trans-missions from the CRTS frame to the ACK frame and is given by
pst=(1−pf)(Pa1+Pa2). (29)
Then, the probabilityPS(i)is given by
PS(i)=(1−pst)ipst, 0≤i≤r. (30)
It is assumed that when the current system state of the sender node is{b(t) = i,c(t) = 0,o(t) = k} as in Fig.6, the next system state is determined based on uni-form distribution. That is, the next possible system state will be (0,j, 0) or (i+ 1,j, 0) depending on whether the current frame transmission is successful or not. Here, the valuejis uniformly distributed between 0 andW0−1 or
Wi+1−1. Because the sender node stays in any state until
the upcoming idle slot, the average time to stay in any state in Fig.6equals the average slot sizeE[S]. Thus, the channel access delay corresponds to the weighted sum of the products ofE[S], and the number of states where the sender node stayed from the beginning of channel sensing to any state of(i, 0, 6), 0≤i≤rwhen the ACK transmis-sion is successful. Therefore, the exprestransmis-sion of the channel access delay is given as Eq. (28).
4 Network model and numerical results 4.1 Network model and environment
We consider the operation of the eBT-COMAC proto-col over the IEEE 802.11b WLAN specification [11]. First, it is important to note that the proposed eBT-COMAC protocol can also be easily integrated into other current wireless networking standards. We assume that all mobile nodes are working in WLAN ad hoc mode. Therefore,
any mobile node can directly communicate with the other mobile nodes. It is assumed that all mobile nodes are uniformly distributed within a 200m×200msquare com-munication area and mobile nodes move independently within this communication area based on a random way-point mobility model: (1) every mobile node determines its next location based on uniform distribution and then moves to its next location at the speed ofv[m/sec], which is determined from the uniform distribution between 0 andVmax; (2) as soon as it arrives at its next location, it
takes a pause during a period, which is also determined from the uniform distribution between 0 andTpause; (3)
after its pause, it returns to step (1) and repeats the entire process. All mobile nodes are classified into one of three types: sender, receiver, or helper nodes. It is assumed that there areNscommunication connection pairs between the
sender and receiver nodes, and that these communication connections are fixed during the entire simulation period. The log-distance path loss model is used for modeling wireless channels, and the relationship between transmis-sion distance and path loss is represented by Eq. (31) [24]:
Lp(d)(dB)=Ls(d0)(dB)+10nlog10(d/d0), (31)
whered0is the reference distance andnis the path loss
exponent (in this paper, we usen = 3).
The simulation code was programmed with a gnu C++ compiler using the SMPL library [25]. Computer simula-tion was conducted 10 times with a different seed each time, and we used the averaged data as simulation results. For simplicity, it was also assumed that transmission error probabilities for the control and DATA frames caused by a bad wireless channel were the same (pm=pd).
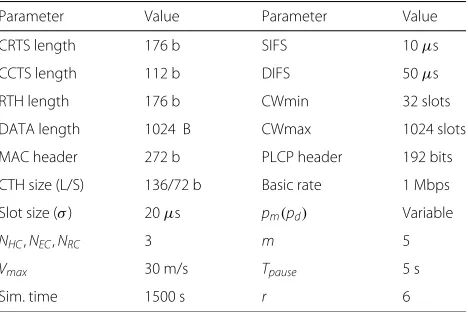
Mathemat-ical analysis and computer simulations were conducted and compared in order to prove the correctness of the mathematical equations. The system parameters used in the performance evaluation are described in Table4.
Table 4System parameters
Parameter Value Parameter Value
CRTS length 176 b SIFS 10μs
CCTS length 112 b DIFS 50μs
RTH length 176 b CWmin 32 slots
DATA length 1024 B CWmax 1024 slots
MAC header 272 b PLCP header 192 bits
CTH size (L/S) 136/72 b Basic rate 1 Mbps
Slot size (σ) 20μs pm(pd) Variable
NHC,NEC,NRC 3 m 5
Vmax 30 m/s Tpause 5 s
Fig. 9Throughput performance as a function ofNs
4.2 Numerical results
First, we will explain several abbreviations used in the leg-ends of Figs.9,10,11and12for notifying each numerical result. “ana-ebtmac” and “sim-ebtmac” represent the anal-ysis and simulation results for the eBT-COMAC protocol, respectively. Figure9shows the comparison of through-put performances by analysis and simulation results for the eBT-COMAC protocol and analysis results for the IEEE 802.11b DCF without cooperation. These numerical results were obtained when there were 40 helper nodes in the communication area. It is shown that the eBT-COMAC provides enhanced system performance about 58% higher than IEEE 802.11 WLAN (notified as “ana-dcf” in this figure). This coincides with our expectation that cooperative communication has explicit benefits over non-cooperative communication. Simulation results were consistent with the analytical results in all ranges. It is also shown that IEEE 802.11-related MAC protocols provide the best system performance when there are about five sender nodes in the communication area.
Figure10 shows a comparison of delay performances by analysis and simulation when there are forty helper nodes in the communication area. This figure shows that the eBT-COMAC protocol has an obvious advantage over direct communication. The analytical and simula-tion results are consistent; although there is a discrepancy
Fig. 10Delay performance as a function ofNs
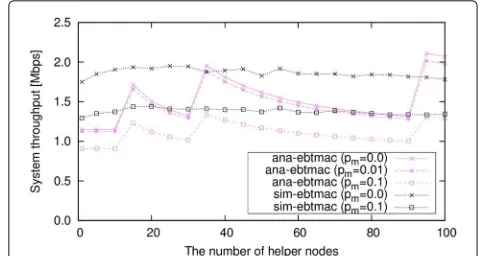
Fig. 11Throughput performance as a function ofNh
between the simulation and analysis of about 22% when Ns = 100, the difference is negligible.
Figure 11 shows a comparison of throughput perfor-mances as a function of the number of helper nodes when Ns = 10. According to the approximation that we used
in deriving the probabilitypsrin Eq. (3), analytical results
are sensitive to the number of helper nodes. According to Eqs. (4)–(6), when M1 = 1, M2 = 1, and M3 = 1,
helper node competition becomes completely successful withpsr = 1. In addition, whenM1,M2, andM3is less
than one, the probability that the best helper node is successfully decided becomes zero in Eqs. (4)–(6). Signif-icant jumps in this figure occur whenNhis about 15, 35,
and 95. These values of Nh corresponds to cases when
M1,M2, and M3 are slightly greater than one,
respec-tively, and this is why there are significant jumps in this figure.
Figure12shows a comparison of delay performances as a function of the number of helper nodes whenNs = 10.
The discrepancy between the simulation and analysis results may be due to our approximation when deriving Eqs. (2) and (3). However, Fig.12shows that the simula-tion results show a slight increase, although it is a little, in the section where the analysis results show a consistent increase.
Jang and NatarajanEURASIP Journal on Wireless Communications and Networking (2018) 2018:76 Page 14 of 15
Fig. 13Throughput comparison of eBT-COMAC with the reference [14]
Figure13shows a throughput comparison of the eBT-COMAC protocol with the reference [14], denoted as “clmac”. When NHC = NEC = 3, it seems that the
eBT-COMAC protocol provides slightly lower through-put than the reference [14]. This means that the optimal candidate helper node was not properly selected in the HC and EC minislot contentions of the eBT-COMAC protocol with this number of minislots. However, when NHCandNECare greater than 5, the eBT-COMAC
proto-col provides approximately 6% higher system throughput performance than the reference [14] whenNHC = 8.
A greater number of minislots contributes to choosing one optimal helper node because helper node candi-dates with different received SNR values can be classified more clearly. However, the system throughput perfor-mance results for reference [14] are almost the same when NHCandNECare 3 and 5, respectively. This is because the
cooperative MAC protocol in [14] uses transmission rates as a metric in the helper node selection. There are only four different transmission rates in IEEE 802.11b and thus, more minislots are useless for this MAC scheme.
5 Conclusions
In this paper, we presented for the first time, a compre-hensive theoretical performance analysis of an enhanced BT-COMAC protocol and validated the analytical results via numerical simulations. The new helper node selec-tion scheme in the eBT-COMAC protocol is based on received SNR values at each candidate node. This results in a dynamic characteristic that presents challenges in analytical modeling. In this paper, two probabilities, the cooperation probability and the probability that a helper node is successfully selected, were derived based on a geometric analysis. These probabilities, along with steady-state probabilities of backof-related parameters (derived based on a Markov analysis), are used to derive theoret-ical expressions for the system throughput and channel access delay of the eBT-COMAC protocol. Although the analytical results are not exact and are based on approx-imations that provide theoretical tractability, they are for the most part consistent with the numerical simulations. Future work will involve the design of an energy-aware eBT-COMAC protocol that can provide throughput gains while improving network lifetime.
Appendix 1: calculation of cooperative area
Let us consider two circles, the radii of which areaandb, respectively, with an overlapped area, as shown in Fig.14. The distance between the origins of the two circles isd. Using the theory of the segment of a circle and its radius, the overlapped areaScan be derived as follows:
S= 1 2
a2(η−sin(η))+b2(φ−sin(φ)). (32)
According to a cosine formula, the following relation can be simply derived.
b2=a2+d2−2ad·cos
η
2
. (33)
Then, combining Eq. (33) with Eq. (32), the overlapped area can be derived as follows:
S(a,b,d) = 1
As shown in Table3, the transmission range of 1 Mbps, for example, is 74.7≤r1≤100m. Then, the equation of
S1(r2,r5.5,r1)used in Eqs. (2), (19), (20) is calculated as the
average of two transmission areas by the transmission rate R1and the one level higher rateR2.
S1(r2,r5.5,r1)= S(r2
,r5.5,r1)+S(r2,r5.5,r2)
2 . (35)
Abbreviations
ACK: Acknowledgement; BT-COMAC: Cooperative MAC with busy tone; CCTS: Cooperative clear to send; CRTS: Cooperative request to send; CTH: Clear to help; CTS: Clear to send; eBT-COMAC: Enhanced BT-COMAC; EC: Exact contention; GI: Group indication; HA: Helper node address; HC: Harsh contention; HCTS: Helper clear to send; MAC: Medium access control; MI: Member indication; MIMO: Multiple input multiple output; PLCP: Physical layer convergence procedure; RC: Random contention; RRTS: Relay ready to send; RTH: Request to help; RTS: Request to send; SIFS: Short interframe space; SNR: Signal-to-noise ratio; WLAN: Wireless local area network
Acknowledgements
The authors would like to thank the reviewers for their thorough reviews and helpful suggestions.
Funding
This research work was funded by a grant from Inje University for the research in 2016 (20160432).
Availability of data and materials Not applicable.
Authors’ contributions
JJ proposed the system model, derived the mathematical equations, and performed the simulation and manuscript writing. BN contributed in manuscript revision and correction. Both authors read and approved the final manuscript.
Author’s information Not applicable.
Competing interests
The authors declare that they have no competing interests.
Publisher’s Note
Springer Nature remains neutral with regard to jurisdictional claims in published maps and institutional affiliations.
Author details
1Department of Electronic Telecommunications Mechanical and Automotive
Engineering, Inje University, 197 Inje-ro, Gimhae, Gyeongnam 50834, South Korea.2Department of Electrical and Computer Engineering, Kansas State
University, 1701D Platt St., Manhattan, KS 66506, USA.
Received: 19 April 2017 Accepted: 21 March 2018
References
1. 3GPP LTE-Advanced specification release 10 (2009).http://www.3gpp. org/technologies/keywords-acronyms/97-lte-advanced. Accessed June 2013
2. IETF MANET Working Group.https://datatracker.ietf.org/wg/manet/ about/. Accessed Nov 2016
3. A Nosratinia, TE Hunter, A Hedayat, Cooperative communication in wireless networks. IEEE Commun. Mag.42(10), 74–89 (2004) 4. N Sai Shankar, C Chun-Ting, G Monisha, inIEEE Int. Conf. on Wireless
Networks. Cooperative communication MAC (CMAC)- A new MAC protocol for next generation wireless LANs, (Hawaii, 2005), pp. 1-6 5. H Zhu, G Cao, rDCF: a relay-enabled medium access control protocol for
wireless ad hoc networks. IEEE Trans. Mob. Comput.5(9), 1201-1214 (2006) 6. P Liu, Z Tao, S Narayanan, T Korakis, SS Panwar, CoopMAC: a cooperative
MAC for wireless LANs. IEEE J. Sel. Areas Commun.25(2), 340–353 (2007) 7. K Tan, Z Wan, H Zhu, J Andrian, in4th IEEE Conf. on Sensor, Mesh, and Ad
hoc Comm. and Networks. CODE: cooperative medium access for multi-rate wireless ad hoc network, (San Diego, 2007), pp. 1-10 8. H Jin, X Wang, H Yu, Y Xu, Y Guan, X Gao, inIEEE WCNC-2009. C-MAC: a
MAC protocol supporting cooperation in wireless LANs, (Budapest, 2009), pp. 1-6
9. H Shan, W Zhuang, Z Wang, Distributed cooperative MAC for multihop wireless networks. IEEE Commun. Mag.47(2), 126–133 (2009) 10. H Shan, W Zhuang, Z Wang, inIEEE ICC-2009. Cooperation or not in
mobile ad hoc networks: A MAC perspective, (Dresden, 2009), pp. 1–6 11. IEEE Standards, inPart 11: Wireless LAN medium access control (MAC) and
physical layer (PHY) specifications. IEEE Std 802.11-2012, (2012) 12. G Holland, N Vaidya, P Bahl, inACM/IEEE MOBICOM-2001. A rate-adaptive
MAC protocol for multi-hop wireless networks, (Rome, 2001), pp. 236–251 13. H Shan, P Wang, W Zhuang, Z Wang, inIEEE GLOBECOM-2008. Cross-layer
cooperative triple busy tone multiple access for wireless networks, (New Orleans, 2008), pp. 1–5
14. HShan, HT Cheng, WZhuang,Cross-layercooperativeMACprotocolindistributed wireless networks. IEEE Trans. Wirel. Commun.10(8), 2603–2615 (2011) 15. Z Yong, L Ju, Z Lina, Z Chao, C Chen, Link-utility-based cooperative MAC
protocol for wireless multi-hop networks. IEEE Trans. Wirel. Commun. 10(3), 995–1005 (2011)
16. T Zhou, H Sharif, M Hempel, P Mahasukhon, W Wang, T Ma, A novel adaptive distributed cooperative relaying MAC protocol for vehicular networks. IEEE J. Sel. Areas Commun.29(1), 72–82 (2011)
17. J Sheu, J Chang, C Ma, C Leong, inIEEE WCNC. A cooperative MAC protocol based on 802.11 in wireless ad hoc networks, (Shanghai, 2013), pp. 416–421
18. MdR Amin, SS Moni, SA Shawkat, MdS Alam, inInt’l Conf. Computer and Information Technology. A helper initiated distributed cooperative MAC protocol for wireless networks, (Khulna, 2014), pp. 302–308
19. AFMS Shah, MdS Alam, SA Showkat, inIEEE TENCON. A new cooperative MAC protocol for the distributed wireless networks, (Macao, 2015), pp. 1–6 20. J Jang, Performance evaluation of a new cooperative MAC protocol with
a helper node selection scheme in ad hoc networks. J. Inf. Commun. Converg. Eng.12(4), 199–207 (2014)
21. G Bianchi, Performance analysis of the IEEE 802.11 distributed
coordination function. IEEE J. Selec. Areas Commun.19(3), 535–547 (2000) 22. JW Tantra, CH Foh, AB Mnaouer, inIEEE ICC-2005. Throughput and delay
analysis of the IEEE 802.11e EDCA saturation, (Seoul, 2005), pp. 3450–3454 23. J Jang, SW Kim, S Wie, Throughput and delay analysis of a reliable
cooperative MAC protocol in ad hoc networks. J. Commun. Netw.5(3), 524–532 (2012)
24. TS Rappaport,Wireless communications: principles and practice. (Prentice-Hall, 2002)
![Fig. 13 Throughput comparison of eBT-COMAC with thereference [14]](https://thumb-us.123doks.com/thumbv2/123dok_us/922503.1111794/14.595.56.292.89.218/fig-throughput-comparison-ebt-comac-thereference.webp)