An improved double-difference earthquake location algorithm using
s P
phases: application to the foreshock and aftershock sequences of the 2004
earthquake offshore of the Kii peninsula, Japan (M
w=
7.5)
Ling Bai1, Ichiro Kawasaki1, Tianzhong Zhang2, and Yuzo Ishikawa3
1Disaster Prevention Research Institute, Kyoto University, Gokasho, Uji, 611-0011, Japan 2Institute of Geophysics, China Earthquake Administration, Beijing 100081, China 3Matsushiro Seismological Observatory, Japan Meteorological Agency, Matsushiro 381-1232, Japan
(Received January 3, 2006; Revised February 23, 2006; Accepted March 8, 2006; Online published July 26, 2006)
We have used s P phases to improve the hypocentral locations of the earthquakes that occurred offshore southeast of the Kii peninsula in association with the Mw=7.5 mainshock on September 5, 2004. The earthquakes were more than 100 km from the onshore seismic network and, thus, their focal depths were poorly constrained. Thes P phases were recorded about 7–11 s after the initial Pphases, with both phases having almost the same apparent velocities. The computation of ray-paths revealed that the arrival times of the laters P phases are sensitive to focal depths. We have recalculated the hypocenters and origin times for 36 events with more than six
s Pphase identifications on seismograms recorded at the High Sensitivity Seismograph Network by includings P
phases in a double-difference earthquake location algorithm, which eliminates the errors introduced by crustal heterogeneity. The relocation results were then compared with those from the Japan Meteorological Agency based on traditional absolute location techniques.
Key words: The 2004 earthquake offshore of the Kii peninsula, foreshock and aftershock sequences, improved double-difference earthquake location algorithm usings Pphases, Philippine Sea plate.
1.
Introduction
Earthquake focal depth is an important parameter for as-sessing seismic hazard, discriminating natural earthquakes from nuclear explosions, and understanding the tectonic process. However, the determination of the focal depth has been a difficult problem because the arrival time data are generally observed at stations on the surface of the Earth. Many methods of locating earthquakes have been devel-oped to improve the resolution of the focal depth. One such example is the double-difference earthquake location al-gorithm which eliminates the substantial errors introduced by crustal heterogeneity (Waldhauser and Ellsworth, 2000) and, to a certain extent, produces a more accurate absolute location of earthquakes than traditional methods (Menke and Schaff, 2004). The time separations between the direct arrivals and depth phases can also lead to a more accurate estimation of focal depths (Uminoet al., 1995; Engdahlet al., 1998; Baiet al., 2003; Gamage, 2005). Our strategy has been to improve the double-difference earthquake loca-tion algorithm usings Pphases, which provide independent evidence of the absolute focal depths.
The Nankai Trough is one of the best-studied subduction zones in the world (see Nakamuraet al., 1997; Ishikawa, 2001; Obanaet al., 2003) and is where the Philippine Sea plate (PHS) is subducting beneath the overriding Eurasia
Copyright cThe Society of Geomagnetism and Earth, Planetary and Space Sci-ences (SGEPSS); The Seismological Society of Japan; The Volcanological Society of Japan; The Geodetic Society of Japan; The Japanese Society for Planetary Sci-ences; TERRAPUB.
plate with a convergence rate of around 5–6 cm/year (Seno
et al., 1993). The 2004 earthquake offshore of the Kii peninsula occurred close to the deformation front of the Nankai Trough (Fig. 1). Since seismological stations are mostly located in onshore areas, the insufficient station cov-erage led to significant uncertainty in the depth determina-tion. Five pop-up type ocean bottom seismometers (OBSs) were initially deployed on September 8 (3 days after the mainshock) at a spacing of about 10 km; beginning on September 14, 25 OBSs were operating in order to cover the whole region of the aftershocks (Sakaiet al., 2005). Most of the hypocenters determined by the Japan Meteorological Agency (JMA) (Fig. 2(a)) were deeper than 30 km, whereas most of the hypocenters relocated by OBS data (Fig. 2(b)) or by double-difference analyses with direct P- andS- ar-rival times (Enescuet al., 2005) were shallower than 30 km. However, earthquakes with magnitudes greater than 4 can-not be located accurately using OBS data because of the limited dynamic range of the OBS recording system (Sakai
et al., 2005).
2.
s P
Depth Phases at Epicentral Distances of 120
to 300 km
With the operation of the High Sensitivity Seismograph Network (Hi-net) throughout Japan, high-quality seismo-grams enable us to identify depth phases at local epicen-tral distances for small earthquakes. Distinct later phases (which we call here the X phases) were observed for the foreshock and the aftershock sequences associated with the 2004 earthquake offshore of the Kii peninsula at epicentral
Fig. 1. Map of the Japan Islands showing the location of the 2004 earth-quake offshore of the Kii peninsula (the open circle) and the tectonic set-ting. Curved lines show the Japan Trench, Sagami Trench and Nankai Trench, which are the major plate boundaries in the Japan region.
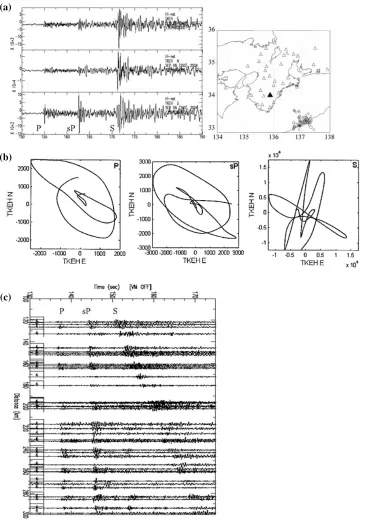
distances between 120 and 300 km (Fig. 3). The properties of these phases are as follows:
1) They are observed between the directP- andS- wave arrivals, with a travel time delay of 7–11 s following theP.
2) They are dominant on the vertical-component seismo-grams.
3) Their apparent velocities are almost the same as those for the directPwaves.
4) Their particle motions are similar to those of the direct
Pphases.
To investigate the origin of the X phases, we have cal-culated the travel times using a two-dimensional (2-D) ray-tracing program (Zelt and Smith, 1992). This program uses an efficient numerical solution of ray tracing equations and a simulation of smooth layer boundaries to yield stable in-version results. The 2-D P-wave velocity structure was determined by Nakanishiet al.(2002) from an OBS
seis-(a) (b)
Fig. 2. Comparison between (a) the JMA hypocenters and (b) the hypocenters determined by five OBS instruments (After Sakaiet al., 2005). Broken lines indicate the Nankai Trough. Most of the hypocenters located by JMA are deeper than 30 km, whereas most of the hypocenters located with the OBS instruments are shallower than 30 km.
Japan (Uminoet al., 1995; Wang and Zhao, 2005).
3.
Earthquake Relocation Method
3.1 Double-difference algorithm for direct P and s P waves
When there is a dense distribution of earthquakes, the ray paths between the source region and a common station are similar, and thus errors introduced by crustal heterogeneity can be substantially eliminated. A common travel-time difference equation between two eventsiand jat the same stationkis as
∂tki
∂mm
i−∂t j k
∂mm
j =
drki j (1)
(after Waldhauser and Ellsworth, 2000). Where tki is the travel time from events i to station k, mi =
(xi, yi, zi, ti)is the change in the hypocentral pa-rameters of eventi, and drki j =(t
i k−t
j
k)obs−(t i k −t
j k)cal is the residual between observed and calculated differen-tial travel time between the two eventsi and j. The partial derivatives oftwith respect tomare the components of the slowness vector of the ray connecting the source and re-ceiver measured at the source, which can be written out in full as formulas (2) to (4).
∂t
∂x =sin(ih)cos(Az)/v (2)
∂t
∂y =sin(ih)sin(Az)/v (3)
∂t
(a)
(c) (b)
Fig. 3. An example event showings Pphases. (a) Three-component seismograms recorded at the Hi-net station N.TKEH, which is indicated by solid triangle in the inset. (b) Particle motions ofP,s P, andSwaves recorded at the same station, N.TKEH. (c) Recorded section of vertical-component seismograms reduced by 8 km/s. Waveforms are band-pass-filtered from 1 to 4 Hz. This example is event 17 in Table 1.
wherev is the velocity, andih and Azare the take-off an-gle and the azimuthal anan-gle from source to station, respec-tively. Equations (1) to (4) are considered to be the common equations of the double-difference earthquake location al-gorithm for both the directPand thes Pphases even though their take-off angles (ihP andi
s P
h ) are different.
3.2 Double-difference algorithm includings Pphases
At regional distances, if a seismic station is far from an earthquake, the take-off angleiP
h approaches 90◦ and the corresponding coefficient cos(iP
h)is small. Therefore, the equations for the direct waves are not sensitive to focal
depths and subsequently lead to large errors in focal depth determination. The calculation ofihs P is an important step in the improvement of the double-difference earthquake lo-cation algorithm usings Pphases. The 2-D ray-tracing pro-gram of Zelt and Smith (1992) calculatesihs P using an iter-ative shooting/bisection search mode while tracing through the velocity structure. The 2-D ray-tracing equations are a pair of first-order ordinary differential equations that can be written in the following form:
d x
d z =tanθ, dθ d z =
(vztanθ−vx)
11 2004:09:06 3.8 01:02:27.27 136.94 33.36 19.78 27.46 136.94 33.37 48.19
12 2004:09:06 4.3 01:06:42.34 136.92 33.22 16.37 42.39 136.92 33.22 40.00
13 2004:09:06 4.2 01:12:24.69 137.02 33.10 16.74 24.72 137.02 33.10 36.00
14 2004:09:06 4.5 01:13:56.01 136.95 33.02 32.13 56.05 136.95 33.02 43.00
15 2004:09:06 4.7 02:34:09.18 137.01 33.07 17.60 09.25 137.01 33.07 36.54
16 2004:09:06 3.9 08:20:49.78 136.89 33.27 16.20 49.81 136.90 33.25 47.05
17 2004:09:06 3.7 13:56:12.41 137.07 33.14 16.35 12.37 137.07 33.13 41.74
18 2004:09:06 4.2 15:35:44.21 137.07 33.11 16.56 44.22 137.07 33.11 37.95
19 2004:09:06 4.1 19:39:46.62 137.21 33.12 20.59 46.84 137.20 33.12 35.15
20 2004:09:06 3.8 23:29:50.28 136.77 32.96 18.85 50.30 136.78 32.95 42.00
21 2004:09:07 3.8 02:23:36.96 136.78 32.96 21.28 37.08 136.78 32.97 37.00
22 2004:09:07 3.6 02:49:21.83 136.73 32.96 18.35 21.82 136.73 32.97 35.00
23 2004:09:07 3.8 10:37:09.08 137.17 33.15 18.86 09.11 137.17 33.15 37.86
24 2004:09:07 3.5 14:45:54.88 137.43 32.92 16.16 54.64 137.43 32.92 42.57
25 2004:09:07 3.7 15:51:49.14 137.43 32.92 17.95 48.84 137.43 32.92 43.34
26 2004:09:08 4.1 02:20:31.50 136.71 32.94 17.13 31.36 136.71 32.93 35.00
27 2004:09:08 3.6 03:58:17.69 136.75 32.94 18.02 17.55 136.75 32.94 38.81
28 2004:09:08 3.6 04:42:50.54 136.82 33.40 16.01 50.46 136.81 33.41 39.29
29 2004:09:09 3.8 00:13:44.76 136.94 33.24 15.68 44.92 136.94 33.24 38.31
30 2004:09:09 4.0 03:50:42.88 137.26 33.11 17.17 42.96 137.26 33.11 43.48
31 2004:09:09 3.5 09:18:51.69 136.70 32.92 16.08 51.66 136.70 32.92 31.56
32 2004:09:10 3.7 11:10:32.91 136.67 33.08 17.61 33.00 136.66 33.07 37.28
33 2004:09:11 3.6 20:04:48.24 136.77 32.88 18.48 48.48 136.77 32.89 35.03
34 2004:09:12 3.5 09:52:54.51 136.79 33.44 15.00 54.39 136.81 33.42 40.85
35 2004:09:13 3.5 13:50:16.34 137.18 33.10 18.16 16.41 137.18 33.10 39.85
36 2004:09:25 3.5 08:51:06.80 136.71 32.90 16.85 06.87 136.71 32.90 36.00
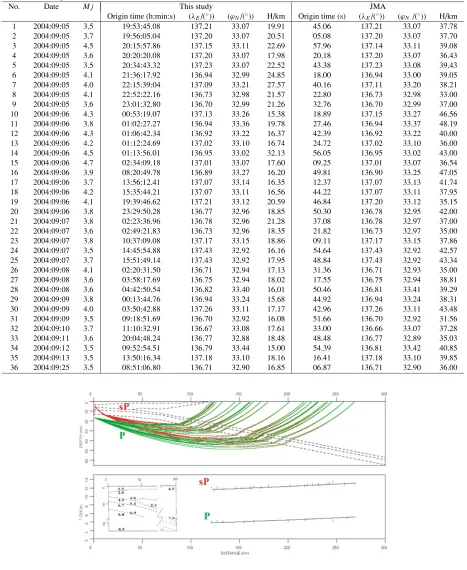
Fig. 4. Ray path diagram ofPwaves ands Pwaves (top panel) and comparisons of travel times between the observed values (vertical bars) and the traced values (curves). Inset shows theP-wave velocity model from an OBS seismic experiment. The upper and lower layer velocities are given for each layer, with the exception that a constant velocity was used in the seawater layer. TheS-wave velocities are computed by a constantV p/V sratio of 2.5 for the sedimentary wedge layer and 1.73 for other layers. A reduced velocity of 8 km/s has been applied. The example with a focal depth of 21.3 km is event 17 listed in Table 1.
with initial conditionsx =x0,z =z0, θ =θ0(Cˆerven´yet
al., 1977: equation 3.19’). The variableθis the angle be-tween the tangent to the ray and the z axis. The z coordinate is the positive downward. The point (x0,z0) is the source location, andθ0is the take-off angle.
4.
Data
fore-Fig. 5. Epicenter distribution of earthquakes with magnitudes greater than 3.5 in the period between September 5 and September 30, 2004 listed in the JMA catalog. Solid circles indicate events with more than sixs Pphase identifications; open squares. with one to fives P
phase identifications; pluses, withouts Pphase identifications. Four large pluses indicate events with magnitudes greater than 6. Curved line shows the Nankai Trench.
shock and the Mw=7.5 mainshock) had magnitudes larger than Mw=7.0, two (the Mw=6.7 aftershocks) had magni-tudes of Mw=6.0–6.9, seven had magnitudes of Mw=5.0– 5.9, 68 had magnitudes of Mw=4.0–4.9, and 146 had mag-nitudes of Mw=3.5–3.9. The arrivals of s P waves were identified on seismograms recorded at Hi-net, which has been operated by the Japanese National Research Institute for Earth Science and Disaster Prevention (NIED) since 1999. Of these 225 events, 36 hads P phase identifications at more than or equal to six stations (solid circles in Fig. 5), and 39 hads P phase identifications at one to five stations (open squares in Fig. 5). For the foreshock and the main-shock, pairs of later P and S phases were recorded after the initial PandSphases, which are different from thes P
phases. The 1-D P- andS-wave velocity structure (Fig. 6) used in double-difference analyses are derived from Nakan-ishiet al.(2002) and Obanaet al.(2003).
For the 36 events with more than sixs P identifications, we obtained hypocenters and origin times by includings P
phases in the double-difference earthquake location algo-rithm. There was a total of 144 unknowns for the latitudes, longitudes, depths, and original times of each event, and 2355 equations for P waves, 2040 forS waves, and 1004 fors P waves.
5.
Results
The relocation results of the 36 earthquakes are listed in Table 1 and shown in Figs. 7, 8, and 9. The seismic ac-tivity started with a Mw=7.3 foreshock on a north-dipping reverse fault plane striking in nearly an east-west direc-tion. After the foreshock, most events took place along the deformation front of the Nankai Trough (Fig. 8(a)). The Mw=7.5 mainshock occurred about 5 h after the foreshock on a multiple faulting with primarily two different fault planes: a northwest-tending strike-slip fault plane and a south-dipping reverse fault plane (Miyoshi and Ishibashi, 2005; Park and Mori, 2005; Satake et al., 2005; Yagi, 2005). After the mainshock, earthquakes extended in both the northwest and southwest directions from the location of
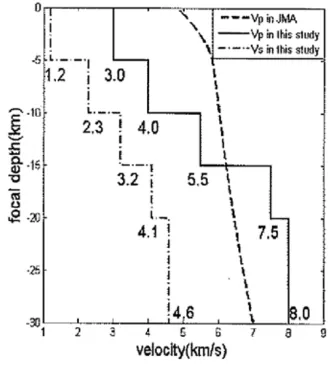
Fig. 6. Comparison of velocity models. V pis used by JMA (the dotted line);V pandV sare used in double-difference analyses (the solid line and the broken line, respectively).
the mainshock (Fig. 8(b)). Two major aftershocks occurred on September 7 and September 8, respectively, in a similar location. After the first major aftershock, some small after-shocks seemed to have been distributed at the southeast and southwest of the whole region of aftershocks (Fig. 8(c) and (d)).
The Moho discontinuity in the focal area of the 2004 earthquake offshore of the Kii peninsular is about 13 km in southeast and about 15 km in northwest (Nakanishiet al., 2002). Focal depths of the 36 events relocated in this study range between 15 and 35 km, which are about 15 km shal-lower than the JMA locations and almost the same depth as the deep branch of the OBS locations (Fig. 9(a)). The fo-cal depths increased with the increases in the observed time
(c) (d)
Fig. 8. Map views of epicenters for several time periods: (a) time from the foreshock to the mainshock, (b) time from the mainshock to the first major aftershock, (c) time from the first aftershock to the second major aftershock, (d) time after the second major aftershock. Epicenters of 36 events together with event number are relocated in this study. Focal mechanisms of the foreshock and the mainshock are by Yagi (2005) from teleseismic waveform inversion. Other symbols are the same as those used in Fig. 5.
(a)
(b)
Fig. 9. (a) A cross-section of relocated hypocenters along the plate-subduction direction AB (in the inset) with 2-D velocity boundaries (after Nakanishi
separations between thePands P phases (Fig. 9(b)). The accuracy of absolute hypocenter locations is gener-ally controlled by several factors, including the accuracy of velocity structure, available phases, arrival-time reading ac-curacy, and the network geometry (Pavlis, 1986). In this study, the location accuracy was constrained by the double-difference analyses with s P phases. The stations used in this study had an azimuthal gap of about 260◦, which meant that the poor network geometry alone would cause misloca-tions of about 0.25 km in the epicenters and about 1 km in the depths (Baiet al., 2006). All of the stations are located north of the region of the aftershocks, which caused the lo-cation errors in the north-south direction to be larger than those for the east-west direction.
6.
Discussion and Conclusions
Locating earthquakes in offshore regions is problematic due to the uncertainties in the local velocity structure, the lack of near-source recordings, and poor azimuthal cover-age of stations. We included the travel times of the s P
phases in the double-difference earthquake location algo-rithm to improve the accuracy of depth determination. All events were located in the oceanic uppermost mantle. Be-tween the period of the foreshock and the mainshock, events took place along the deformation front of Nankai Trough. After the mainshock, events extended in both the northwest and southwest directions from the location of the main-shock. Following the first major aftershock, some events seemed to be distributed at the southeast and southwest of the whole region of aftershocks.
There might be some uncertainties for identifying later phases, such as the sediment-basement reflections (sd Pand
pd P), the sediment reflections (pP), and the water-surface reflection (pwP) (e.g., Pearce, 1981; Engdahl and Billington, 1986). The sea bed and sea surface usually have a high impedance contrast, and as a result of some complications it could be possible thats P arrives at about the same time as pwP. However, if the amplitude of the later phase between P- andS-wave arrivals is larger than that forPwave, its origin should beS.
The Tonankai earthquake (Mw=8.0) of December 7, 1944 and the Nankai earthquake (Mw=8.2) of December 21, 1946 occurred offshore of southwest Japan in this re-gion. The coseismic rupture zone of the 1944 Tonankai earthquake estimated by tsunami and geodetic data (Ando, 1975) is shown along the top of the Fig. 9(a). Mi-croearthquake activity is low in the rupture area of the Tonankai earthquake, whereas it is higher in trench-outer rise region (Seno, 2005; Sakaiet al., 2005, see the top of Fig. 9(a)).
The effective elastic thickness of the PHS in the focal region, estimated from the seafloor age, is about 35 km (Yoshioka and Ito, 2001). Most of the hypocenters located by JMA that are deeper than 35 km might not be reason-able estimates. It is considered that reverse fault events tend to occur prior to, and normal fault events tend to oc-cur after, a large nearby interplate earthquake (Layet al., 1989). The occurrence of the 2004 earthquake offshore of the Kii peninsula with reverse fault plane in the trench-outer rise region may suggest that the compressional stress is
ac-cumulating in the adjacent interplate region and, therefore, there is a potential for future large earthquakes.
Acknowledgments. This research was financially supported by the Sasakawa Scientific Research Grant from the Japan Science Society (17-064). The waveform data used in this study was provided by the Hi-net and collected into CD-ROM by Dr. Shiro Ohmi. Thanks are due to Drs. James Mori, Eric A. Bergman, E. Robert Engdahl, Takuo Shibutani and Kiyoshi Ito for many comments on the manuscript. We are also grateful to the EPS editor and reviewers, Drs. David Schaff and Norihito Umino for constructive suggestions.
References
Ando, M., Source mechanism and tectonic significance of historical earth-quake along the Nankai Trough, Japan,Tectonics,27, 119–140, 1975. Bai, L., T. Z. Zhang, and H. Z. Zhang, Multiplet relative location approach
and waveform correlation correction and their application,Acta Seismol. Sinica,16, 606–615, 2003.
Bai, L., Z. L. Wu, T. Z. Zhang, and I. Kawasaki, The effect of distribu-tion of stadistribu-tions upon locadistribu-tion error accuracy: statistical tests based on the double-difference earthquake location algorithm and the bootstrap method,Earth Planets Space,58, e9–e12, 2006.
Cˆerven´y, V., I. Molotkov, and I. Pˇsencˆık, Ray method in seismology, Uni-versity of Karlova, Prague, Czechoslovakia, 1977.
Enescu, B., J. Mori, and S. Ohmi, Double-difference relocations of the 2004 off the Kii peninsula earthquakes,Earth Planets Space,57, 357– 362, 2005.
Engdahl, E. R. and S. Billington, Focal depth determination of central Aleutian earthquakes,Bull. Seismol. Soc. Am.,76, 77–93, 1986. Engdahl, E. R., R. Hilst, and R. Buland, Global teleseismic earthquake
relocation with improved travel times and procedures for depth deter-mination,Bull. Seismol. Soc. Am.,88, 722–743, 1998.
Gamage, S. S., Offshore double-planed shallow seismicity in the north-eastern Japan forearc region revealed bys Pdepth phase, Master thesis, Tohoku Univ., 96 pp, 2005.
Ishikawa, Y., The shape of the Philippine Sea slab,Journal of Geography, 110, 592–601, 2001 (in Japanese with English abstract).
Lay, T., D. H. Christensen, L. Astiz, and H. Kanamori, Temporal variation of large intraplate earthquakes in coupled subduction zones,Phys. Earth Planet. Inter.,54, 258–312, 1989.
Menke, W. and D. Schaff, Absolute earthquake locations with differential data,Bull. Seismol. Soc. Am.,94, 2254–2264, 2004.
Miyoshi, T. and K. Ishibashi, A tectonic interepretation of NW-SE strike-slip faulting during the 2004 off the Kii peninsula earthquakes, Japan: Probable tear of the Philippine Sea plate,Earth Planets Space,57, 1115–1120, 2005.
Nakamura, M., H. Watanabe, T. Konomi, S. Kimuta, and K. Miura, Char-acteristic activities of subcrustal earthquakes along the outer zone of southwestern Japan,Annu. Disaster Prevention Res. Inst., 40 B-1, 1997 (in Japanese with English abstract).
Nakanishi, A., N. Takahashi, J.-O. Park, S. Miura, S. Kodaira, Y. Kaneda, N. Hirata, T. Iwasaki, and M. Nakamura, Crustal structure across the coseismic rupture zone of the 1944 Tonankai earthquake, the cen-tral Nankai Trough seismogenic zone,J. Geophys. Res.,107, doi: 10. 1029/2001JB000424, 2002.
Obana, K., S. Kodaira, Y. Kaneda, K. Mochizuki, and M. Shinohara, Mi-croseismicity at the seaward updip limit of the western Nankai Trough seismogenic zone,J. Geophys. Res.,108, doi: 10.1029/2002JB002370, 2003.
Park, S. -C. and J. Mori, The 2004 sequence of triggered earthquakes off the Kii Peninsula, Japan,Earth Planets Space,57, 315–320, 2005. Pavlis, G. L., Appraising earthquake hypocenter location errors: a
com-plete practice approach for single-event locations,Bull. Seismol. Soc. Am.,76, 1699–1717, 1986.
Pearce, R. G., Complex P waveforms from a Gulf of Aden earthquake,
Geophys. J.,64, 187–200, 1981.
Sakai, S., T. Yamada, M. Shinohara, H. Hagiwara, T. Kanazawa, K. Obana, S. Kodaira, and Y. Kaneda, Urgent aftershock observation of the 2004 off the Kii peninsula earthquake using ocean bottom seismometers,
Earth Planets Space,57, 363–368, 2005.