Volume 2010, Article ID 302151,11pages doi:10.1155/2010/302151
Research Article
Coupled Simulation-Measurements Platform for
the Evaluation of Frequency Reuse in the 2.45 GHz ISM
Band for Multimode Nodes with Multiple Antennas
Guillaume Villemaud,
1Pierre-Franc¸ois Morlat,
1Jacques Verdier,
2J. M. Gorce,
1and Marylin Arndt
31CITI INRIA—INSA Lyon, 21 avenue Jean Capelle, 69621 Villeurbanne, France 2INL—INSA Lyon, 7 avenue Jean Capelle, 69621 Villeurbanne, France
3Orange Labs, France Telecom Group, 28 Chemin du Vieux Chˆene, 38243 Meylan, France
Correspondence should be addressed to Guillaume Villemaud,[email protected]
Received 16 June 2009; Accepted 23 November 2009 Academic Editor: Christian Ibars
Copyright © 2010 Guillaume Villemaud et al. This is an open access article distributed under the Creative Commons Attribution License, which permits unrestricted use, distribution, and reproduction in any medium, provided the original work is properly cited.
We address the problem of efficiently evaluating performance of concurrent radio links on overlapped channels. In complex network topologies with various standards and frequency channels, simulating a realistic PHY layer communication is a key point. The presented coupled simulation-measurement platform offers a very promising way of rapidly modelling and validating effective performance of multimode, multichannel and multiantenna radio nodes. An accurate analysis of radio channel is performed and then realistic performance with or without antenna processing is shown, verifying theoretical performance. Finally, available performance of concurrent communications on overlapped channels is exposed, showing that this approach is viable to enhance network capacity.
1. Introduction
It is obvious to say that properly evaluating performance of an entire wireless network is a very hard task. There is, for example, a deep gap to fill between purely theoretical approaches of radio link capacity and effective QoS results on an exploited network. Moreover, the increasing complexity of RF systems conduces to numerous hard issues such as antenna coupling, RF impairments influence, interference mitigation capability, and so forth.
Large efforts are made to offer more and more precise simulation of large-scale wireless networks (e.g., wireless sensor networks, WSNs) with enhanced modelling of radio link performance. The work in [1] discusses the accuracy of radio link modelling needed to ensure efficient network simulators. Authors had proposed an event-driven network simulator with a particular attention paid to PHY layer modelling, whereas only based on analytical formulation transforming SINR (signal-to-interference plus noise ratio)
information in terms of BER (bit error rate) or PER (packet error rate).
This relation between SINR and BER, whatever its formulation could be, is required to render the very complex behaviour of the radio link, far away from the often used spherical or omnidirectional models for nodes coverage.
A radio link suffers from additional effects of pathloss, shadowing and fading. To overcome the limitation of only defining a static threshold depending on distance (i.e., mainly pathloss exponent), it is important to take into account the temporal and spatial variability of the link. Thus the real capacity of a link is depending not only on an average value of the received power, but also on the temporal behaviour of this power.
try to represent all kinds of environments and topologies which is very difficult considering the very large number of possibilities. Indeed, numerous solutions are also proposed to replace empirical approaches based on measurements by wave propagation simulations. For example, [3, 4] propose some solutions to add statistical analysis upon a deterministic wave propagation tool. This kind of analysis allows a better prediction of wireless link capacity than a pure average power consideration. Hence, a good evaluation of wireless network performance could be based on associating precise wireless link models with a network simulator. A very interesting study of extracting radio link behaviour from measurements to feed GloMoSim simulator [5, 6] could be found in [7]. Also [8] investigates 802.11 links through measurement values used to drive a Markov chains model of the considered network.
The work in [9,10] propose interconnection of NS2 [11] with raytracing wave propagation tools to offer more realism in each link.
But even if the use of concurrent communications in different standards is a hot topic, it still remains an important need for a complete system evaluation of radio transmission scheme with enhanced realism both for radio channel and terminal’s architecture. Particularly, as far as we know, the influence of strongly overlapping interfering channel with a different communication standard is never considered. As we will present in the next section, trying to model performance in such a context without taking into account actual capabilities of terminal architectures often conduces to strong constraints on frequency reuse in dense areas. To tend to a realistic evaluation of a complete complex transmission scheme with concurrent signals, it is necessary to use some dedicated hardware connected to system-level simulator. System-level simulators are able to really create a radiofrequency signal based on the used communication standard that will be used in a measurement platform, and the measured received signal will be reinjected in the simulator to emulate the receiver part of the link.
In this paper, we propose the use of such a simulation-hardware connected solution to evaluate the capability of using overlapping channels in the 2.45 GHz ISM band with different PHY standards with an emphasis on a realistic multiple antenna architecture at the receiver. From our point of view, this approach is greatly necessary to address the whole complexity of such a system and to offer a good evaluation of expectable performance, possibly to extract better models for large-scale simulation. Moreover, adding a complete modelling of the receiver architecture with non-ideal RF components to a real radio channel measurement will offer a reduced development cycle of future terminals with enhanced capacity.
This paper is organized as follows.Section 2explains the context of overlapped channels and offered possibilities of whether a terminal can manage correctly two overlapped channels. Section 3 presents simulation and measurement tools used to precisely evaluate allowed performance in this study case. Detailed results comparing simulations and experiments are given in Section 4showing the wide area
of possible studies with this approach. Section 5 includes discussion and conclusion.
2. Study Case and Possible Scenarios
2.1. Context. The 2.45 GHz ISM band is well known to host
lots of competitive radio standards. Even if we only consider IEEE 802.11 standards, channels are defined with only 5 MHz separation while occupying at least a 20 MHz bandwidth.
So adjacent channels are strongly overlapping, therefore interfering. Then it is commonly admitted for WiFi system deployment that a frequency allocation panel (FAP) may use only 3 noninterfering channels in the whole band; otherwise, it leads to complex optimization problems [12]. Moreover, additional technologies such as Bluetooth or ZigBee are sharing this band, producing a large amount of possible interference.
2.2. Study Case. The study case we depict here is one
of a terminal able to receive a 40 MHz bandwidth signal (i.e., possibly containing up to 5 overlapped channels). Considering that this receiver has multimode capabilities (by the way of multiple dedicated chips or ideally software defined radio structure), we would like to appreciate possible performance while receiving information on two overlapped channels with different standards. Several approaches could be considered to mitigate or suppress interference. One way is to use interference cancellation techniques like multiuser detection as presented in [13,14]. This way becomes harder (i.e., resource consuming) in the case of interference from various standards. Another way is to use multiple-antenna techniques, enabling spatial rejection of the interfering signal. That is the way we here focus on, considering that more and more terminals tend to be equipped of two or more antennas in order to be compatible with new MIMO standards. MIMO systems require multiple antennas, hence multiple RF chains and digital processing capabilities, but all devices are not always using MIMO modes, depending on the network architecture and the radio channel conditions. However, multiple-antenna resources could be used to per-form effective interference mitigation for the simpler radio modes, by the way of operating a real multimode interference mitigation which is not dependent on the chosen standards.
For the sake of understanding, we will here present only results with non-MIMO standards, that is, without space-time coding, but results are not limited to mono-antenna standards. Hence, considered communication standards will be IEEE 802.11b and IEEE 802.11g.
AP802.11b/g AP802.11b/g
MU
Figure1: One multiband terminal receiving signals from two access
points on overlapped channels.
AP802.11b/g
MU
MU
Figure2: One multiband terminal receiving signals from one access
point and one other mobile unit (MU) on overlapped channels.
area networks (WPANs), wireless sensor networks (WSNs), or even body area networks (BANs).
We could refer to not only ZigBee or Bluetooth 3.0 as examples, but also lots of customized technologies. Subsequently results will be presented on two concurrent communications on 20 MHz bandwidth each, possibly over-lapping in the whole 40 MHz bandwidth of the receiver.
2.3. Scenarios. We could think about various topologies open
to improvement with through approach. The main point is that the studied node has multimode (802.11b and 802.11g), multichannel (40 MHz instantaneous received bandwidth) and multiantenna (2 or more branches). We refer to this kind of terminal as a multi-∗node.
Figures1to3present examples of possible usage enabling a more efficient reuse of frequencies.Figure 1depicts the case of a multi-∗ node receiving signals from two access points (AP) using overlapped channels. If this terminal is able to efficiently separate those two incoming signals, it could receive twice the throughput of a classical system without the need of using two widely spaced channels. It emphasizes that not only the FAP is simplified, but also that multi-route
MU
MU MU
Figure3: One multiband terminal receiving signals from two over
mobile units on nonoverlapped channels.
approaches or network coding could be used rather than collaborative schemes or distributed MIMO, more difficult to implement (i.e., supposing modifying of PHY or MAC layers). This scenario also offers the possibility for a multi-∗ node to get access to two different networks at the same time for two different applications without requiring two different hardwares.
In Figure 2, we consider a case of a multi-∗ node receiving information from an AP and another mobile user at the same time. This could be in the case of a mesh network, where multi-∗ node could act as a relay for the MU in bad receiving conditions. This also could be, as in the first scenario, to maintain two different connections simultaneously, for example, a laptop connected to Internet through the AP and to a wireless peripheral at the same time. Finally, Figure 3shows a case of a distributed network, ad hoc, or WSN, for example. Several neighbours could try to send data to the multi-∗node at the same time on different channels. For the sake of comprehensiveness, in this figure we represent two nonoverlapped channels, which could occur in the 40 MHz studied band, but one can understand that any combination of used channels is interesting to compare.
Of course, those presented scenarios are here to illustrate so possible network architectures where presented results offer interesting perspectives. Following results will be only discussed in terms of radio link behaviour and could be applied in any of those topologies.
WLAN RF
source WLAN
channel
WLAN RF source
WLAN
channel
WLAN
channel
WLAN
channel
WLAN
BERPER
WLAN
BERPER RF1
RF2 bb1
bb2
For EVM S1 PSDU
2 Decoded Bts
Signal
Signal generation MIMO channel
Multiantenna processing
[H]
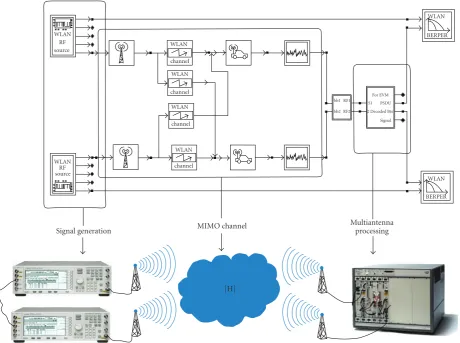
Figure4: 2×2 MIMO radio platform with connected solution with ADS software.
We will present in the next section the Agilent Platform used and the associated tools enabling to precisely evaluate the behaviour of such concurrent communications, and effective results are exposed inSection 4.
3. Simulation and Measurement Tools
3.1. Hardware Platform. Properly evaluating a complete
transmission scheme with concurrent communications is not so simple. Practical experiment with existing materials, like existing nodes, could be very informative on the global network behaviour, but do not bring enough information at the signal level, because of being mainly based on Received Signal Strength Indicator (RSSI) values. To be able to deeply analyze actual performance of radio links, high-quality measurement hardware is required to suitably generate and receive complex signals. Several solutions are proposed by different suppliers; we herein present our material from Agilent Technologies [15]. We will explain below the rationale behind the choice of this solution.
This radio platform is composed of (seeFigure 4)
(i) 2 Arbitrary Waveform Generators ESG4438C with 6 GHz maximum RF frequency and up to 80 MHz bandwidth
(ii) One Vector Signal Analyzer VSA89641 with 2 RF inputs, with 6 GHz maximum received frequency, and 40 MHz bandwidth.
We can use this platform to generate any kind of complex waveforms and connect any kind of antenna (omnidirec-tional or direc(omnidirec-tional, simple or dual polarized).
The two ESG could be finely synchronized in the case of a real MIMO system, but of course in the present study case could also be completely desynchronized and then emit different standards.
The two RF inputs of the VSA could also be connected to any kind of antennas, and the VSA chassis is mobile, enabling to test different radio channel conditions.
3.2. Software Tools. Our choice of hardware platform was
greatly influenced by the ability of interconnection with a very powerful system-level software solution: Advanced Design System (ADS) [15]. This software, very popular in the RF engineering community, offers a very wide range of libraries and also various simulation engines.
1E−05
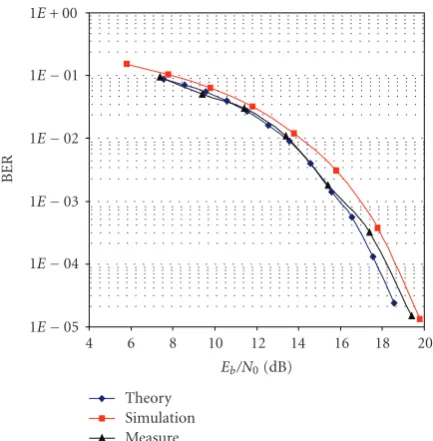
Figure5: 802.11b AWGN compared results.
(left-hand side of the figure) generates real-time domain 802.11b or g frames with random data payload.
Then, the key point is that we have two possible processes.
(i) Complete simulation scheme: the whole transmis-sion scheme for both signals is composed of sim-ulation blocks, modelling emitting antennas, radio channels, additive noise, receiving antennas, and receiver structures.
(ii) Connected solution: generated frames are used to feed ESGs, which really radiate signals through RF antennas and real propagation environment; thus, signals are received on other RF antennas connected to both RF inputs of the VSA.
In each of these cases, this interaction with software analysis could bring a lot of information: power level, frequency domain spectrum, time domain received frames, Error Vector Magnitude (EVM), constellation, and finally the more representative one for performance evaluation: bit error rate (BER). With the connected solution, received signals could be directly analyzed through VSA software tool, or could be reinjected in an ADS simulation to feed simulated receiver structures.
It is important to understand that each block inFigure 4
is a high-level representation, Ptolemy offering the possibility to finely describe the content of each part of the system down to discrete RF or digital components. Moreover, a great interest of this solution is cosimulation possibilities. For example, the dataflow simulator can be linked to a frequency domain simulator called harmonic balance in order to accurately take into account the influence of RF components spectral behaviour. Furthermore, cosimulation with Matlab is also helpful, enabling to easily implement signal processing algorithms in the receiver structure (e.g., multiantenna processing).
3.3. Radio Channel Analysis. To be sure that further
perfor-mance evaluation in the context of concurrent communica-tions is significant, first validation of our platform is there presented. Further, an analysis of a realistic indoor radio channel is exposed.
3.3.1. AWGN Validation. At first, in order to validate the
structure of our radio platform, first tests were realized in a Single-Input Single-Output (SISO) configuration under Average White Gaussian Noise (AWGN) condition, namely, a single path between emitter and receiver without shadowing or fading. Figure 5presents results we obtained for an 11 Mbps AWGN 802.11 b transmission.
For eachEb/No, 10 000 frames of 100 bytes are emitted and demodulated to accurately estimate the corresponding BER. The theoretical 11 Mbps 802.11b BER variation was computed according to [16]:
BER=1−√1
Whereas those measurements were not obtained in an anechoic chamber but in a close and static line-of-sight working condition, one can see a very good agreement between theory, pure simulation, and measurements.
Other tests were done for an uncoded 36 Mbps 802.11g SISO transmission, under an AWGN propagation channel. For such a data rate, a 16-QAM modulation scheme is used. The theoretical Symbol Error ProbabilityPsfor a M-QAM is computed considering two independent√M PAM modulations on both I- and Q-channels [17]:
Ps=1−
whereγb denotes the energy per bit-to-noise ratio (Eb/No) andQthe Gaussian function.
The relationship between the Signal-to-Noise Ratio (SNR), the transmission data rate, the coding rate Rc, the signal bandwidth (BW), andγb is given by
SNR= data rate·Rc
BW ·γb (4)
where BW=20 MHz, andRc=3/4 in the case of a 802.11g transmission [18].
In the end, the theoretical Bit Error Probability (BER) is
BER= Ps
1E−05
Figure6: 802.11g AWGN compared results.
Figure 6compares simulated, measured, and theoretical BER for an uncoded 36 Mbps 802.11g (16-QAM) transmission. In order to obtain a targeted BER value estimation (variance of 10−2), 10 000 frames of 200 bytes are transmitted in measure and simulation tests for each SNR value. A good matching between the different data can be observed (deviation is around only 1 dB).
3.3.2. Realistic Indoor Channel Analysis. While we could
be confident in our connected solution to model AWGN conditions, we can then try to analyze the main char-acteristics of the indoor radio channel we will use in our scenarios. Our aim is to study SIMO performance under realistic working conditions. In this context, antenna coupling, channel correlation, and also different propagation conditions must be introduced in the measurement system. Depending on the current capabilities of our platform, only 1 × 2 SIMO configuration is possible for each concurrent link.
Correlation of received signals and antenna coupling introduce loss of information diversity, and then a reduction of SIMO performance. Envelope correlationρbetween two signalsxandyis computed according to [19]:
ρ= E
Table 1presents correlation value in function of the antenna spacing d (a fraction of wave length λ) in the case of a NLOS (Non-Line-of-Sight) transmission configuration. For each distance value, we also give the BER (Bit Error Rate) value obtained thanks to SIMO processing applied to the two recorded signals used to compute the correlation (same 802.11b frames than previously).
Table1: Correlation value as a function of antenna spacing.
d 0.3 0.5 0.75 1 1.25 1.5
ρ 0.45 0.43 0.02 0.07 0.1 0.12
BER 0.02 0.03 0.03 0.01 0.02 0.01
A very low envelope correlation (ρ < 0.5) is observed. Obviously, a quite constant BER is also obtained, proving that for all distance between the two antennas correlation has no influence on system’s performance. For different antenna spacing, coupling between the two arms (S12 parameter) is computed and the maximum value, obtained for a distance of 0.3 λ, is equal to −20 dB. That is why coupling effect between receiving antennas could be considered negligible.
Another point is studying polarization behaviour. This point is often omitted in wireless link studies, whereas polar-ization diversity could be as rich as spatial one. By the use of dual-polarized patch antennas, we also have tested received power on each polarization (with only vertical or horizontal polarization at the emitter) and correlation between cross-polarizations. Results shown in Figure 7 emphasize the power balance between vertical and horizontal polarizations at the receiver for a vertically polarized emitter. This power balance reveals that in short range LOS conditions the emit-ted polarization could be 7.5 dB above the perpendicular one, but till NLOS conditions are established, the power is equally divided between horizontal and vertical polarizations at the receiver. Moreover, correlation factor between orthogonal polarizations was always found lower than 0.35. Therefore we could consider that resorting to dually polarized antennas offers the high degree of diversity needed for interference rejection.
Finally, fine characterization of the propagation channel was realized. To be able to describe multipath behaviour of indoor channels, we use the emission of repetitive pseudo-noise sequences (PN9). At the receiver, recorded received signals are correlated with the reference PN9 sequence in order to separate all delayed paths. This approach allows to extract the Power Delay Profile (PDP) of the measured channel, and also to analyze the temporal evolution of this PDP on a long-term point of view. One example of measured PDP in indoor multipath environment is given inFigure 8.
The measured NLOS channel used has a delay spread much less important (about 76 ns, τrms =35 ns) than the often used channel model ETSI-A for office environment (delay spread=390 ns,τrms=50 ns) [20].
Amplitude distribution fits a Rayleigh law, which increases the interest of spatial diversity, and the coherence bandwidth of the considered multipath channel is 5.2 MHz, signifying that also frequency diversity has to be considered for 802.11g OFDM signals.
Therefore, some feedback in our connected solution was performed. Actually, in order to ensure an easier comparison between simulation and measurements, a customized multi-path channel block is defined in Ptolemy schemes fed with measurements data.
E12 E11 E10 E9 E8 E7 E6 E5 E4 E3 E2 E1
O5 O4 O3 O2 O1
APG
yEi xEi xC
yC xOi yOi 2
1
3
4 1 1 1 3 1 3
2 1
2 4 1
1 3 3 5 1 3
(a)
−8
−6
−4
−2 0 2
E11 2 E11 1E10 3 E10 4 O4 3 O4 1 E7 2 E7 1 E5 1 E4 1 E4 3 E3 3 E3 1 E2 2 E2 1 O2 3 O2 2 O1 3 O1 1 E1 4 E1 2 E1 11
(b)
Figure7: Map of indoor polarization measurements and average power balance (in dB) between vertical and horizontal polarizations at
receiving points.
−80
−70
−60
−50
−40
−30
−20
A
m
plitude
(dB)
0 0.5 1 1.5 2 2.5
Time (s) ×10−6
Figure8: Power delay profile.
ETSI-A models, and this also is a reduction of the number of simulated paths, that is, reduction of simulation time. Consequently, we have a finely tuned connected solution, permitting a quick comparison between simulated and measured performances. This platform will then be used in the next section to analyze possible performance with multi-∗devices.
4. Simulated and Experimental Results for
Multi-
∗Nodes
4.1. Monomode Performance. Let us remind here that studied
multi-∗ nodes have a receive bandwidth of 40 MHz (hence multichannel; seeFigure 9), multimode capability (802.11b
or 802.11g received frames), and multiantenna structure. A first point is to verify available performance with multi-antenna processing in this kind of architecture.
Lots of different algorithms exist to take advantage of spatial diversity and to combine different signals arriving at the same receiver [21]. In our case, we consider mobile receivers mostly used in indoor environments, with large angular spread, so it is very difficult to calculate the Direction of Arrival of Signal of Interest with algorithms such as ESPRIT or MUSIC [22] which also have an important computational complexity.
Therefore we prefer to take advantage of the training sequence used in 802.11 receivers [18] and to compute the optimal combination (Figure 10) of different signals with the help of an adaptive algorithm with a Minimum Mean Square Error (MMSE) criterion.
A simple adaptive algorithm is the Least Mean Square (LMS) which has a low complexity of O(N), but this algorithm has a very slow convergence.
Taking into account that the training sequence time of an 802.11g burst is small, it is preferable to use SMI which offers a faster convergence, even if SMI has a greater complexity of
O(N3).
We apply the Sample Matrix Inversion (SMI) algorithm [23] in the temporal domain, directly after downconversion on anNelements array. The array element spacing isλ/2 with
λthe being wavelength.
We define the signals at the element inputs by
s1(i),. . .,sN(i) and the input signal vector by
S(i) = [s1(i),. . .,sN(i)]T (7)
whereT denotes the transpose operation.
−180
2.412 2.422 2.432 2.442 2.452 Frequency (GHz)
2.412 2.422 2.432 2.442 2.452 Frequency (GHz)
2.412 2.422 2.432 2.442 2.452 Frequency (GHz)
Figure9: Example of received 40 MHz signal on one antenna and obtained signals after channel filtering.
S1
Figure10: Diversity combining structure.
number of sample of the training sequenced):
R= 1
whereHdenotes the transpose and conjugate operation.
r= 1 to different signals, an approximate solution to the MMSE problem is calculated as
w=R−1·r. (10)
Of course, results presented in this paper using connected solution will only use two branches of diversity but results could be extended to larger cases.
Dedicated Matlab codes were developed for ADS cosim-ulation for two purposes. The first one is the detection of
received signals on each RF inputs of the VSA; the second one is to apply SMI algorithm to signals after all steps of synchronization performed by ADS blocks.
As for first results of our multiantenna testbed, we can see on Figures11and12the bit-error-rate performance of 1×2 SIMO transmissions (i.e., one emitting antenna and two receiving antennas) compared to a classical SISO case for both standards in a simple AWGN channel. In both case, we retrieve the well-known consideration that in an AWGN channel a diversity structure of order 2 produces a 3 dB decrease of required SNR for a targeted BER.
Another point presented in Figure 13 is the available diversity depending of channel characteristics. As previously discussed in Section 3.3.2, studied multipath channel with our radio platform is shorter than ETSI-A model. Conse-quently, BER performance appears better for an equivalent SNR, while diversity degree is quite the same, offering the same rejection capacity.
4.2. Multi-∗ Performance. In multi-∗ operating mode, we
10−5
10−4
10−3
10−2
10−1
100
BER
−2 0 2 4 6 8 10
Eb/N0(dB)
SISO AWGN simulation SISO AWGN measure
SIMO AWGN simulation SIMO AWGN measure
Figure11: BER versusEb/Nofor an 802.11b transmission with one
or two received antennas in an AWGN channel.
10−5
10−4
10−3
10−2
10−1
100
BER
0 2 4 6 8 10 12 14
Eb/N0(dB)
SISO AWGN simulation SISO AWGN measure
SIMO AWGN simulation SIMO AWGN measure
Figure12: BER versusEb/Nofor an 802.11g transmission with one
or two received antennas in an AWGN channel.
also called channel spacing Δ, is then varied from 0 (co-channel interference) to 15 MHz.
Table 2summarizes mean measured values obtained with our radio platform. We compare BER obtained with or with-out SIMO processing at receiver. Obviously, with co-channel interference in SISO configuration, radio links are unusable and BER reaches 0.5. In this cochannel configuration, SIMO processing does not bring a sufficient performance enhancement to expect channel reuse. But it can observe a quick decrease of BER till a 5 MHz channel spacing with the use of multiantenna processing. This supposes that multi-∗ devices allow a better frequency reuse and can support
10−6
10−5
10−4
10−3
10−2
10−1
100
BER
4 6 8 10 12 14 16 18
Eb/N0(dB)
SIMO ETSI-A SIMO multipath measured
SIMO multipath simulated SIMO AWGN measure
Figure13: BER versusEb/Nofor an 802.11g transmission with two
received antennas in different channels.
Table 2: Obtained BER with measured channels depending on
channel spacing and antenna configuration.
Δ 802.11b 802.11b 802.11g 802.11g
SISO SIMO SISO SIMO 0 MHz 0.5 0.4 0.5 0.4 5 MHz 0.3 0.08 0.4 0.07 10 MHz 0.2 0.01 0.35 0.02 15 MHz 0.01 0 0.01 1.2×10⁻⁴
simultaneous connections with different modes on strongly overlapped channels.
Of course, obtained BER values depend directly on exact operating conditions (emitters positions, received power, channel type, etc.). But in every tested condition we found the same global behaviour meaning that till a 10 MHz chan-nel spacing parallel communications could be maintained.
Another test is presented in Figure 15. On that case, channel spacing is fixed at 10 MHz. The 802.11b link (in red channel) is maintained as previously at the SNR level corre-sponding to a 5·10−3BER without any concurrent commu-nication in a SISO. Then the power of the 802.11g channel is progressively increased. BER curves are shown inFigure 16.
We can observe that in a SISO case, 802.11b link is rapidly degraded when the 802.11g interferer increases in power; thus, none of those two links appears exploitable. But with antenna processing (blue lines), we can see that an interesting tradeoffcould be found to ensure two parallel available radio links.
5. Discussion and Conclusion
SNR⇐⇒BER=5×10⁻³
SNR⇐⇒BER=5×10⁻³
8022.11b
Δ=variable 802.11g
NLOS
Multi-∗
Figure14: Definition of study case with overlapping channels.
Variable SNR
SNR⇐⇒BER=5×10⁻³
Δ=10 MHz
NLOS
Multi-∗
Figure15: Definition of study case with overlapping channels and variable power of 802.11g signal.
10−4
10−3
10−2
10−1
100
BER
−80 −78 −76 −74 −72 −70 −68 −66 802.11g received power (dBm)
802.11b SISO 802.11b 1×2 SIMO
882.11g SISO 802.11g 1×2 SIMO
Figure16: BER depending on 802.11g received power for a channel
spacing of 10 MHz in a multipath environment.
studied item. But as far as we know combining multiple modes with multiple antennas in multiple overlapped chan-nels was never considered, whereas it here appears to be an interesting way of enhancing spectral usage. This way of considering simultaneous connections could be compared to distributed or collaborative MIMO techniques, where several nodes transmit at the same time on common channels. But here we have shown that without any precoding and even with different standards we could reach interesting performance and ensure a better frequency reuse.
Our approach was to establish a complete connected solution with simulation-measurement coupling for a com-plete and fast analysis of complex radio links. This solution allows a great realism of node architectures and can be studied further on. We are now focusing on enhancing the simulation of RF architecture in order to design efficient terminal structures for multi-∗nodes.
One first step is a better simulation of realistic RF components, particularly of RF impairments. A study of
the impact of such impairments on effective radio link performance could be found in [24].
Another important point is to find efficient way of cre-ating multi-∗ nodes without notably increasing complexity and consumption. Some possible ideas are proposed in [25], but this aspect greatly depends on targeted networks.
From this point we can emphasize some observations. Multiplying degrees of freedom surely offers promising possibilities at the PHY layer in order to increase spectral efficiency of networks. Nevertheless, it remains that the number of available parallel channels is directly related to the number of antennas. To overcome this limitation, our approach needs to be combined with interference cancellation algorithms.
Furthermore, to be efficient in a mesh or ad hoc configuration, this approach needs to be studied in a cross-layer point of view, supposing that a common MAC cross-layer could use two different simultaneous PHY links.
Therefore, this coupled system-level simulation and mea-surement platform could bring some efficient evaluation of realistic radio links and could be used to feed network-level simulators with precise values. This platform could also be used to calibrate wave propagation prediction tools, or also to implement natively MIMO standards like WiMax or LTE. First results with this connected solution of frequency-agile RF architectures proposed for LTE-Advanced multi-band operation are very promising. Only this kind of high-quality hardware could offer the possibility of studying future possi-ble architectures at a reasonapossi-ble cost with trustapossi-ble results.
Acknowledgment
Authors wish to thank Orange Labs for supporting this work and Agilent technologies for collaborating on connecting solution development.
References
[2] P. Mary, M. Dohler, J.-M. Gorce, G. Villemaud, and M. Arndt, “M-ary symbol error outage over Nakagami-m fading channels in shadowing environments,”IEEE Transactions on Communications, vol. 57, no. 10, pp. 2876–2879, 2009. [3] G. De la Roche, X. Gallon, J.-M. Gorce, and G. Villemaud,
“On predicting fast fading strength from indoor 802.11 simulations,” inProceedings of the International Conference on Electromagnetics in Advanced Applications (ICEAA ’07), pp. 407–410, Torino, Italy, September 2007.
[4] C. Pereira, Y. Pousset, R. Vauzelle, and P. Combeau, “Sensi-tivity of the MIMO channel characterization to the modeling of the environment,” IEEE Transactions on Antennas and Propagation, vol. 57, no. 4, pp. 1218–1227, 2009.
[5] X. Zeng, R. Bagrodia, and M. Gerla, “GloMoSim: a library for parallel simulation of large-scale wireless networks,” in
Proceedings of the 12th Workshop on Parallel and Distributed Simulations, 1998.
[6] http://pcl.cs.ucla.edu/projects/glomosim/.
[7] G. Zhou, T. He, S. Krishnamurthy, and J. A. Stankovic, “Models and solutions for radio irregularity in wireless sensor networks,”ACM Transactions on Sensor Networks, vol. 2, no. 2, pp. 221–262, 2006.
[8] A. Kashyap, S. Ganguly, and S. R. Das, “A measurement-based approach to modeling link capacity in 802.11-measurement-based wireless networks,” inProceedings of the Annual International Conference on Mobile Computing and Networking (MOBICOM ’07), pp. 242–253, Montreal, Canada, September 2007. [9] I. Stepanov and K. Rothermel, “On the impact of a more
realistic physical layer on MANET simulations results,”Ad Hoc Networks, vol. 6, no. 1, pp. 61–78, 2008.
[10] J.-M. Dricot and P. De Doncker, “High-accuracy physical layer model for wireless network simulations in NS-2,” in
Proceedings of the International Workshop on Wireless Ad-Hoc Networks, pp. 249–253, Oulu, Finland, May-June 2005. [11] http://www.isi.edu/nsnam/ns/.
[12] G. de la Roche, R. Rebeyrotte, K. Jaffres-Runser, and J.-M. Gorce, “A QoS-based FAP criterion for indoor 802.11 wireless LAN optimization,” inProceedings of the IEEE International Conference on Communications (ICC ’06), vol. 12, pp. 5676– 5681, Istanbul, Turkey, June 2006.
[13] P. Mary, J. M. Gorce, G. Villemaud, M. Dohler, and M. Arndt, “Performance analysis of mitigated asynchronous spectrally-overlapping WLAN interference,” inProceedings of the IEEE Wireless Communications and Networking Conference (WCNC ’07), pp. 2099–2104, Hong Kong, 2007.
[14] P. Mary, J. M. Gorce, G. Villemaud, M. Dohler, and M. Arndt, “Reduced complexity MUD-MLSE receiver for partially-overlapping WLAN-like interference,” in Proceedings of the IEEE Vehicular Technology Conference (VTC ’07), pp. 1876– 1880, Dublin, Irland, 2007.
[15] http://www.home.agilent.com/.
[16] M. Borgo, A. Zanella, P. Bisaglia, and S. Merlin, “Analysis of the hidden terminal effect in multi-rate IEEE 802.11b networks,” inProceedings of the International Symposium on Wireless Personal Multimedia Communications (WPMC ’04), September 2004.
[17] J. G. Proakis, Digital Communications, McGraw-Hill, New York, NY, USA, 4th edition, 2000.
[18] IEEE Std 802.11g-2003, “Part 11: Wireless LAN Medium Access Control (MAC) and Physical Layer (PHY) specifica-tions: Further Higher Data Rate Extension in the 2.4 GHz Band”.
[19] K. Dietze, C. B. Dietrich Jr., and W. L. Stutzman, “Analysis of a two-branch maximal ratio and selection diversity system
with unequal SNRs and correlated inputs for a rayleigh fading channel,”IEEE Transactions on Wireless Communications, vol. 1, no. 2, pp. 274–280, 2002.
[20] “Channels Models of Hiperlan/2 in different indoor Scenar-ios,” ETSI EP BRAN 3ER1058B, March 1998.
[21] L. C. Godara, “Application of antenna arrays to mobile communications—part II: beam-forming and direction-of-arrival considerations,”Proceedings of the IEEE, vol. 85, no. 8, pp. 1195–1245, 1997.
[22] T. K. Sarkar, M. C. Wicks, M. Salazar-Palma, and R. J. Bonneau, Smart Antennas, Wiley Series in Microwave and Optical Engineering, Wiley-IEEE Press, New York, NY, USA, 2003.
[23] I. J. Gupta, “SMI adaptive antenna arrays for weak interfering signals,”IEEE Transactions on Antennas and Propagation, vol. 34, no. 10, pp. 1237–1242, 1986.
[24] P. F. Morlat, G. Villemaud, J. Verdier, and J. M. Gorce, “On the compensation of RF impairments with multiple antennas in SIMO OFDM systems,” inProceedings of the IEEE Vehicular Technology Conference (VTC ’06), pp. 484–488, Montreal, Canada, September 2006.