R E S E A R C H
Open Access
Fault compensation algorithm based on
handover margins in LTE networks
I. de-la-Bandera
1*, R. Barco
1, P. Muñoz
1, A. Gómez-Andrades
1and I. Serrano
2Abstract
In the context of Self-Organizing Networks (SON), this paper presents a novel cell degradation compensation algorithm based on handover margin modifications. The fault considered in this paper is a weak coverage use case so that the faulty cell will be active during the compensation, but its power will be abnormally lower than it should. Unlike the extensively studied cell outage use case, in this case, the modification of the faulty cell’s parameters can be considered as part of the compensation algorithm. In particular, this paper proposes to modify the handover margins for cell degradation compensation. To analyze the proposed algorithm, a set of simulations has been carried out using an LTE simulator with a realistic scenario. Results show that the proposed algorithm is able to improve the
degradation caused by the fault with a low effect in the neighboring cells under different conditions.
Keywords: LTE, Self-healing, Fault compensation, Self-Organizing Networks (SON), Mobility management, Fuzzy logic controller
1 Introduction
One of the key elements of the 3rd Generation Partner-ship Project (3GPP) recent standards of communications networks, such as LTE (Long-Term Evolution) and LTE-Advanced [1, 2], is the consideration of automated fea-tures. This kind of mobile communications networks are known as Self-Organizing Networks (SON). SON aim to cope with the significant increase in size and complexity experienced by the mobile communications networks in the last years. The number of users is increasingly high and services require higher data rates and a large amount of available radio resources; so, the management of the networks has become a very complex task. Moreover, when the 5G mobile networks emerge, the complexity and cost of these new networks will increase significantly [3, 4]. In this context, SON functions will be necessary to cope with the management of such a complex net-work. The goal of SON is to define a set of functionalities that allow to automate network management. By automat-ing network optimization and maintenance, it is possible to reduce operational expenditures (OPEX) and capital expenditures (CAPEX) [5].
*Correspondence: [email protected]
1Universidad de Málaga, Departamento de Ingeniería de Comunicaciones, 29071 Málaga, Spain
Full list of author information is available at the end of the article
SON functionalities are grouped in three types: self-configuration, self-optimization, and self-healing. The objective of self-configuration functions is to automati-cally define the configuration parameters of every new equipment of a network in the planning or in the deploy-ment phase. Self-optimization functions automatically modify network parameters during the operational phase in order to improve the network performance by adapting the network to changes of environment conditions. Self-healing functions allow to detect and diagnose perfor-mance failures that can affect the network without human intervention [6, 7]. When a failure is detected in a cell, it can be recovered (recovery function) or compensated (compensation function).
One of the fundamental use cases in self-healing is cell outage compensation (COC) [6]. A cell is in outage when it cannot carry traffic due to a failure. This function aims to reduce the degradation caused by a failure in a cell until the fault is resolved. The compensation can be made by modifying different configuration parameters in the net-work. These parameters usually are from the neighboring cells. All the modifications carried out by the compensa-tion algorithm must be reverted when the network failure is solved.
Several approaches that implement this function can be found in the literature. In [8], Amirijoo et al. present
different versions of a COC algorithm and analyze their effectiveness in different scenarios. Each version of the algorithm carries out the compensation by modifying different network parameters. The considered control parameters are the reference signal power (PRS), the uplink target received power level (P0), and the antenna tilt. The authors conclude that the P0 and the antenna tilt are the most effective for improving coverage, while P0 is the most effective for improving throughput. In [9], Asghar et al. present a COC algorithm based on propa-gation measurements that modifies the antenna tilt of the compensating cells in order to increase their coverage area in the outage zone. In [10], a COC algorithm based on P0 modifications is presented. The compensation is made taking into account coverage and quality objectives.
There are also other works that implement COC algorithms applied to different technologies. In [11], Apostolidis et al. present a fuzzy logic algorithm that com-pensates outage problems by modifying the transmission power of several access points in a Wireless Local Area Network (WLAN).
All the previous references modify only one parameter for compensating the outage. However, it is possible to find algorithms that consider more than one parameter. For instance, Saeed et al. [12] present a COC algorithm based on fuzzy logic that modifies the antenna tilt and the transmission power of the compensating cells. The same set of configuration parameters is used by Onireti et al. [13]. In that work, the compensation algorithm is based on reinforcement learning and it is applied to a heterogeneous network.
While the presence of COC approaches is not broad in the literature, different coverage and capacity optimiza-tion (CCO) algorithms can be found, which can also be applied to cell outage problems. One of the most com-monly used parameter for CCO in different technologies is the antenna tilt [14, 15]. Several optimization algo-rithms based on antenna tilt modifications can be found in the literature. Many of them are used as COC algo-rithms [16–18]. These works present different method-ologies. The method presented in [16] consists of two phases. During the first phase, the algorithm is used to find a near-optimal tilt angle. In the next step, the tilt angle value is fine-tuned through explorations of the near-optimal region. Such explorations enable the algorithm to respond to the dynamics of the network such as the failure of a neighboring cell. Razavi et al. [17] analyze dif-ferent reinforcement learning strategies for antenna tilt optimization. Moreover, the performance of each strategy is evaluated in three different network states: deployment, normal operation, and cell outage. In [18], a heuristic vari-ant of the gradient ascent method to optimize vari-antenna tilts is presented. The proposed method is capable of compensating a cell outage in an autonomous manner.
The optimization can also be made by modifying sev-eral parameters simultaneously in order to improve the results. Fehske et al. [19] adapt an optimization algorithm to a cell outage problem that modifies the antenna tilt and an offset related to the cell selection procedure in idle mode.
In all of these works, both for compensation and cov-erage optimization, the different algorithms have been applied to the same network failure, i.e., a cell outage.
However, there are many other network failures that can occur and affect the network performance [20]. These other faults (e.g., overshooting and weak coverage) may provoke an important degradation in the network so that the application of a compensation method is needed while the fault is identified and repaired. In these cases, the faulty cell is still active and that allows to consider the modification of its own parameters, and not only neigh-boring cells’ parameters, as part of the compensation method. This paper presents a degraded cell compen-sation algorithm, an issue that has not been previously considered in the literature. Specifically, the analyzed degradation consists of a coverage deterioration in a cell due to a reduction of its transmission power in the down-link. The transmission power reduction may be caused by wiring problems or a wrong parameter configuration. In this situation, the faulty cell is still carrying traffic although its coverage area is reduced due to the fault. Thus, the faulty cell can be considered for the compensa-tion. This paper proposes to use the handover (HO) mar-gin as a new parameter for cell degradation compensation. This parameter has been extensively used for network per-formance optimization. In that context, the objective of the HO margin modification typically has been the HO process optimization [21] or load balancing in case of a congestion situation [22] in macrocell scenarios. There are other works that investigate the HO management in other scenarios such as small cell or femtocell scenarios [23–26]. However, the HO margins have not been pre-viously considered for fault compensation. Even if both types of algorithms (i.e., compensation and coverage opti-mization) tune the same parameters (e.g., HO margins), in most cases, the changes made by each algorithm will be different, since their objectives are different.
In conclusion, the novelty of this paper is related to two main aspects:
• First, this paper considers a weak coverage fault (as a different problem as the cell outage problem
This paper presents a compensation algorithm with the aim of mitigating the effects caused by a weak coverage fault considering modifications of the faulty cell parameters as part of the compensation method. Moreover, the degradation produced by the fault will be different to the one produced by a cell outage.
• Second, this paper proposes a compensation algorithm based on HO margin modifications, including the faulty cell and its neighbors. The use of this parameter with a compensation objective is the second main contribution of this paper. The HO margin has been extensively used with optimization purposes, but it has not previously considered for fault compensation.
To the authors’ knowledge, there are no other works in the literature that consider other faults but cell outage in their compensation studies and no one presents a com-pensation algorithm based on HO margins modifications. The rest of this paper is organized as follows. Section 2 describes the considered weak coverage problem, the con-trol parameters and the system measurements consid-ered in the proposed compensation algorithm. Section 3 presents the proposed algorithm, and Section 4 shows the results obtained in the algorithm analysis. Finally, the conclusions are included in Section 5.
2 System model
2.1 Problem formulation
This paper analyzes a compensation method for a degraded cell that is carrying traffic even when it is affected by a fault. The degradation considered in this paper is a use case of weak coverage that occurs when the signal level received in a cell is below the minimum required level [27]. This problem may be caused by issues such as a wrong parameter configuration or wiring prob-lems, which provokes a reduction in the evolved Node B (eNB) transmission power. The transmission power decrease causes a limitation of the cell coverage in addi-tion to the received signal level reducaddi-tion.
In this work, the analyzed fault is modeled as a reduc-tion of the transmission power from the normal level (e.g., 46 dBm in macrocell [28]) to a lower level in the faulty cell. In particular, an offset, representing the reduction of the transmitted power, is defined. The transmission power, PowTx, of the faulty cell is defined as:
PowTx=PowTxmax−offsetTx (1)
where PowTxmaxis the maximum transmission power and offsetTx is a configurable parameter to model different levels of degradation.
2.2 Control parameters
One of the most important effects caused by the analyzed problem is the limitation of the faulty cell coverage. For this reason, the most interesting parameters to take into account for the compensation algorithm are those whose modifications affect the degraded cell service area. In this work, the HO margin has been considered. This param-eter dparam-etermines the radio quality conditions for users to change their serving cell. By modifying this parameter it is possible to control the service area of a cell.
The HO algorithm considered in this work is based on the A3 event defined by the 3GPP [28] which determines the condition that must be fulfilled to execute the HO. This condition is determined by the expression (2) and must be fulfilled for a specific time period given by the Time To Trigger (TTT) parameter.
(RSRPadj)≥(RSRPserv+HOM(serv,adj)) (2)
where RSRPservand RSRPadjare, in an LTE network, the Reference Signal Received Power (RSRP) received by the user from the serving and the adjacent cell, respectively, and HOM(serv,adj) is the HO margin defined between a serving cell and each of its adjacent cells. HOM(serv,adj) is the parameter used in the proposed compensation algo-rithm.
2.3 System measurements
To analyze the proposed compensation algorithm, a set of indicators that represent the network performance is defined. These indicators allow to assess the effectiveness of the proposed algorithm and to determine the possible negative effects derived from the configuration parameter modifications.
The considered system measurements are
• Retainability. This KPI represents the capacity of the network to maintain active connections under different environment conditions. Thus, this indicator is related to the number of dropped calls in a cell. In this work, a dropped call occurs when a user abnormally loses its connection due to problems in the connection quality or coverage. The following expression indicates how to calculate this KPI:
Retainability= Nsucc
Ndrops+Nsucc
(3)
whereNsuccis the number of successfully finished
connections andNdropsis the number of dropped
connections.
late HO problem. It is essential to consider this KPI since the proposed compensation algorithm is based on HOM modifications. These modifications may lead to a too late HO problem. This problem occurs when the RSRP received by a user from a certain neighboring cell is higher than the received from the serving cell but the expression (2) is not fulfilled. In this situation, the HO is not executed and the user connection may result in a dropped call if the RSRP from the serving cell is too low [29]. The too late HO problem appears when the HOM has high values which may occur due to the compensation algorithm modifications.
Specifically, this KPI can be calculated as the ratio between the number of HOs that have been finished successfully and the total number of HO attempts. The last one includes all the successful HOs and the failed HOs. In this work, only the failed HOs due to a too late HO problem are considered in order to analyze the possible effect of the compensation algorithm. Formally, the HOSR can be expressed as
HOSR= NSHO
NSHO+NTLHO
(4)
whereNSHOis the number of HOs that have been
executed successfully andNTLHOis the number of
dropped calls due to a too late HO problem.
• 50th percentile of signal-to-interference-plus-noise ratio (SINR50). This KPI represents the signal quality
experienced by the user in each cell. When a weak coverage problem affects a cell, this KPI is typically impacted. The main objective of the proposed algorithm is to improve this KPI. Although this fault mainly affects users in the cell edge of the faulty cell, the users in the cell center may be significantly degraded. For that reason, the 50th percentile has been selected. Thus, the group of users considered in the compensation is bigger than if a lower percentile was used.
• 50th percentile of uplink throughput (ThrUL50). This
KPI represents the signal quality experienced by the users in the uplink. One of the possible negative effects that the proposed algorithm may produce is an uplink degradation. The HOM modifications may provoke that a user connected to a certain cell changes to a neighboring cell that is further. In this situation, this user may be interfered by a second user connected to the first cell. For that reason, it is important to control the uplink performance during the compensation. In this work, the maximum uplink throughput achieved by a userkis estimated based on the experienced SINR [30]. The estimation is calculated using the truncated Shannon bound formula [31]:
ThrULmax SINRmax<SINR(k)
(5)
where SINRmaxand SINRminare SINR values where
maximum and minimum throughputs are reached, respectively, ThrULmax=514kbps,
SINRmax=14dB, SINRmin= −9dB, andβ=0.6. • BadRSRP. This indicator shows the number of signal
level (i.e., RSRP) measurements made by the users that are below a certain threshold (e.g.,−105dBm). This KPI identifies zones in the coverage area where the users are experiencing coverage problems that may avoid the connection establishment.
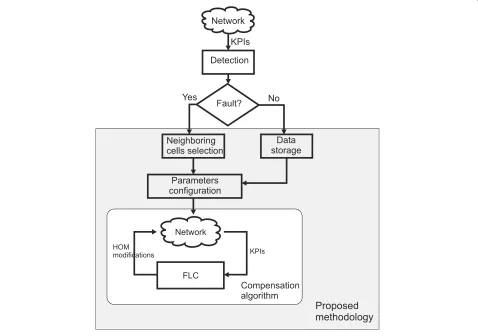
3 Cell degradation compensation algorithm When a cell suffers a weak coverage problem, its users experience a reduction in the received signal quality. The objective of the compensation algorithm is to improve the quality experience of the affected users by modify-ing some configuration parameters of the servmodify-ing and neighboring cells. In this work, the control parameter that has been modified for the faulty cell and its neighboring cells is the HOM. With these modifications, the algorithm tries to force users in the cell edge of the faulty cell to move to a neighboring cell. As a consequence, the ser-vice area of the faulty cell is reduced and its SINR50would be improved. Once the compensation algorithm is acti-vated, changes applied to the HOM may have a significant impact on neighboring cell performance. These changes may produce a degradation in some KPIs such as retain-ability. For this reason, the proposed algorithm includes the retainability from the neighboring cells as input of the algorithm.
Fig. 1Proposed methodology flowchart
indicates good user performance in that cell. Finally, the compensation algorithm is executed iteratively until the failure is solved. When this occurs the compensation algo-rithm has to be deactivated and the modifications made by the algorithm have to be reverted.
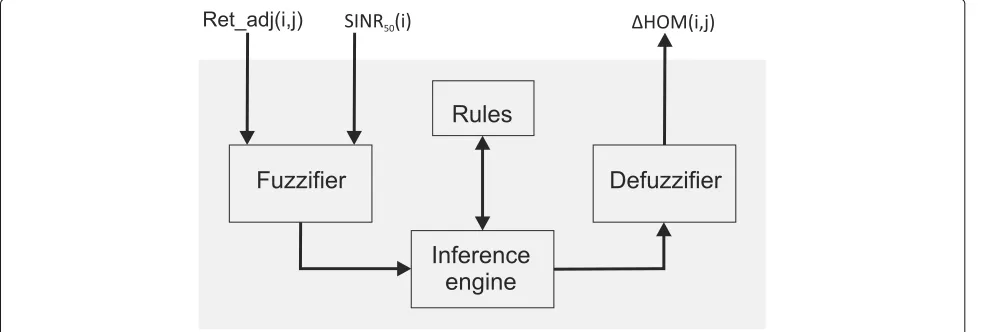
The proposed compensation algorithm has been imple-mented by a fuzzy logic controller (FLC) according to the Takagi-Sugeno approach [32]. Fuzzy logic is specially suitable to take decisions from imprecise information and allows to easily translate the operator experience expressed in linguistic terms into several rules with an IF-THEN syntax. Figure 2 shows the main blocks of an FLC. In the first stage, thefuzzifiertranslates the numeri-cal inputs into fuzzy sets using the membership functions. Each fuzzy set is associated with a linguistic term such as high or low. A membership function, denoted byμz(x), reflects the degree of membership of an input valuexto a fuzzy setz with a value between 0 and 1. The second stage of the FLC is performed by the inference engine. This block relates input fuzzy sets with output fuzzy sets by a set of IF-THEN rules. These rules determine dif-ferent situations that can occur, with the corresponding action that the FLC should execute. For the definition
of these rules, the knowledge and experience of human experts have been used. Finally, thedefuzzifierobtains an output crisp value from the output fuzzy set. Each rule produces a fuzzy output that corresponds to a constant value. Depending on the input values and their mem-bership functions, different rules can be activated with different degrees of truth. In this work, the degree of truth of a rulek(αk) is calculated using the product operator:
αk=μ(SINR50)·μ(Retainability) (6)
Each rule will produce the corresponding fuzzy output. The method for calculating the output crisp value is the weighted average of the rules’ outputs:
output=
N
i=1αi·oi
N
i=1αi
(7)
where N is the number of rules and oi is the selected output for the rulei.
Fig. 2Block diagram of a fuzzy logic controller
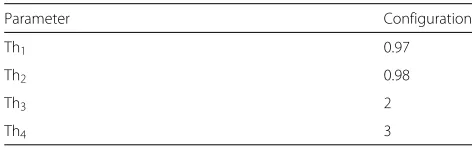
membership functions defined for each FLC input. For simplicity, the selected input membership functions are trapezoidal. The values used for the SINR50membership function definition (i.e., Thr3and Thr4) can be adapted to different cells, in which radio conditions may be different, as previously explained. These thresholds are calculated based on the historical average (or the average value in a specific time period) of the related KPI (i.e. SINR50) that have been stored during the normal operation of the network. In particular, Thr4 is obtained by round-ing the average value down to the nearest integer. Thr3 is defined 1 dB lower than Thr4. Thresholds related to retainability membership function (i.e., Thr1 and Thr2) have been configured as 0.97 and 0.98, respectively, since these values are similar to the typical limits acceptable by network operators. The FLC output is the modification to be applied to the HOM(i,j)per adjacency (expression (2)). The same modification with opposite sign should be applied to the HOM(j,i) in order to avoid an incre-ment of the ping pong effect. Table 1 shows the set of rules that has been defined, where L is low and H is
high, representing the linguistic terms of the fuzzy sets, while negative means a decrease of 1 dB, positive means an increase of 1 dB and null means no change in the HOM. An example rule for the proposed FLC is the fol-lowing: “IF (Ret_adj is high) AND (SINR50is low) THEN (HOM is Negative).” The obtained output crisp values are rounded to −1, 0, or 1 to be compatible with the 3GPP standards. In addition, the values of HOM are lim-ited to avoid excessive changes or possible instabilities in mobile networks. Specifically, the HOM values are limited to [−12 12] dB. During the compensation, the algorithm can stop the HOM modifications for a certain adjacency due to different situations: the current HOM value has achieved the limit value or the SINR50 of the faulty cell achieves a high value. The latter case means that the faulty cell has achieved a similar performance to that of a nor-mal situation. When this occurs, the SINR50is higher than Thr4and the rule 3 is activated. Without this limitation, the SINR50of the faulty cell would continue increasing but the performance of the neighboring cells may drastically decrease.
Table 1Fuzzy logic controller rules
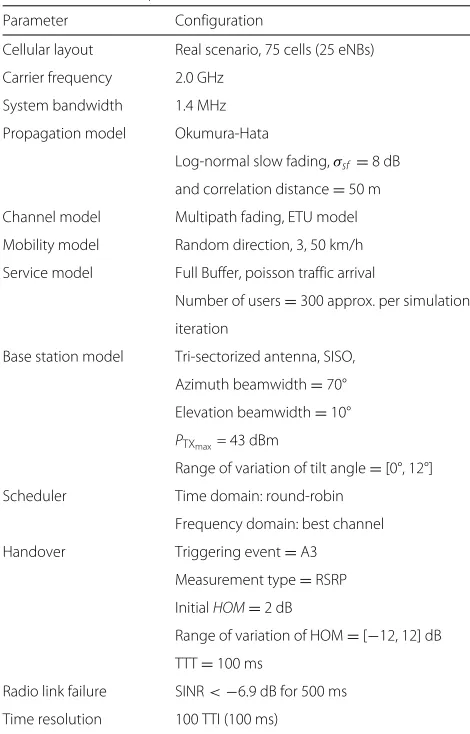
The proposed method has been tested using a dynamic LTE system level simulator implemented in MATLAB based on the one presented in [33]. The simulator includes the main radio resource management functions for the downlink such as handover, cell selection, admission control, and packet scheduling. Moreover, the simula-tor includes a function that estimates the power control performance in the uplink. This function is described in detail in [30]. Unlike [33], the simulated scenario is com-posed of 75 tri-sectorized cells and corresponds to a real LTE network that is currently in use. Some configuration parameters (location, antenna azimuth and tilt angles, and HOM) have been obtained from this real network. Table 2 summarizes the main configuration parameters of the simulations.
Figure 4 shows the simulated scenario. Specifically, Fig. 4a shows the scenario in a normal situation (i.e., no faults occur in the network). In addition, a cir-cle indicates the considered cells for the statistics. The remaining cells of the scenario are not considered in the results to avoid border effect. On the other hand, Fig. 4b presents the scenario when a weak coverage fault is affecting cells 10, 11, and 12. The location of the faulty site is shown in the figure. It can be seen that this fault produces a reduction in the coverage area of the faulty cells.
The objective of the analysis is to evaluate the proposed compensation algorithm when a weak coverage fault has occurred in the network. A complete set of tests has been carried out to analyze the algorithm performance in different situations. These tests include different levels of degradation in the faulty cell, scenarios with different user mobility conditions or different faulty cells simulta-neously. Each test is composed of different phases. The first phase presents the normal operation of the network (i.e., no faults occur). The second stage presents the net-work performance when the weak coverage fault occurs in one or several cells. During this phase, the faulty cell suffers a reduction of the transmission power, but the compensation algorithm is not activated yet. Finally, in the third phase, the compensation algorithm is activated. In all simulated cases, as described in Section 2.1, the weak coverage fault has been implemented using the parame-ter offsetTx. Each simulation comprises 30 iparame-terations in total (3 iterations of normal situation, 2 iterations of faulty
Table 2Simulation parameters
Parameter Configuration
Cellular layout Real scenario, 75 cells (25 eNBs)
Carrier frequency 2.0 GHz
System bandwidth 1.4 MHz
Propagation model Okumura-Hata
Log-normal slow fading,σsf =8 dB
and correlation distance=50 m
Channel model Multipath fading, ETU model
Mobility model Random direction, 3, 50 km/h
Service model Full Buffer, poisson traffic arrival
Number of users=300 approx. per simulation
iteration
Base station model Tri-sectorized antenna, SISO,
Azimuth beamwidth=70°
Elevation beamwidth=10°
PTXmax= 43 dBm
Range of variation of tilt angle=[0°, 12°]
Scheduler Time domain: round-robin
Frequency domain: best channel
Handover Triggering event=A3
Measurement type=RSRP
InitialHOM=2 dB
Range of variation of HOM=[−12, 12] dB
TTT=100 ms
Radio link failure SINR<−6.9 dB for 500 ms
Time resolution 100 TTI (100 ms)
situation and 25 iterations of compensation). Each itera-tion corresponds to an hour of the network performance. The duration of each iteration is selected to guarantee that the indicators are statistically stable. However, these times can be reduced when the algorithm is applied to a real network. In this case, the limitation is the periodicity of updating the KPIs that are used as inputs of the algorithm. This periodicity can be less than an hour (e.g., 15 min) so that the total time to achieve a compensation situation can be reduced.
The following subsections present the results obtained in the different defined tests. The considered faulty scenario and the algorithm settings are described for each simulation case. Finally, the last subsection presents a comparison between the proposed algorithm perfor-mance and a compensation approach based on tilt modi-fications.
4.1 Levels of degradation
a
b
Fig. 4Average received level of RSRP in the simulation scenario (dBm):anormal situation andbfaulty situation
values for the offsetTx parameter have been defined in order to implement different levels of degradation. Specif-ically, the simulations have been carried out with values of 7 dB (fault case 1), 10 dB (fault case 2), and 13 dB (fault case 3). The faulty cell is cell 11 (Fig. 4).
As described in Section 3, the first stage of the method is to select the neighboring cells in charge of the compen-sation and to obtain the algorithm settings. The former is obtained based on the number of HOs executed between cell 11 and the remaining cells of the scenario in the nor-mal situation. In this case the selected cells are 2, 3, 10, 12, 13, and 15. It can be seen that these cells correspond to the first tier neighboring cells of the faulty cell (Fig. 4). The latter is calculated based on the SINR50statistics obtained during the first stage of the simulation (i.e., normal situ-ation), as described in Section 3. Table 3 summarizes the algorithm settings used in this test.
Figures 5 and 6 show the results obtained in the simu-lations. In both cases a temporary evolution is presented. The KPIs shown in the figures correspond to the system measurements presented in Section 2.3. The results cor-respond to the faulty cell KPI values and the average value obtained for all the considered neighboring cells. Figure 5a shows the SINR50 temporary evolution for the different considered levels of degradation. Firstly, it can be seen that the initial value for the neighboring cells is low. As described before, the considered scenario is a real sce-nario where different cells present different performance. However, in this type of scenario, it is important to select
Table 3Algorithm settings
Parameter Configuration
Th1 0.97
Th2 0.98
Th3 2
Th4 3
a faulty cell that allows to analyze the fault avoiding border effects. For that reason, cell 11 has been selected as faulty cell because is located in the center of the scenario even if its neighboring cells present low values of SINR50. Addi-tional simulations have shown that the proposed algo-rithm achieves similar qualitative performance regardless the initial SINR50value.
As expected, the higher level of degradation (i.e., fault case 3) causes the most significant reduction in the SINR50 during the fault stage of the simulation. At this point, if no compensation algorithm is applied, the SINR50 values for the faulty cell will remain as low as in the faulty situation. However, once the compensation algorithm is activated, an improvement of this KPI is obtained for all the simulated levels of degradation. The final SINR50 value achieved by the algorithm is similar to that obtained in the normal situation, except for fault case 3, which is a bit lower. The final value of the HOM achieved by the algorithm is different depending on the considered level of degradation. In particular, the compensation sit-uation for fault case 1 can be achieved for a minimum HOM(i,j) value of −5 dB. However, in the fault case 3, a HOM(i,j)equal to−12 dB (i.e., the minimum allowed value) is needed to successfully compensate the fault. For the fault case 2, the minimum HOM(i,j)value obtained in the compensation stage is−7 dB.
Fig. 5Levels of degradation simulation results:aSINR50(dB) andbThrUL50(kbps)
situation without degrading the uplink of the neighboring cells. Figure 5b shows how the ThrUL50for the faulty cell is increased due to a coverage area reduction while the ThrUL50for the neighboring cells remains stable.
Moreover, Fig. 6 presents two other important KPIs. These KPIs are retainability (Fig. 6a) and HOSR (Fig. 6b). It can be seen that both retainability and HOSR values for the neighboring cells suffer a slight degradation. In the case of the retainability, this degradation is negligible since the smaller obtained value is higher than 98.5 %. In spite of the fact that the reduction observed in the HOSR is more noticeable, the final achieved value remains higher than 85 % which is an acceptable value.
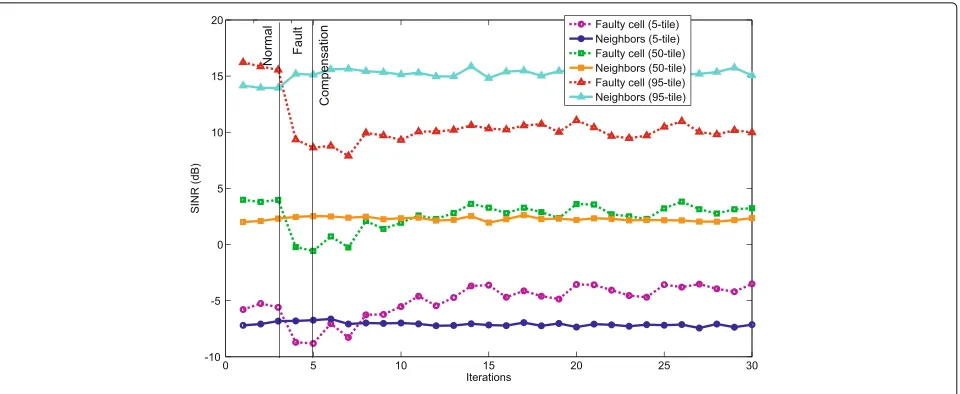
As remarked in Section 2.2, the fault considered in this work affects mainly users in the cell edge of the faulty cell. Although the proposed algorithm uses the 50th per-centile as input, it is also important to consider other percentiles to analyze the impact of the fault in different groups of users. Thus, if a 5th percentile of the SINR is considered, the analyzed information is related to the group of users that presents the worst quality performance
in a cell. Usually, these users are located in the cell edge. Conversely, when a high percentile (e.g., 95th) is selected, the information provided is related to users with the best quality performance. These users are usually located near the base station. Finally, the 50th percentile (i.e., the percentile used as input of the algorithm) provides infor-mation about users with a performance near the average.
Figure 7 presents the 5th, 50th, and 95th percentiles of the SINR when a reduction of 10 dB in the base sta-tion transmission power is considered. Firstly, it can be seen that the fault affects the users in all zones of the cell. The three percentiles present degradation when the fault occurs. In this work, the improvement of the 50th percentile is the objective of the compensation algorithm. For that reason, this indicator achieves after the com-pensation similar values to that of the normal situation. The compensation algorithm does not have a significant effect in the 95th percentile because the HOM modifica-tions mainly affect users in the cell edge. In fact, Fig. 7 shows that the final values achieved by the 5th percentile are higher than that of the normal situation. Therefore,
Fig. 75th, 50th, and 95th percentiles of the SINR in a weak coverage fault situation
although the proposed algorithm uses the 50th percentile as input, the cell edge of the faulty cell is successfully improved.
In summary, the weak coverage fault causes a degrada-tion in the SINR50of the faulty cell, which was successfully overcome by the proposed method, without degrading neighboring cells.
In the following tests, the considered transmission power reduction is 10 dB.
4.2 User mobility conditions
This set of tests aims to evaluate the proposed algorithm under different user mobility conditions. The user mobil-ity model included in the simulator works as follows. When a new user is created, a random direction is cal-culated and assigned to this user. Along the iterations, the user will move with the assigned direction and the configured speed. The mobility model takes into account
the scenario boundaries. In this work, it is not necessary to have a more realistic model because it is applied on an outdoor scenario where the user trajectories have a high randomness factor and they are hard to predict in comparison to indoor scenarios. In this case, it is enough that users can move along the scenario and do handovers between different cells. In other scenarios, such as small cells or femtocell indoor scenarios, the mobility model is more critical. The tests presented in this subsection consider different user speeds (i.e., 3 and 50 km/h). The selected cells and the algorithm settings are the same as those considered in the previous subsection.
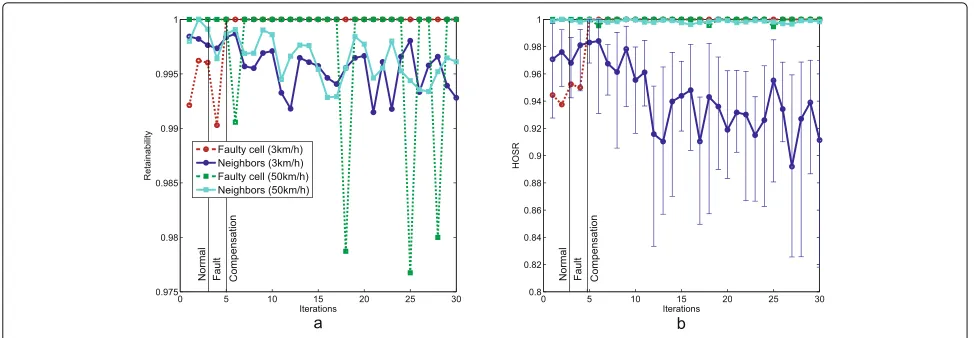
The obtained results are presented in Figs. 8 and 9. Both figures show the temporary evolution for the selected KPIs along the three simulated stages. In Fig. 8, the experienced quality both in uplink and downlink is pre-sented. Figure 8a shows the SINR50 evolution for the faulty cell and the average value for the neighboring cells.
Fig. 9User mobility simulation results:aretainability andbHOSR
The proposed algorithm works in a similar way indepen-dently of the user speed. In both cases a compensation situation is achieved with a similar SINR50 performance to that of the normal situation without degrading the experienced quality in the neighboring cells. The main difference between the two simulations is that such a similar compensation situation is achieved for different values of HOM. When the user speed is configured to 3 km/h, a higher HOM reduction is needed. Specifically, the HOM(i,j)achieved for the 3 km/h test is−7 dB and for the 5 km/h test is −5 dB. As for the uplink perfor-mance, Fig. 8b shows the ThrUL50. It can be seen that the changes made by the compensation algorithm do not decrease the throughput experienced by the users in the neighboring cells.
Finally, retainability and HOSR for the faulty and the neighboring cells are presented in Fig. 9a, b. Figure 9a shows that the retainability behavior for both user speeds is quite similar. Although the faulty cell with a user speed of 50 km/h presents a slight degradation, the smallest value achieved is near 98 %. Analyzing the results obtained for the HOSR, it may seem that when the user speed is configured to 3 km/h, the HOSR suffers an important degradation. However, it is not possible to compare the HOSR results for the two considered user speeds. The rea-son for that is related to the HOSR definition presented in Section 2.3. As described in that section, HOSR defini-tion depends on the total number of HOs executed in each cell. One of the main differences in the obtained results for different user speeds is that, when the users move faster, the number of HOs increases so that the number of failed HOs is less significant. Thus, in the case of a user speed equal to 50 km/h, Fig. 9b shows the obtained HOSR result in one simulation since the obtained value is statistically stable. However, when the user speed is equal to 3 km/h more simulations are needed. In this case, the average
value of the HOSR over a set of simulations is presented for neighboring cells. In addition, error bars have been included to show the variability of the results.
Specifically, a set of 20 simulations has been carried out. The configuration parameters are the same for all the sim-ulations. As described before, Fig. 9b shows the average value obtained over all the simulations. For the error bar calculation, the 5th and 95th percentiles have been con-sidered. Thus, the minimum value of each error bar corre-sponds to the 5th percentile of the HOSR values obtained in the simulations in each iteration. The maximum value of the error bars corresponds to the 95th percentile. The maximum error obtained for the 5th percentile and the 95th percentile are 0.101 and 0.067, respectively. It can be seen that, although the minimum HOSR value achieved is similar to 0.82, the average value is higher.
4.3 Several faulty cells simultaneously
SINR50 membership function took different values (i.e., Thr3=1 and Thr4=2), since the observed value in the normal stage were slightly smaller than for the other cells. Figure 10 indicates the average values obtained for the faulty cells and the average values for all the neighbor-ing cells in each of the three phases of the test. In this case, the obtained results are similar to those obtained in previous tests. Figure 10a shows the results related to the SINR50, which is degraded when the fault occurs and later improved when the compensation is made. The cost of this improvement is a slight reduction of the SINR50 of the neighboring cells. In Fig. 10b, the results about ThrUL50 are shown. As described before, the ThrUL50 experienced by the users of the faulty cell increase signif-icantly due to the coverage area reduction caused by the fault. During the compensation stage, neighboring cells do not show a significant degradation of the uplink so that the negative effect caused by the compensation algo-rithm in the neighboring cells is very limited. Figure 10c, d presents the obtained results for retainability and HOSR KPIs, respectively. In both cases, it is observed that the behavior of both KPIs is similar in the three stages of the simulation. Only the value of the HOSR of the neighboring cells presents a slight degradation. The minimum values achieved for the HOM are−4 dB for cell 10,−7 dB for cell 11, and−5 dB for cell 12.
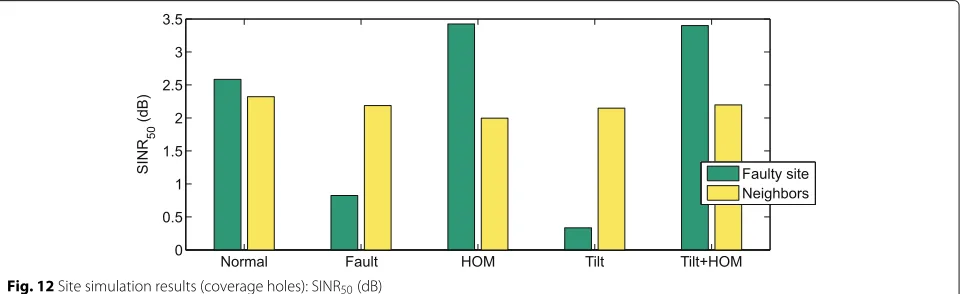
When a complete site is affected by the weak cover-age fault, other effects, in addition to the SINR degra-dation, may appear in the network such as a coverage hole. In order to analyze this situation, a different sim-ulation has been carried out. In this case, the antenna tilt of the considered cells (i.e., the faulty site and the
compensating cells) has been set to 7° in order to produce coverage holes when the weak coverage fault occurs. In this test, it is important to consider the BadRSRP indicator that provides information about users without coverage. Figures 11 and 12 show the obtained results. Firstly, it can be seen that the proposed method (HOM in the figure) is able to improve the SINR50of the faulty cell although the BadRSRP of the neighboring cells remains degraded. An alternative method based on tilt decrements (tilt) has been tested since it is the method most frequently used when coverage holes affect the network. This method achieves an improvement of the BadRSRP of the faulty cell and the neighboring cells (Fig. 11) but it is not able to improve the SINR50 of the faulty cell (Fig. 12). This is an impor-tant limitation since the main effect of the considered fault (i.e., weak coverage fault) is the signal quality degradation. The proposed solution in this case is to combine the com-pensation method based on HOM modifications with tilt modifications (tilt + HOM) in order to compensate the SINR degradation and the coverage holes. The combina-tion consists of a first phase with tilt modificacombina-tions and a second phase when the proposed algorithm is activated and the antenna tilt does not change. Results show that this last method achieves an important improvement in both BadRSRP and SINR50.
The second test shown in this subsection considers two faulty cells that are not cosited cells. The selected faulty cells are the original cell (i.e., cell 11) and one of its main neighboring cells (i.e., cell 3). The selected neigh-boring cells for cell 3 are 1, 2, 6, 10, 11, and 32. The neighboring cell 11 is not considered as neighboring cell for the compensation since in this test it is also affected
Fig. 11Site simulation results: BadRSRP
by the fault. The algorithm settings for cell 3 are the same as for cell 10 and described before (i.e., Thr3 =1 and Thr4=2).
Figure 13 shows the obtained results. All figures present the obtained results for the two faulty cells and the neigh-boring cells. It can be seen that in the two cases the results are similar. These results allow to conclude that the fact that more than one cell experiences the fault simultane-ously is not an impediment to successfully compensate the problem. In this case the minimum values for the HOM are−5 dB for cell 3 and−7 dB for cell 11.
4.4 Comparison with other approaches
Finally, a last test has been carried out in order to com-pare the proposed algorithm with another approach. The considered method for the comparison is based on tilt modifications since it is the method most frequently used for outage compensation. In particular, a sensitivity study
has been carried out. In this case, the faulty cell is cell 11 and the selected neighboring cells are cells 2, 3, 10, 12, 13, and 15. The initial antenna tilt angle of these cells are 4°, 2°, 5°, 4°, 5°, and 4°, respectively. The step used in the simu-lations is 1° because bigger values may produce significant variations in the KPIs. The minimum angle is limited to 0° in order to avoid negative values of the tilt angle.Several simulations have been executed in order to analyze dif-ferent combinations of tilt changes for the faulty cell and the neighboring cells. The strategy that obtains the best results is based on downtilting neighboring cells. Such changes produce an interference reduction in the faulty cell and allow to increase the SINR50 even when it is accepting more users from the neighboring cells. The rea-son for that is that the experienced quality in the cell edge of the faulty cell is improved.
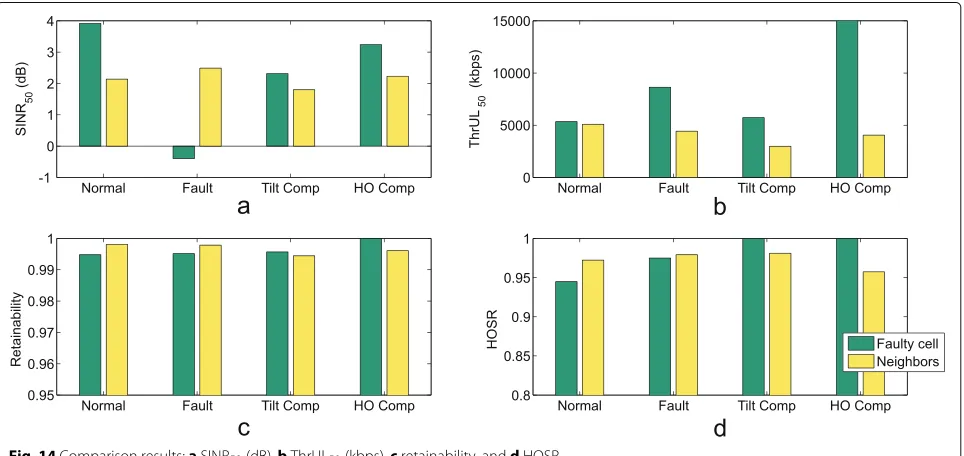
Figure 14 shows the results obtained for the tilt com-pensation (Tilt Comp) and the proposed algorithm (HO
Fig. 13Adjacent simulation results:aSINR50(dB),bThrUL50(kbps),cretainability, anddHOSR
Comp). The final achieved antenna tilt angle is 12° for all compensating cells. The Tilt Comp method allows to improve the SINR50 of the faulty cell. However, the HO Comp method achieves a higher value of the SINR50, which is more similar to the normal under no fault. Specifically, the HO Comp method achieved a 33.1 % of improvement compared to the Tilt Comp method. In addition, the Tilt Comp method presents a negative effect in the cell edge of the neighboring cells which is reflected by a reduction of the ThrUL50. On the other hand, the
HO Comp method presents a lower value of the HOSR although it remains above 95 %.
The Tilt Comp algorithm increases the service area of the faulty cell which is the opposite effect to that obtained with the proposed algorithm. A reduction of the service area of the faulty cell can be obtained by uptilting neigh-boring cells (Uptilt Comp). In fact, this strategy is usually applied to outage problems. However, this approach does not achieve a SINR50improvement since the interference in the faulty cell is also increased (Fig. 15).
Fig. 15Comparison results: SINR50(dB)
Based on the obtained results, it can be concluded that the two methods (i.e., HO Comp and Tilt Comp) have a similar behavior (although the HO Comp method achieves a better result). However, the Tilt Comp presents an important disadvantage. The strategy based on tilt modifications that has obtained the better results is based on downtilting the neighboring cells. This approach may produce an important degradation in the network since it may provoke coverage holes. In the results presented in this section, the effects caused by a possible coverage hole are not reflected because the simulated scenario presents a significant level of overlapping between cells. The pro-posed algorithm allows to obtain better results without affecting the coverage of the network at any time.
Other alternative to reduce the coverage area of the faulty cell is to increase its antenna tilt (i.e., downtilt the faulty cell). The channel quality of the neighboring cells could be improved by downtilting the faulty cell antenna because the interference produced by the faulty cell can be reduced. However, the expected improvement will be small since the transmission power of the faulty cell has
been reduced so that the interference level produced in the neighboring cell is small too. In addition, when the faulty cell antenna tilt is increased, a deterioration of the cell edge of the faulty cell may be caused so that the SINR50of the faulty cell cannot be increased.
Figure 16 shows the 5th, 50th, and 95th percentiles of the SINR of the faulty cell and the neighboring cells when a downtilt is applied to the faulty cell antenna. It can be seen that this approach does not achieve any improvement in the SINR of the faulty cell so that it is not an alternative to compensate the fault.
5 Conclusions
A cell degradation compensation algorithm has been pro-posed in this paper. The algorithm carries out handover margin modifications in order to reduce the degrada-tion caused by a weak coverage fault occurred in the network. The proposed method also includes a previous stage that performs an automatic selection of neighbor-ing cells to carry out the compensation and an automatic configuration to adapt to different scenario conditions.
The algorithm, which has been implemented by a fuzzy logic controller, computes the handover margin modifi-cations based on the faulty cell and the neighboring cell performance. A set of simulations has been carried out to evaluate the proposed compensation algorithm under different conditions. These tests include different levels of degradation in the faulty cell, scenarios with different user mobility conditions, or different faulty cells simul-taneously. The results have shown that the proposed algorithm is able to improve the signal quality experi-enced by the users in the faulty cell. The cost of this improvement is a slight reduction of the signal quality in neighboring cells and a slight degradation of the handover success rate, especially when the level of degradation is high.
Acknowledgements
This work has been partially funded by Optimi-Ericsson, Junta de Andalucía (Agencia IDEA, Consejería de Ciencia, Innovación y Empresa, ref. 59288; and Proyecto de Investigación de Excelencia P12-TIC-2905) and ERDF.
Competing interests
The authors declare that they have no competing interests.
Author details
1Universidad de Málaga, Departamento de Ingeniería de Comunicaciones,
29071 Málaga, Spain.2Ericsson, SDT EDOS-DP. 29590 Campanillas, Málaga,
Spain.
Received: 19 August 2015 Accepted: 29 September 2016
References
1. 3rd Generation Partnership Project; Technical Specification Group Radio Access Network; Evolved Universal Terrestrial Radio Access (E-UTRA) and Evolved Universal Terrestrial Radio Access Network (E-UTRAN); Overall description; Stage 2 (3GPP TS 36.300 V12.6.0 Release 12) (2015-06) (2015) 2. 3rd Generation Partnership Project; Technical Specification Group Radio
Access Network; Feasibility study for Further Advancements for E-UTRA (LTE-Advanced) (3GPP TR 36.912 V12.0.0 Release 12) (2014-09) (2014) 3. J Monserrat, G Mange, V Braun, H Tullberg, J Zimmermann, O Bulakci, METIS research advances towards the 5G mobile and wireless system definition. EURASIP J. Wireless Commun. Netw.2015(53) (2015). doi:10.1186/s13638-015-0302-9
4. D Soldani, A Manzalini, Horizon 2020 and beyond: on the 5G operating system for a true digital society. Vehic. Technol. Mag. IEEE.10(1), 32–42 (2015). doi:10.1109/MVT.2014.2380581
5. 3rd Generation Partnership Project; Universal Mobile Telecommunications System (UMTS); LTE; Telecommunication management; Self-Organizing Networks (SON); Concepts and requirements (3GPP TS 32.500 v. 12.1.0 Release 12) (2015-01) (2014) 6. 3rd Generation Partnership Project; Technical Specification Group
Services and System Aspects; Telecommunication management; Self-Organizing Networks (SON); Self-healing concepts and requirements (3GPP TS 32.541 V12.0.0 Release 12) (2014-10) (2014)
7. R Barco, P Lázaro, P Muñoz, A unified framework for self-healing in wireless networks. IEEE Communications Magazine.50(12), 134–142 (2012). doi:10.1109/MCOM.2012.6384463
8. M Amirijoo, L Jorguseski, R Litjens, R Nascimento, inConsumer Communications and Networking Conference (CCNC), 2011 IEEE. Effectiveness of cell outage compensation in LTE networks, (2011), pp. 642–647. doi:10.1109/CCNC.2011.5766560
9. MZ Asghar, S Hamalainen, T Ristaniemi, inComputer Aided Modeling and Design of Communication Links and Networks (CAMAD), 2012 IEEE 17th International Workshop On. Self-healing framework for LTE networks, (2012), pp. 159–161. doi:10.1109/CAMAD.2012.6335320
10. Z Jiang, P Yu, Y Su, W Li, X Qiu, inNetwork Operations and Management Symposium (APNOMS), 2013 15th Asia-Pacific. A cell outage compensation scheme based on immune algorithm in LTE networks, (Hiroshima, Japan, 2013), pp. 1–6
11. A Apostolidis, D Siouras, N Alonistioti, inSmart Communications in Network Technologies (SaCoNeT), 2013 International Conference On. An outage compensation algorithm for WLANs, vol. 04, (2013), pp. 1–5. doi:10.1109/SaCoNeT.2013.6654592
12. A Saeed, OG Aliu, MA Imran, inWireless Communications and Networking Conference (WCNC), 2012 IEEE. Controlling self healing cellular networks using fuzzy logic, (2012), pp. 3080–3084. doi:10.1109/WCNC.2012.6214334 13. O Onireti, A Zoha, J Moysen, A Imran, L Giupponi, M Imran, A Abu Dayya,
A cell outage management framework for dense heterogeneous networks. Vehic. Technol. IEEE Trans.PP(99), 1–1 (2015). doi:10.1109/TVT.2015.2431371
14. J Niemelä, T Isotalo, J Lempiäinen, Optimum antenna downtilt angles for macrocellular WCDMA network. EURASIP J. Wirel. Commun. Netw.2005, 610942 (2005). doi:10.1155/WCN.2005.816
15. O Yilmaz, S Hamalainen, J Hamalainen, inVehicular Technology Conference Fall (VTC 2009-Fall), 2009 IEEE 70th. Comparison of remote electrical and mechanical antenna downtilt performance for 3GPP LTE, (2009), pp. 1–5. doi:10.1109/VETECF.2009.5379074
16. R Razavi, inVehicular Technology Conference (VTC Spring), 2012 IEEE 75th. Self-optimisation of antenna beam tilting in LTE networks, (2012), pp. 1–5. doi:10.1109/VETECS.2012.6240017
17. R Razavi, S Klein, H Claussen, A fuzzy reinforcement learning approach for self-optimization of coverage in LTE networks. Bell Labs Tech. J.15(3), 153–175 (2010). doi:10.1002/bltj.20463
18. H Eckhardt, S Klein, M Gruber. Vertical antenna tilt optimization for LTE base stations, (2011), pp. 1–5. doi:10.1109/VETECS.2011.5956370 19. AJ Fehske, H Klessig, J Voigt, GP Fettweis, Concurrent load-aware
adjustment of user association and antenna tilts in self-organizing radio networks. Vehic. Technol. IEEE Trans.62(5), 1974–1988 (2013). doi:10.1109/TVT.2013.2252474
20. A Gomez-Andrades, P Munoz Luengo, EJ Khatib, I de la Bandera Cascales, I Serrano, R Barco, Methodology for the design and evaluation of self-healing LTE networks. Vehic. Technol. IEEE Trans.PP(99), 1–1 (2015). doi:10.1109/TVT.2015.2477945
21. P Muñoz, R Barco, I de la Bandera, On the potential of handover parameter optimization for Self-Organizing Networks. Vehic. Technol. IEEE Trans.62(5), 1895–1905 (2013). doi:10.1109/TVT.2013.2247778
22. P Muñoz, R Barco, I de la Bandera, Optimization of load balancing using fuzzy q-learning for next generation wireless networks. Expert Syst. Appl. 40(4), 984–994 (2013)
23. H Zhang, C Jiang, J Cheng, Cooperative interference mitigation and handover management for heterogeneous cloud small cell networks. Wireless Commun. IEEE.22(3), 92–99 (2015).
doi:10.1109/MWC.2015.7143331
24. W Zheng, H Zhang, X Chu, X Wen, Mobility robustness optimization in self-organizing LTE femtocell networks. EURASIP J. Wireless Commun. Netw.2013(1), 1–10 (2013). doi:10.1186/1687-1499-2013-27 25. H Zhang, C Jiang, RQ Hu, Y Qian, Self-organization in disaster-resilient
heterogeneous small cell networks. IEEE Network.30(2), 116–121 (2015). doi:10.1109/MNET.2016.7437033
26. H Zhang, H Liu, W Ma, W Zheng, X Wen, C Jiang, Mobility robustness optimization in femtocell networks based on ant colony algorithm. IEICE Trans.95-B(4), 1455–1458 (2012)
27. 3rd Generation Partnership Project; Technical Specification Group Radio Access Network; Universal Terrestrial Radio Access (UTRA) and Evolved Universal Terrestrial Radio Access (E-UTRA); Radio measurement collection for Minimization of Drive Tests (MDT); Overall description; Stage 2 (3GPP TS 37.320 V12.2.0 Release 12) (2014-09) (2014)
28. 3rd Generation Partnership Project; Technical Specification Group Radio Access Network; Evolved Universal Terrestrial Radio Access (E-UTRA); Radio Resource Control (RRC); Protocol specification (3GPP TS 36.331 V12.6.0 Release 12) (2015-06) (2015)
30. J Fernández-Segovia, S Luna-Ramírez, M Toril, A Vallejo-Mora, C Úbeda, A computationally efficient method for self-planning uplink power control parameters in LTE. EURASIP J. Wireless Commun. Netw.2015(80) (2015). doi:10.1186/s13638-015-0320-7
31. 3rd Generation Partnership Project; Technical Specification Group Radio Access Network; Evolved Universal Terrestrial Radio Access (E-UTRA); Radio Frequency (RF) system scenarios (3GPP TR 36.942 V12.0.0 Release 12) (2014-09) (2014)
32. T Ross, Fuzzy logic with engineering applications. Wiley (2010). ISBN: 978-0-470-74376-8
33. P Muñoz, I de-la-Bandera, F Ruiz, S Luna-Ramírez, R Barco, M Toril, P Lázaro, J Rodríguez, Computationally-efficient design of a dynamic system-level LTE simulator. Int. J. Electron. Telecommun.57(3), 347–358 (2011)
Submit your manuscript to a
journal and benefi t from:
7Convenient online submission
7Rigorous peer review
7Immediate publication on acceptance
7Open access: articles freely available online
7High visibility within the fi eld
7Retaining the copyright to your article