POD-01.01
Magnetic resonance imaging-targeted vs. systematic biopsies in men on active surveillance: Results of a prospective, randomized Canadian Urology Research Consortium trial
Laurence H. Klotz1, Andrew Loblaw2, Joseph Chin3, Neil E. Fleshner4, Marlene Kebabdjian1, Greg Pond5, Masoom Haider6
1Urology, Sunnybrook Health Sciences Centre, University of Toronto,
Toronto, ON, Canada; 2Radiation Oncology, Sunnybrook Health Sciences
Centre, University of Toronto, Toronto, ON, Canada; 3Urology, University
of Western Ontario, London, ON, Canada; 4Urology, Princess Margaret
Hospital, University of Toronto, Toronto, ON, Canada; 5Biostatistics,
Ontario Clinical Oncology Group, McMaster University, Hamilton, ON, Canada; 6Radiology, Sunnybrook Health Sciences Centre, University of
Toronto, Toronto, ON, Canada
Study Groups: This study was funded by the Ontario Institute for Cancer Research, This study was implemented and managed by the Canadian Urology Research Consortium (CURC)
Introduction: This is the first report of a multicentre, prospective,
random-ized phase 3 trial to determine if multiparametric magnetic resonance imaging (mpMRI) and targeted biopsy can improve selection of patients eligible for active surveillance through improved detection of clinically significant cancer compared to systematic biopsy. The primary outcome was the proportion of subjects whose biopsy was upgraded at their confirmatory biopsy to Gleason score 7 (3 + 4) or higher.
Methods: Eligible patients were diagnosed with favourable-risk prostate
cancer (Gleason 6 and prostate-specific antigen [PSA] <10) within the previ-ous 12 months. 296 patients were registered and 273 randomized between systematic 12-core biopsy and an MRI, with targeted and systematic biop-sies, done between six and 13 months after the initial biopsy. There were no differences between treatment arms in terms of stratum, demographics, tumour characteristics, or prior treatments.
Results: 31 (23%) of transrectal ultrasound (TRUS)-guided biopsy patients
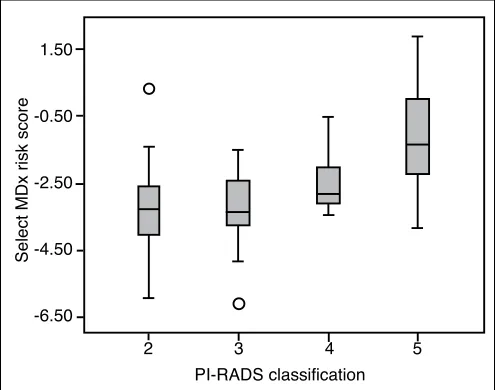
had Gleason 7 or higher cancer compared with 29 (21.2%) of the MRI-guided biopsy (p=0.68). Independent, blinded pathology review was per-formed on 188 patients. Upgrading incorporating path review occurred in 36/132 (27.3%) of TRUS-guided and 42/127 (33.1%) of MRI-guided biopsy patients (p=0.34). The positive predictive value (PPV) for Gleason 7 or higher cancer for Prostate Imaging Reporting and Data System (PI-RADS) score 1‒2, 3,4, and 5 was 13%, 29%, 24%, and 33%, respectively. 2/12 (16.7%) with a MRI score of 1, and 3/33 (9%) with MRI score of 2 had Gleason 7 or higher cancers on systematic biopsy. The negative
predic-tive value (NPV) of PI-RADS 1‒2 for Gleason ≥7 was 89%. The results of targeted vs. systematic biopsy in the MRI arm is listed in Table 1.
Conclusions: No significant difference was observed in the rate of upgrading
between confirmatory biopsy with TRUS compared with MRI-guided tar-geted biopsy. No secondary outcome was statistically significant. Performing confirmatory targeted biopsy only in men with a PI-RADS lesion ≥3 would identify 89% of Gleason 7 or greater cancers.
POD-01.02
Germline mutations in the kallikrein 6 region and predisposition for aggressive prostate cancer
Laurent Briollais1,2, Hilmi Ozcelik1,3, Jingxiong Xu1,2, Maciej Kwiatkowski4,5, Emilie Lalonde6,7, Dorota Sendorek6, Franz Recker4, Neil E. Fleshner8, Cynthia Kuk8,9, Ekaterina Olkhov-Mitsel1,2,10, Sevtap Savas11, Sally Hanna9, Tristan Juvet8, Geoffrey Hunter6, Matt Friedlander1,2, Hong Li1,3, Karen Chadwick8, Ioannis Prassas3, Antoninus Soosaipillai3, Marco Randazzo4, John Trachtenberg8, Ants Toi8, Yu-Jia Shiah6, Michael Fraser12, Theodorus van der Kwast13, Robert Bristow7,12, Bharati Bapat1,2,10,13, Eleftherios Diamandis3, Paul Boutros6,7,12, Alexandre Zlotta1,8,9
1Lunenfeld-Tanenbaum Research Institute, Mount Sinai Hospital, Toronto,
ON, Canada; 2Dalla Lana School of Public Health, University of Toronto,
Toronto, ON, Canada; 3Department of Pathology and Laboratory Medicine,
Mount Sinai Hospital, Toronto, ON, Canada; 4Department of Urology,
Cantonal Hospital Aarau, Aarau, Switzerland; 5Department of Urology,
Academic Hospital Braunschweig, Braunschweig, Germany; 6Informatics &
Biocomputing Program, Ontario Institute for Cancer Research, Toronto, ON, Canada; 7Department of Medical Biophysics, University of Toronto, Toronto,
ON, Canada; 8Department of Surgery, Division of Urology, University
Health Network, Toronto, ON, Canada; 9Department of Surgery, Division
of Urology, Mount Sinai Hospital, Toronto, ON, Canada; 10Department
of Laboratory Medicine and Pathobiology, University of Toronto, Toronto, ON, Canada; 11Craig L. Dobbin Genetics Research Centre, Discipline
of Genetics, Faculty of Medicine, Memorial University, St. John’s, NL, Canada; 12Ontario Cancer Institute, University Health Network, Toronto,
ON, Canada; 13Department of Pathology, University Health Network,
Toronto, ON, Canada
Introduction: Prostate cancer (PCa) is a highly heterogeneous disease,
rang-ing from indolent to rapidly progressrang-ing life-threatenrang-ing metastatic disease. There is a need for markers identifying patients at increased risk of harbour-ing aggressive forms of PCa.
Podium Session 1: Early Prostate Cancer
June 25, 2017; 1040–1140
POD-01.01. Table 1. Patients in MRI-guided targeted biopsy arm: Targeted vs. systematic biopsy results
MRI-targeted biopsies (n=127)
Systematic biopsies
No cancer Gleason 6 Gleason 7 Gleason 8 Total upgraded
by MRI only
No cancer 37 3 3 0 3
Gleason 6 36 22 5 0 5
Gleason 7 5 3 9 0
Gleason 8 2 0 1 1
Methods: We surveyed the Kallikrein (KLK) region (KLK1-15) for
sin-gle nucleotide polymorphisms (SNPs) associated with aggressive PCa (Gleason score ≥8) in 1858 PCa patients. Discovery (Swiss arm of the European Randomized Study of Screening for PCa, n=379; Toronto, Canada, Princess Margaret Cancer Centre, n=540) and a validation cohort (Prostate, Lung, Colorectal, and Ovarian [PLCO], n=939) were analyzed. Fine-mapping was carried out by genotyping and imputation (discovery cohort) or provided by DbGaP (PLCO). Biochemical-free survival was evaluated in an intermediate-risk disease cohort (International Cancer Genome Consortium [ICGC]; n=130). Single- and multi-SNP association studies, as well as haplotype analyses were performed. All statistical tests were two-sided.
Results: Several SNPs in strong linkage disequilibrium in the KLK6 region,
within the same haplotype (rs113640578, rs79324425, rs11666929, rs28384475, rs3810287), identified patients at increased risk of aggres-sive PCa in both discovery (odds ratio [OR] 3.51‒3.64; 95% confi-dence interval [CI] 2.01-6.36; p=1.0 x 10⁻⁵‒8.4 x 10⁻⁶) and validation
(OR1.89‒1.96; 95% CI 0.99‒3.71; p=0.04‒0.05) cohorts. The validation cohort revealed another important haplotype with two SNPs at the same locus (rs28665094, p=0.006 and rs268890; p=0.005) associated with aggressive PCa. The overall test of haplotype association was highly sta-tistically significant in the discovery cohort (p=3.5 x 10⁻⁴), in the PLCO
cohort (p=0.006) and when combined (p=2.3 x 10⁻⁵). These germline SNPs
predicted relapse independently of standard clinical and molecular factors in the ICGC cohort (hazard ratio [HR] 3.15; 95% CI 1.57‒6.34; p=0.001).
Conclusions: Our fine-mapping study has identified novel loci in the
KLK6 region strongly associated with aggressive PCa.
POD-01.03
Association between germline genetic variation and progression in men with low-risk prostate cancer on active surveillance Viranda Jayalath1,2, Antonio Finelli1,2, Maria Komisarenko2, Narhari Timilshina2, Qihuang Zhang3, Wei Xu3, Neil E. Fleshner1,2, Robert J. Hamilton1,2
1Surgical Oncology-Urology, University Health Network, Toronto,
ON, Canada; 2Surgery-Urology, University of Toronto, Toronto, ON,
Canada; 3Biostatistics, Princess Margaret Cancer Centre, Toronto, ON,
Canada
Introduction: Active surveillance (AS) is the preferred initial treatment
for men with localized, low-risk prostate cancer (PCa). Challenges in AS include: identifying candidates, risk-stratifying followup, and defining clinically significant progression. Although the link between germline genetics and PCa outcomes has been investigated, their influence on AS remains unclear.
Methods: DNA from peripheral blood was available for 490 men
fol-lowed for AS at our institution. All men had low-risk PCa: Gleason <7, <4 positive cores, <50% core involvement, and prostate-specific antigen
(PSA) <10.0 ng/dL, and had ≥1 post-diagnostic biopsy. We genotyped 360, 346 single nucleotide polymorphisms (SNPs) using a custom array (OncoArray); all SNPs had a call rate ≥95% and a minor allele frequency
≥1%. Cox proportional hazards assessed SNPs and time to pathological (failing to meet low-risk criteria at rebiopsy) and therapeutic progres-sion (first of pathological progresprogres-sion or initiation of medical therapy). Secondary analyses evaluated the same outcomes for 11 SNPs previously studied for PCa progression.
Results: Over a median 44 months of followup, 206 (42%) and 227 (46%)
men progressed pathologically and therapeutically. Men who progressed had worse pathological characteristics at diagnosis (PSA, prostate vol-ume, number of positive cores, and max % core involvement; p<0.05). After correcting for multiple analyses, one SNP (rs4464333) remained associated with pathological progression (hazard ratio [HR] 5.51, 95% confidence interval [CI] 3.01‒10.1; p=3 x 10⁻⁸) and one SNP (rs6583016)
remained borderline-associated with therapeutic progression (HR 2.30, 95% CI 1.67‒3.17; p=3 x 10⁻⁷) (Table 1). Of the 11 previously studied
SNPs, rs7141529 associated with therapeutic progression (HR 1.32, 95% CI 1.02‒1.73; p=0.03).
Conclusions: We identified two novel germline genotypic variants that
significantly associated with an increased risk of progression in men undergoing AS. These findings, if validated, may improve patient selec-tion for, and followup on AS.
POD-01.04
Defining a cohort of men who may not require repeat prostate biopsy based on the negative predictive value of PCA3 and magnetic resonance imaging combined: The double-negative effect Nathan Perlis1, Thamir Al-Kasab1, Ardalan E. Ahmad1, Estee Goldberg1, Kamel Fadaak1, Rashid Sayyid1, Antonio Finelli1, Girish S. Kulkarni1, Robert J. Hamilton1, Alexandre Zlotta2, Neil E. Fleshner1
1Urology, University Health Network, University of Toronto, Toronto, ON,
Canada; 2Urology, Sinai Health System, University of Toronto, Toronto,
ON, Canada
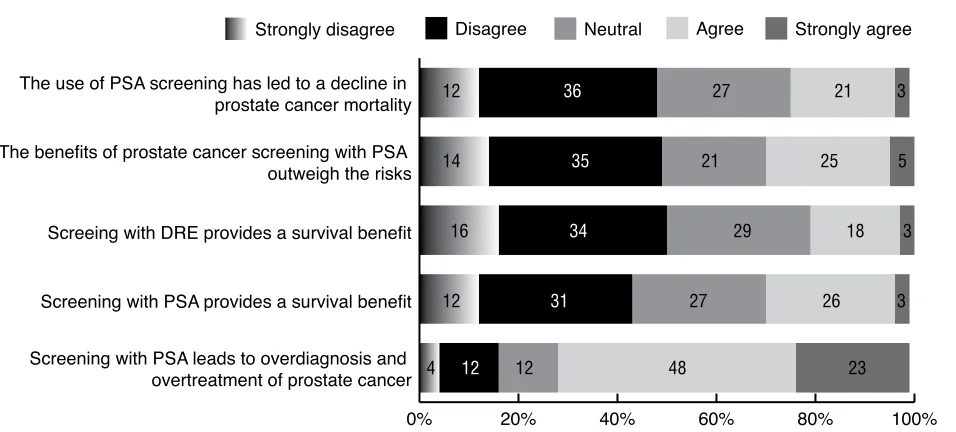
Introduction: Multiparametric magnetic resonace imaging (mpMRI) and
the PCA3 urine test aim to limit prostate cancer (PCa) overdiagnosis and overtreatment by identifying less indolent cancer and more clini-cally significant cases. We explore whether the utility of the tests can be maximized by combining them for a group of patients with previous prostate biopsies.
Methods: We collected clinicopathological data from all patients with
previous negative biopsies or on active surveillance (AS) for low-risk PCa that underwent urine PCA3 from 2011 to June 2016 at the University Health Network in accordance with ethics committee approval. We explored whether age, prostate-specific antigen (PSA), PCA3, mpMRI, digital rectal exam (DRE), family history, and prostate size predicted for clinically significant PCa on repeat biopsy as defined by Epstein criteria.
POD-01.03. Table 1. Most significant SNPs in primary analyses
Chr SNP ID Base pair Allele MAF MM Mm mm HR CI p
Pathological progression
2 rs4464333 48673328 A 0.01 476 14 0 5.51 3.01–10.07 3.01E–08*
4 chr4:34796109 34796109 G 0.01 436 8 1 4.55 2.50–8.31 7.85E–07
1 rs6583016 107763924 C 0.07 421 62 5 2.28 1.63–3.18 1.22E–06
1 rs6682225 196432158 A 0.40 181 223 86 1.59 1.31–1.92 2.10E–06
8 chr8:33944351 23944351 A 0.02 475 15 0 4.19 2.32–7.59 2.13E–06
Therapeutic progression
1 rs6583016 107763924 C 0.07 421 62 5 2.30 1.67–3.17 3.07E–07**
1 rs6682225 196432158 A 0.40 181 223 86 1.55 1.29–1.86 2.42E–06
9 rs10977897 9632921 G 0.15 357 115 16 1.68 1.35–2.11 4.69E–06
1 rs10922071 196433870 A 0.32 230 207 53 1.54 1.28–1.86 5.40E–06
16 rs4783689 68853671 A 0.36 192 241 57 0.61 0.49–0.76 6.16E–06
We then stratified patients by mpMRI and PCA3 to detect whether any combination of tests has exemplary negative predictive value (NPV) and considered the optimal sequence of tests.
Results: 470 patients were included with a with median (interquartile
range [IQR]) age and PSA of 62.5 ng/mL (58−68) and 6.3 (4.6−8.8), respectively. PCA3 was abnormal (≥35) in 32.5% of cases. In the multi-variate model, only age (odds ratio [OR] 1.08; 95% confidence interval [CI] 1.01−1.16), mpMRI score 4 (OR 16.6; 95% CI 3.9−70) or 5 (OR 28.3; 95% CI 5.7−138), and PCA3 (OR 2.9; 95% CI 1.0−8.8) predicted for clinically significant PCa. No patients with a negative mpMRI and normal PCA3 had clinically significant PCa on biopsy (0 of 26, 100% NPV for double-negative test; p<0.0001). Using mpMRI as the initial test diminishes the number of overall tests (11 fewer tests per 100 patients) and adds spatial information for targeted biopsy.
Conclusions: Both PCA3 and mpMRI are useful tests for predicting
clini-cally significant PCa on repeat prostate biopsy. In the one of six patients in our cohort with double-negative tests, no clinically significant PCa was found on biopsy, which raises the question of whether biopsy can be avoided in this group altogether.
POD-01.05
Prostate-specific antigen levels in men aged 60‒70 and development of lethal prostate cancer over 30 years: Implications for risk-stratified screening
Mark A. Preston1, Mary Kathryn Downer2, Travis Gerke3, Sigrid Carlsson4, Howard Sesso2, Adam Kibel1, Quoc-Dien Trinh1, Hans Lilja5, Andrew Vickers4, Kathryn Wilson2, Lorelei Mucci2
1Urology, Brigham and Women’s Hospital , Boston, MA, United
States; 2Epidemiology, Harvard School of Public Health, Boston, MA,
United States; 3Department of Cancer Epidemiology, Moffitt Cancer
Centre, Tampa, FL, United States; 4Department of Epidemiology and
Biostatistics, Memorial Sloan-Kettering Cancer Centre, New York, NY,
United States; 5Department of Surgery, Memorial Sloan-Kettering Cancer
Centre, New York, MA, United States
Introduction: We sought to determine if a prediagnostic prostate-specific
antigen (PSA) level in men aged 60‒70 years predicts future risk of lethal prostate cancer and could be used to risk-stratify screening, potentially allowing men at low risk to be exempt from further screening.
Methods: We conducted a nested case-control study among men aged
60 (57.5‒62.5), 65 (62.5‒67.5), and 70 (67.5‒72.5) years who gave blood before enrollment in the Physicians’ Health Study of primarily white, U.S. male physicians initiated in 1982. Baseline PSA levels were available for 109 lethal prostate cancer cases that were matched to 327 age-matched controls or non-lethal prostate cancer cases. Lethal was defined as metastatic (to bones or distant organs) or fatal prostate cancer. Conditional logistic regression was used to estimate odds ratios (ORs) with 95% confidence intervals (CIs), of the association between PSA and risk of lethal disease.
Results: Median PSA (ng/mL) among controls was 1.10 for men aged 60,
1.51 for men aged 65, and 1.52 for men aged 70. The 90th percentile of PSA levels among controls was 3.97 for men aged 60, 5.38 for men aged 65, and 5.17 for men aged 70. Median time from blood draw to lethal event among lethal cases was 15.3 years. Risk of lethal prostate cancer was strongly associated with baseline PSA levels: ORs (95% CIs) comparing PSA in the >90th percentile vs. ≤median were 7.5 (2.9, 19.1) for men aged 60, 19.3 (4.5, 82.0) for men aged 65, and 11.4 (3.0, 44.2) for men aged 70. 87% of lethal cases were in men with baseline PSA above the median (Table 1).
Conclusions: Pre-diagnostic PSA level at age 60‒70 strongly predicts future risk of lethal prostate cancer in a U.S. cohort subject to opportu-nistic screening. This supports risk-stratified screening, with consideration of exempting men with PSA below the median at age 60 onwards from further screening.
POD-01.06
Outcomes of an aggressive biopsy strategy in young men with prostate-specific antigen between 0.5 and 2.5
Hanan Goldberg1, Ants Toi1, Rashid Sayyid1, Michael Nesbit1, Neil E. Fleshner1
1Urology, Princess Margaret Hospital, Toronto, ON, Canada
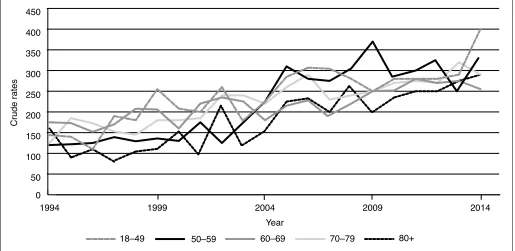
Introduction: Prostate cancer (PCa) detection has increased over previous
years with the widespread use of prostate-specific antigen (PSA). Incidence rates have also increased in younger men (<50 years). Longitudinal cohort studies and urological guidelines demonstrate that PSA ≥1 in young patients under 50 confer an increased risk of PCa metastases or death several decades later. As a result of this, we have adopted an aggressive strategy among young patients under 50 with PSA close to 1 and above. Our objective was to examine this practice adoption and describe cancer detection rates.
Methods: A local institutional prostate biopsy database was queried for
all patients under 50 who were biopsied in the last two decades. Data collected included clinical and pathological parameters. Patients were analyzed according to their specific PSA values. Multivariate logistic regression was performed to predict covariates associated with positive biopsy results.
Results: For this analysis, we eliminated patients who have had prior
prostate biopsies and were left only with patients who had their first biopsy (n=199) due to either a PSA close to 1 and above, positive family history, and suspicious lesion on transrectal ultrasound (TRUS). Table 1 demonstrates baseline clinical and biopsy pathological data. A total of 19.2% of patients were diagnosed with PCa and over a fifth of them had at least a Gleason 7 disease, with almost a third having PSA <1.5. More than half of the PCa patients had a worse disease than the Epstein criteria for active surveillance. Factors predicting PCa diagnosis in these patients (Table 2) include positive family history, PSA, and lower prostate volumes.
Conclusions: This data justifies aggressive prostate biopsy strategy for
young men under 50 with a PSA close to 1 and above. Special attention should be paid to patients with family history and smaller prostates, despite low PSA levels.
POD-01.05. Table 1. Proportion of lethal prostate cancers captured by percentiles of measured PSA levels at ages 60, 65, and 70
PSA concentration
(ng/mL)
Proportion of lethal prostate cancers in PSA
category Aged 60 (± 2) years at blood draw
(n=50 lethal events)
Top 10th percentile ≥3.97 48%
Quartile 4 ≥2.29 62%
Above median ≥1.10 84%
Below median <1.10 16%
Aged 65 (± 2) years at blood draw (n=30 lethal events)
Top 10th percentile ≥5.38 63%
Quartile 4 ≥2.70 73%
Above median ≥1.51 90%
Below median <1.51 10%
Aged 70 (± 2) years at blood draw (n=29 lethal events )
Top 10th percentile ≥5.17 66%
Quartile 4 ≥2.96 69%
Above median ≥1.52 90%
Below median <1.52 10%
POD-01.06. Table 1. Clinical and pathological data
PSA (≤1)
PSA (1–1.5)
PSA (1.5–2)
PSA
(2–2.5) Total p
Number of patients 56 38 57 48 199
Mean age (SD) 45.2 (4.9) 46.4 (3.3) 45.5 (3.5) 46.7 (3.2) 45.9 (3.9) 0.185 Mean prostate volume (cc) (SD) 26.9 (10.6) 27.9 (7.5) 31.3 (9.8) 28.2 (7.5) 28.7 (9.2) 0.075 Mean number of cores taken (SD) 10.7 (1.7) 11.2 (1.2) 10.3 (1.8) 10.9 (1.5) 10.7 (1.6) 0.102 Family history of prostate cancer, n (%) 13 (23.2%) 11 (29.7%) 14 (25%) 17 (35.4%) 55 (27.9%) 0.298 Biopsy indication, n (%)
Rising PSA
Significant family history Suspicious DRE
TRUS lesion
11 (19.6%) 2 (3.6%) 36 (64.3%)
7 (12.5%)
9 (23.7%) 2 (5.3%) 24 (63.2%)
3 (7.9%)
32 (56.1%) 3 (5.3%) 19 (33.3%)
3 (5.3%)
35 (72.9%) 0 (0%) 11 (22.9%)
2 (4.2%)
35 (72.9%) 0 (0%) 11 (22.9%)
2 (4.2%)
35 (72.9%) 0 (0%) 11 (22.9%)
2 (4.2%) Suspicious TRUS lesion, n (%) 26 (46.4%) 17 (44.7%) 24 (42.1%) 15 (31.3%) 82 (41.2%) 0.818 Diagnosis of cancer, n (%) 4 (7.5%) 8 (22.2%) 15 (26.8%) 10 (20.8%) 37 (19.2%) 0.071 Gleason score, n (%)
6 7 8 9 10
4 (100%) 0 0 0 0
8 (100%) 0 0 0 0
10 (66.7%) 3 (20%)
0 1 (6.7%) 1 (6.7%)
7 (70%) 2 (20%)
0 1 (10%)
0
29 (78.4%) 5 (13.5%)
0 2 (5.4%) 1 (2.7%)
0.738
Disease worse than Epstein criteria, n
(%) 2 (50%) 1 (12.5%) 9 (60%) 7 (70%) 19 (51.4%) 0.083
DRE: digital rectal exam; PSA: prostate-specific antigen; SD: standard deviation; TRUS: transrectal ultrasound.
POD-01.06. Table 2. Multivariable logistic regression predicting positive biopsy result
p OR 95% CI
Lower Upper
Age 0.142 1.090 0.972 1.223
PSA 0.041 1.962 1.030 3.740
Positive family history 0.009 2.962 1.316 6.665 Prostate volume 0.025 0.933 0.879 0.991 Suspicious TRUS
lesion 0.489 1.329 0.594 2.972
POD-02.01
Incidence, treatment, and risk of adverse birth outcomes for kidney stones in pregnancy: A population-based study
Michael Ordon1,2, Jamie Kroft3, Jade Dirk4, Justin Slater4, Eric McArthur4, Stephanie Dixon4, Blayne K. Welk4,5
1Surgery, University of Toronto, Toronto, ON, Canada; 2Institute for Clinical
Evaluative Sciences, Toronto, ON, Canada; 3Obstetrics and Gynecology,
University of Toronto, Toronto, ON, Canada; 4Institute for Clinical Evaluative
Sciences, London, ON, Canada; 5Surgery, Western University, Toronto, ON,
Canada
Introduction: The contemporary incidence of symptomatic nephrolithiasis
in pregnancy is unknown and there is conflicting evidence as to the risks for perinatal complications associated with stones. Our objective was to perform a population-based study to determine the incidence of nephroli-thiasis in pregnancy, the risk of adverse perinatal/neonatal outcomes, and treatment trends for stones in pregnancy.
Methods: We performed a population-based, matched cohort study using
Ontario’s healthcare administrative databases. All pregnancies in the prov-ince from 2004‒2014 were identified. The study exposure was hospital admission for nephrolithiasis during pregnancy. Each pregnancy with neph-rolithiasis was matched to up to six pregnancies without nephneph-rolithiasis based on age, region of residence, income quintile, year of cohort entry, prior births, and multiple births. The primary outcome was any adverse birth outcome (ABO) defined as preterm birth, low birth weight, and infant death. Secondary outcomes included premature rupture of membranes (PROM), pre-eclampsia, and caesarian section (C/S), as well as the type and frequency of intervention for stones in pregnancy. Logistic regression models, with generalized estimating equations, were used to assess any differences in study outcomes across the exposure groups.
Results: Of 1.39 million pregnancies identified, there were 2863 pregnancies
with nephrolithiasis (0.2%), which were matched with 17 171 pregnancies without nephrolithiasis (baseline characteristics in Table 1). A pregnancy with nephrolithiasis had a significantly increased risk for ABO compared with matched pregnancies without nephrolithiasis (13.5% vs. 8.8%; odds ratio [OR] 1.62; 95% confidence interval [CI] 1.43, 1.82; p<0.0001). Pregnancies with nephrolithiasis also had a greater risk for pre-eclampsia (OR 1.42; p=0.04) and C/S (OR 1.39; p<0.0001), but not PROM.
Conclusions: Our study demonstrated an increased risk of ABO in women
with a hospital admission for nephrolithiasis during pregnancy.
POD-02.02
Surgeon leadership in the operating room: The effects of positive and negative behaviours on surgical team performance
Michael A. Di Lena1, Julian Barling2, Amy Akers2, Darren T. Beiko1,2 1Urology, Queen’s University, Kingston, ON, Canada; 2School of Business,
Queen’s University, Kingston, ON, Canada
Introduction: Leadership in the operating room has been widely studied,
yet the effects of surgeons’ leadership on team performance are not well-understood. The purpose of this study was to examine the effects of trans-formational, passive, abusive supervision and over-controlling leadership behaviours by surgeons on surgical team performance. We hypothesized that transformational leadership and the three negative leadership behav-iours would positively and negatively influence surgical team performance, respectively.
Podium Session 2: General Urology
June 26, 2017; 1250–1350
POD-02.01. Table 1. Baseline characteristics for
pregnancies with nephrolithiasis and matched pregnancies without nephrolithiasis in Ontario between April 2004 and December 2014.
Not exposed n=17 171
Exposed
n=2863 St diff* Age at index
Mean (SD) 28.84 (2.16) 28.81 (5.4) 0.01 Median (IQR) 29 (25–33) 29 (25–33)
Income quintile Quintile 1 (lowest
income) 24.9% 24.9% 0
Quintile 2 22.0% 22.0% 0
Quintile 3 20.1% 20.1% 0
Quintile 4 19.1% 19.1% 0
Quintile 5 (highest
income) 13.8% 13.8% 0
Year of index date
2004–2006 25.1% 25.1% 0
2007–2009 28.5% 28.5% 0
2010–2012 30.0% 30.0% 0
2013–2014 16.4% 16.3% 0
Residential status
Urban 82.2% 82.2% 0
Rural 17.8% 17.8% 0
Number of prior pregnancies
0 47.1% 47.1% 0
1 33.6% 33.6% 0
2 13.0% 13.0% 0
3+ 6.3% 6.3% 0
Multibirth (e.g., twins)
Yes 1.5% 1.5% 0
ADG score
Mean (SD) 7.79 (1.62) 8.71 (4.19) 0.29 Median (IQR) 8 (5–11) 9 (6–12)
Comorbidities History of kidney
stones 0.3% 6.1% 0.33
Hypertension 2.3% 3.5% 0.07
Diabetes 1.6% 1.6% 0
Inflammatory bowel
disease 0.8% 1.5% 0.07
Gout 0.0% 0.0% 0
Methods: Trained observers attended 150 randomly selected operations
at a tertiary care teaching hospital, including 20 urology cases. Observers recorded instances of leadership behaviours enacted by the surgeon. Postoperatively, members completed validated questionnaires rating cohe-sion and collective efficacy. To test our hypotheses, regrescohe-sion analyses were computed with psychological safety and collective efficacy. Data were analyzed using the complex modeling function in MPlus.
Results: Surgeons’ abusive supervision was negatively associated with
psychological safety (unstandardized b=-0.352; p<0.01). There were no significant associations between the other three leadership types and psychological safety (p>0.05). Both surgeons’ abusive supervision (unstan-dardized b=-0.237; p<0.01), and over-controlling leadership (unstandard-ized b=-0.230; p<0.05) were negatively associated with collective effi-cacy. Neither transformational nor passive leadership were linked with collective efficacy.
Conclusions: This study is the first to assess the simultaneous effects of
surgeons’ leadership behaviours on intraoperative team performance. Significant effects only surfaced for negative leadership behaviours; trans-formational leadership did not positively influence team performance. Surgeons’ negative leadership appear to suppress the effects of trans-formational leadership. Educating surgeons about leadership behaviours offers the opportunity to enhance team performance.
POD-02.03
Evaluating the efficacy and safety of intravesical onabotulinumtoxinA in older patients with idiopathic overactive bladder
Adiel E. Mamut1,2, Richard J. Baverstock1,2, Kevin V. Carlson1,2, Trafford Crump3
1vesia [Alberta Bladder Centre], Calgary, AB, Canada; 2Department of
Surgery, Cumming School of Medicine, Calgary, AB, Canada; 3University
of Calgary, Calgary, AB, Canada
Introduction: Intravesical injection of onabotulinumtoxinA (BoTN-A) is
a successful and safe treatment option for patients with overactive blad-der (OAB).1 While the incidence of OAB increases with age, the bulk of
clinical data on the use of BoTN-A for OAB focuses on a younger patient cohort than is observed in the general population.2 Our aim was to
evalu-ate the efficacy and adverse effects of BoTN-A in older adults (>65 years).
Methods: A retrospective cohort study was performed by identifying
patients with idiopathic OAB who were older than 65 years at the time of their first BoTN-A injection. Ethics approval was obtained and patient data was systematically extracted, including demographics, effectiveness data, and adverse events. Patient treated between 2008 and 2016 were included. Patients with idiopathic OAB who were treated with BoTN-A before age 65 during the same time period were used as a comparison group.
Results: 141 patients had sufficient data available and were included in
the final data analysis (81 patients younger than 65 years at first BoTN-A injection and 60 patients older than 65 years). Mean age of the older patient group was 71.9 years (standard deviaton [SD] 5.5 years), while the younger group was 59.7 years (SD 2.6 years). Female patients comprised a larger proportion of the younger group (86% vs. 76%). A majority of patients in each group received multiple treatments with BoTN-A. Younger patients received a mean of three treatments (interquartile range [IQR] 2‒5) while older patients received a mean of two treatments (IQR 2‒5). Treatment dose was increased in 61% of younger patients and 54% of older patients. Concurrent treatment with BoTN-A and oral medication (including anticholinergics or ß3-agonists) was required in 29.3% of older patients compared to 12.4% of younger patients (p<0.01). Adverse events following BoTN-A treatment were more common in the older patient group. Post-injection urinary tract infection occurred in 31.7% of older patients and 25.9% of younger patients (p<0.05). 31.7% of older patients developed post-treatment urinary retention requiring self-catheterization compared to 9.9% of younger patients (p<0.01).
Conclusions: Intravesical injection of BoTN-A is an effective treatment
option in patients with OAB, but is associated with a higher incidence of adverse events in older adults. These findings may be associated with
age-related bladder and detrusor muscle changes. Inclusion of urodynamics data will help further evaluate treatment outcomes in this patient group. References:
1. Nitti VW, Dmochowski R, Herschorn S, et al. Onabotulinum-toxinA for the treatment of patients with overactive bladder and urinary incontinence: Results of a phase 3, randomized, placebo-controlled trial. J Urol 2013;189:2186-93. https://doi. org/10.1016/j.juro.2012.12.022
2. Wagg A, Gibson W, Ostaszkiewicz J, et. al. Urinary incontinence in frail elderly persons: Report from the 5th International Consulta-tion on Incontinence. Neurourol Urodyn 2015;34:39-406. https:// doi.org/10.1002/nau.22602
POD-02.04
Low risk of clean intermittent catheterization and improved treatment response in a post-hoc analysis of a diverse age group of onabotulinumtoxinA-treated patients with overactive bladder Sidney B. Radomski1, Eric Rovner2, Marcus Drake3, Karel Everaert4, Christopher Chapple5, David Ginsberg6, Roger Dmochowski7, Tamer Aboushwareb8, Cheng-Tao Chang9, Victor Nitti10
1University of Toronto, Toronto, ON, Canada; 2Medical University of
South Carolina, Charleston, NC, United States; 3Bristol Urological
Institute, Bristol, United Kingdom; 4Ghent University Hospital, Ghent,
Belgium; 5The Royal Hallamshire Hospital, Sheffield Teaching Hospitals,
NHS Foundation Trust, Sheffield, United Kingdom; 6USC Institute of
Urology, Los Angeles, CA, United States; 7Vanderbilt University Medical
Centre, Nashville, TN, United States; 8Allergan plc, Irvine, CA, United
States; 9Allergan plc, Bridgewater, NJ, United States; 10New York University,
New York, NY, United States
Introduction: We assessed the risk of clean intermittent catheterization
(CIC) and efficacy and quality of life (QOL) outcomes after onabotu-linumtoxinA (OBTA) 100 U treatment in a post-hoc analysis of overactive bladder (OAB) patients of diverse ages.
Methods: Data from two phase 3 trials and a post-marketing study
were pooled for analysis (n=1177) and grouped by age: <40 (n=90), 40‒49 (n=156), 50‒59 (n=263), 60‒69 (n=343), and ≥70 (n=325) years. Assessments at Week 12 post-treatment were CIC rate and dura-tion, % change from baseline in urinary incontinence (UI) episodes/ day, and proportions of patients with ≥50 and 100% UI reduction, with minimally important difference (MID; -5 points) on the King’s Health Questionnaire (KHQ) domains and with a positive response (urinary symptoms ‘improved’/’greatly improved’) on the treatment benefit scale (TBS). Adverse events (AEs) were assessed.
Results: CIC rate was lowest in the <40 age group (1.1%) and increased
slightly with age (3.2%, 5.3%, 5.3%, and 7.2% in 40‒49, 50‒59, 60‒69, and ≥70 groups, respectively). Mean (median) CIC duration was 3 (3) and 44 (26) days in the <40 and 40‒49 groups and ranged from 78 (68) to 88 (74) days in the other groups. OBTA treatment resulted in substantial % UI reductions in all groups (range -46.8 to -64.4%). High proportions of patients achieved ≥50% UI reduction in all groups (range 58.2‒71.1%), and nearly half (45.6%) the patients in the <40 group achieved 100% UI reduction. Similarly, a high proportion of patients in all groups had ≥MID improvements in KHQ domains (range: role limitations 58.2‒72.2%; social limitations 51.7‒63.1%) and a positive TBS response (range 66.2‒73.8%). Urinary tract infection was the most common AE.
Conclusions: The risk of CIC increased slightly with age in OAB
POD-02.05
Randomized, controlled trial comparing narrow vs. wide focal zones for shock wave lithotripsy of renal calculi
R. John Honey1, Daniela Ghiculete1, Monica Farcas1, Kenneth T. Pace1 1Division of Urology, St. Michael’s Hospital, University of Toronto,
Toronto, ON, Canada.
Introduction: Ex-vivo data on the Modulith SLK-F2 electromagnetic
litho-tripter Storz Medical AG (the first litholitho-tripter on the market designed to allow for a dual focus system: narrow or wide) shows that disintegration capacity and renal vascular injury are independent of the focal diameter of the shock wave generator at the same peak positive pressure and disintegration power. The objective of this study is to compare the single-treatment success rates of narrow and wide focal zones for shock wave lithotripsy (SWL) of renal stones.
Methods: 263 patients with a previously untreated ≥5 mm radio-opaque solitary kidney stone were randomized to receive narrow- or wide-focus lithotripsy. Patients were followed with KUB X-rays and renal ultrasound at two and 12 weeks post-lithotripsy to assess stone area and stone-free status. Primary outcome was success rate, defined as stone-stone-free or adequate fragmentation (sand or asymptomatic fragments ≤4 mm) at three months following a single SWL treatment.
Results: 130 patients were randomized to narrow-focus lithotripsy vs.133
to wide-focus lithotripsy. The overall success rates were statistically differ-ent at two weeks post-treatmdiffer-ent (narrow 69.2% vs. wide57.1%; p=0.042) and also at three months (narrow 69.2% vs. wide 57.1%; p=0.042). For smaller stones (area <100 mm2), there was a greater benefit with
narrow-focus lithotripsy (72.6% vs. 60.3%; p=0.05). The SWL retreatment rate for the same stone was significantly higher when wide-focus was used (44.4% vs. 30.8%; p=0.023). Overall, the complication rates were comparable in both groups (narrow 23.3% vs. wide 15.9%; p=0.135); however, the narrow group required significantly fewer ancillary procedures within the initial three-month followup period (narrow 30.8% vs. wide 42.9%; p=0.042).
Conclusions: Narrow-focus lithotripsy yields better outcomes than
wide-focus lithotripsy, particularly for stones <100 mm2, with lower retreatment
rates and without increase in morbidity.
POD-02.06
Understanding simple cystectomy for benign disease: A unique patient cohort with significant risks
Carrie Mlynarczyk1, Michael Lipsky1, Henry Tran1, Doreen Chung1 1Department of Urology, Columbia University Medical Centre, New York,
NY, United States.
Introduction: Cystectomy with urinary diversion can be performed for
severe refractory voiding dysfunction. The limited data in this cohort is limited to small case series. The objective is to explore complications of simple cystectomy for benign disease.
Methods: Current Procedural Terminology codes identified patients within
the National Surgical Quality Improvement Program database who under-went cystectomy (2005−2014). ICD9 codes were used to classify patients with benign or malignant diagnoses. 30-day perioperative complications were identified and logistic regression analysis identified factors associ-ated with morbidity.
Results: We identified 389 patients who had a cystectomy for benign
diagnosis. 235 (60.4%) had recorded complications. The most frequently
reported complication was bleeding (requiring a transfusion within 72 hours) in 150 (38.6%) patients. Other complications were wound infec-tion (63; 16.2%), respiratory complicainfec-tions (29; 7.5%), wound dehiscence (8; 2.1%) renal complications (9; 2.3%), cardiovascular complications (6; 1.5%), and postoperative deep vein thrombosis (8; 2.1%). The reoperation rate was 5.7%. Four patients (1.0%) had a recorded death in the database. Diabetes (odds ratio [OR] 1.9; p=0.04) and smoking (OR 1.8; p=0.03) were associated with increased odds of any complication. Compared to those with cystectomy for malignancy, this cohort was younger, with higher American Society of Anesthesiologists (ASA) scores and chronic kidney disease (CKD) stages. In the benign cohort, fewer had chronic obstructive pulmonary disease (COPD), hypertension, or smoked, and more had preoperative wound infections (Table 1). Operative time was shorter for simple cystectomy (327 + 125 vs. 353 + 124 minutes; p=0.001) and there was no difference in postoperative hospital stay.
Conclusions: This is the first multicentre, nationwide study to examine
morbidity of cystectomy for benign diseases. Our data suggest that the benign and radical cystectomy patients are different, with benign patients being younger with higher ASA class. Even for benign disease, cystectomy carries risk and patients should be counselled accordingly.
POD-02.06. Table 1. Characteristics of simple and radical cystectomy cohorts
Simple Radical p
Age (yrs) 59.1 ± 16.4 68.4 ± 10.2 <0.001
BMI 29.1 ±7.6 28.5 ± 5.7 0.15
Mean ASA score 2.88 + 0.50 2.80 + 0.54 0.005
ASA score 0.02
1 2 (0.5%) 24 (0.5%)
2 69 (18%) 1163 (25%)
3 291(75%) 3197 (68%)
4 26 (7%) 275 (6%)
Diabetes mellitus 66 (17%) 940 (20%) 0.13 Cardiovascular 10 (3%) 218 (5%) 0.06
COPD 18(5%) 397 (9%) 0.007
Smoker 76 (20%) 1139 (24%) 0.03
Hypertension 201(51%) 2853(61%) <0.001
CKD stage <0.001
1 124 (34%) 779 (17%)
2 122 (33%) 2056 (45%)
3 84 (23%) 1514 (33%)
4 23 (6%) 140 (3%)
5 17 (5%) 33 (1%)
POD-03.01
Reducing same day or delays and cancellations using the model for improvement
Martin A. Koyle1, Jessica Ming1, Michael Chua1, Megan Saunders1, Melyssa Stoute2, Vannessa Chin3
1Urology, Hospital for Sick Children & University of Toronto, Toronto, ON,
Canada; 2Perioperative Services, Hospital for Sick Children & University of
Toronto, Toronto, ON, Canada; 3Anesthesia, Hospital for Sick Children &
University of Toronto, Toronto, ON, Canada
Introduction: Delays and cancellations in the operating room (OR) are both
costly and inconvenient. In our institution, >20% of first cases do not start on time or are cancelled. We hypothesized that patient-related factors (PF), rather than systems factors (SF), were primarily responsible for OR delays and cancellations. We employed the “model for improvement” (MFI) in an attempt to reduce these occurrences.
Methods: The MFI uses plan-do-study-act (PDSA) cycles to promote
contin-uous process improvement (CPI). A series of cycles were instituted, involv-ing prolonged NPO and earlier arrival, and we assessed their impacts on cancellations and on time first case starts.
Results: Delays prior to this initiative were found to be primarily related to
SFs, while cancellations were almost always related to PF. After changing NPO and arrival instructions, 13/14 (92%) consecutive days started on time. 100% of 67 consecutive patients were NPO-compliant. Of these patients, three cancelled same day due to a change in their decision. All 67 families surveyed were satisfied with revised NPO and arrival instruc-tions and nursing teachback confimed instrucinstruc-tions were well-understood. Stakeholder engagement, however, was complex and demonstrated polarity within different care team components.1
Conclusions: With healthcare costs and value being increasingly
scruti-nized, Lean/Six sigma and the MFI have been used to promote CPI. CPI in OR start times evidenced in our study may be due to “Hawthorne effect,” as this series involved a single surgeon. As a result, PDSAs are ongoing, with expansion of this methodology to other surgeons. In addition, studying changes in OR booking and scheduling, and enhancing patient and fam-ily education and buy-in are ongoing in order to maximize OR efficiency and use, as well as the sustainability of our project. Silos and inherent institutional culture represent formidable obstacles.
Reference:
1. Girotto JA, Koltz PF, Drugas G. Optimizing your operating room: Or why large, traditional hospitals don’t work. Int J Surg 2010;8:359-67. https://doi.org/10.1016/j.ijsu.2010.05.002
POD-03.02
Glans groove, not preoperative testosterone stimulation, is the main risk factor for complications post-tubularized incised plate repair
Luis H. Braga1,2, Adriana Dekirmendjian2, Melissa McGrath2, Bethany Easterbrook 2, Kizanee Jegatheeswaran2, Armando J. Lorenzo3
1Pediatric Urology, McMaster Children’s Hospital, Hamilton, ON,
Canada; 2McMaster Pediatric Surgery Research Collaborative, McMaster
University, Hamilton, ON, Canada; 3Pediatric Urology, The Hospital for
Sick Children, Toronto, ON, Canada
Introduction: The effect of preoperative testosterone stimulation (PTS) on
complications following tubularized incised plate (TIP) repair remains unclear; however, components of the Glans-Urethral Meatus-Shaft (GMS)
Podium Session 3: Pediatrics, Reconstruction, Infertility
June 26, 2017; 1250–1350
Survival functions: Testosterone
Cumulative surviva
l
Tiime to complication HR=0.83 (0.35–1.98)
p=0.68
0.0 20.00 40.00 60.00 80.00 100.00 1.0
0.8
0.6
0.4
0.2
0.0
Survival functions: UP quality
Cumulative surviva
l
Tiime to complication HR=3.96 (1.62–9.68)
p<0.01
0.0 20.00 40.00 60.00 80.00 100.00 1.0
0.8
0.6
0.4
0.2
0.0 No
Yes
UP quality
Robust spongiosum Poor spongiosum Testosterone
score have been described as important risk factors. Although the correla-tion between meatal locacorrela-tion and ventral curvature (VC) has been well-established, the role of urethral plate (UP) quality is debatable. Herein, we assess these covariates (glans groove, UP quality, and PTS) with TIP repair complications.
Methods: Of a prospectively collected hypospadias database (n=536),
consecutive TIP repairs from 2008–2016 were selected. Staged repairs, other techniques, and redo cases were excluded. Primary outcome was postoperative complication rate (fistula, glans dehiscence, and meatal stenosis). Age at repair, modified GMS score, PTS (for glans width <14 mm), regional block (caudal vs. dorsal penile), VC, and complications were recorded. GMS score, calculated using glans groove (deep/moder-ate and shallow/absent), UP characteristics (robust vs. poor spongiosum), meatal location and VC (<30o, 30o‒70o, >70o), ranged from 4 to 11 (worst).
Student’s t and Fisher’s exact tests, binary logistic, and Cox proportional regressions were used for statistical analyses.
Results: Of 312 patients, 235 (75%) had distal, 48 (15%) midshaft, and 29
(9%) proximal penile hypospadias. Median age at surgery was 16 (3–171) months and mean followup was 16 ± 15 months.;82 (26%) boys received PTS and 265 (85%) had a caudal block. Mean GMS score at initial exam was higher in PTS group vs. no PTS (7.5 ± 1.6 vs. 5.4 ± 1.3; p<0.01). The mean GMS score for PTS patients decreased at surgery, but was still significantly higher than that of non-PTS (6 ± 1.4 vs. 5.5 ± 1.3; p<0.01). Overall complication rate was 12% (9% distal, 17% midshaft, and 31% proximal) and the median time to complication was 2.5 (0‒63) months. Contrary to previous studies, glans width and PTS were not independently associated with complications. Logistic (Table 1) and Cox proportional regression analyses (Fig. 1) revealed a combination of glans groove/UP quality was the main independent risk factor significantly associated with TIP complications (p=0.01).
Conclusions: Previous literature has demonstrated an association between
increased GMS scores and higher complication rates. Although PTS reduced GMS scores at surgery, our findings suggested that PTS, and the
subsequent lower GMS score, did not significantly impact postoperative complications. Rather, glans groove depth/UP quality was the main risk factor for complications post-TIP repair.
POD-03.03
The scope and management of urethral complications after radiotherapy for prostate cancer
Jon Witten1, Keith F. Rourke1
1Division of Urology, Department of Surgery, University of Alberta,
Edmonton, AB, Canada
Introduction: Complications arising from radiotherapy for prostate cancer
are not well-defined. Our objective is to better define the scope and man-agement of lower urinary tract complications after prostate radiotherapy.
Methods: Patients with severe urethral complications from prostate
radio-therapy referred to a single urologist from December 2004 to December 2015 were reviewed. Patient demographics, signs, and symptoms were recorded, as well as the number and types of treatments. Descriptive statistics, Fishers exact test, and unpaired t-test were used to summarize clinical findings.
Results: 120 patients were identified at a mean age of 67.8 years and
a mean Radiation Therapy Oncology Group (RTOG) score of 3.9. The mean time to first complication was 57.7 months (1‒219) and number of complications per patient was 5.1(± 2.2). 55.8% of patients had external beam radiotherapy, 38.3% had brachytherapy, and 5.8% had combined radiation modalities. The most common complications were urethral stric-ture/stenosis (88.3%), refractory urgency (88.3%), incontinence (45.8%), erectile dysfunction (60.0%), and hematuria (42.5%). Other notable com-plications included prostate necrosis (14.2%), pubic osteomyelitis (3.3%), de novo cancer (5.8%), and rectourethral fistula (0.8%). Patients required a mean of 7.4 (1‒30) treatments for radiation complications and 49.2% required major urological surgery. Procedures included urethral dilation/ urethrotomy (77.5%), urethroplasty (44.2%), incontinence surgery (6.7%),
POD 03.02. Table 1. Univariate and multivariable analyses of risk factors for complications post-TIP repair
transurethral resection (43.3%), cystolithopaxy (11.7%), indwelling supra-pubic catheter (13.3%), and urinary diversion (6.7%). Patients with com-bined radiotherapy had more complications (7.0 vs. 5.0; p=0.02) and required a higher number of procedures (10.1 vs. 7.2; p=0.08).
Conclusions: Lower urinary tract complications caused by radiotherapy
are very seldom an isolated problem and require a tremendous amount of resources and urological intervention, this is particularly true for those patients with combined radiotherapy complications.
POD-03.04
Do symptoms correlate with urodynamic findings in post-prostatectomy incontinence?
Joseph R. LaBossiere1, Sender Herschorn1
1Urology, Sunnybrook Health Sciences Centre, Toronto, ON, Canada Introduction: Persistent bothersome urinary incontinence occurs in up to
10‒15% of men after radical prostatectomy (RP). Urodynamics (UDS) are often used in the assessment of men with post-prostatectomy incontinence (PPI). Our objective is to determine how well patient symptoms correlate with UDS in men with PPI.
Methods: We perfromed a retrospective review of 496 men referred to our
institution with PPI. All patients with a history of RP were included. All patients had a standardized history, as well as the original multichannel UDS and interpretation.
Results: 496 patients with an average age of 64 years underwent 513
studies. UDS were performed on average three years after RP. On history, 91% patients complained of stress urinary incontinence (SUI) and 48% urgency urinary incontinence (UUI). 52% of patients had only SUI, 8% only UUI, and 40% mixed urinary incontinence (MUI) symptoms. On UDS, 356 of the 471 patients with SUI symptoms had SUI for a positive predictive value (PPV) of 75%. The negative predictive value (NPV) for SUI symptoms was 78%. 6% of men with SUI symptoms on history had only detrusor overactivity incontinence (DOI) and 18% demonstrated no incontinence on UDS. PPV and NPV for UUI symptoms was 43% and 85%, respectively. Of the 42 men complaining only of UUI symptoms, 14% had only SUI, 50% had only DOI, and 17% had both SUI and DOI on UDS. 19% of men with only UUI symptoms demonstrated no incon-tinence on UDS. 77% of patients with MUI symptoms had SUI on UDS.
Conclusions: 91% of men in this study with PPI presented with some
element of SUI symptoms on history. SUI symptoms on history accu-rately predicts SUI on UDS and rarely identifies only DOI. These data question the routine use of UDS in the workup of men presenting with SUI symptoms after RP prior to treatment. The complaint of UUI symp-toms on history also predicts for DOI on UDS. UDS may be helpful in this patient group to further guide treatment decisions if initial treatment fails and to rule out SUI. Most men with MUI symptoms will have SUI identified on UDS.
POD-03.05
Autologous muscle-derived cells for urinary sphincter repair in women with stress urinary incontinence: Results of a randomized, double-blind, placebo-controlled study
Lesley K. Carr1, Le Mai Tu2, Magali Robert3, David Quinlan4, Kevin V. Carlson5, Ron Jankowski6, Roger Dmochowski7, Michael Chancellor8, Sender Herschorn1
1Sunnybrook Health Sciences Centre, Toronto, ON, Canada; 2Centre
Hospitalier Universitaire de Sherbrooke, Sherbrooke, QC, Canada; 3Foothills Medical Centre, Calgary, AB, Canada; 4Victoria
Gynecology and Continence Clinic, Victoria, BC, Canada; 5Southern
Alberta Institute Of Urology, Calgary, AB, Canada; 6Cook MyoSite,
Incorporated, Pittsburgh, PA, United States; 7Vanderbilt University Medical
Centre, Nashville, TN, United States; 8William Beaumont Hospital, Royal
Oak, MI, United States
Study Groups: Study sponsored by Cook MyoSite, Incorporated, Writing support provided by Patricia Kultgen, Cook Research Incorporated, Statistical analyses provided by Min Chen, Cook Research Incorporated.
Introduction: This multicentre study assessed the effect of autologous
muscle-derived cells for urinary sphincter repair (AMDC-USR) in women with stress urinary incontinence (SUI).
Methods: Women with predominant SUI who presented with a mean
incontinence episode frequency (IEF) of ≥1 stress leak/day were random-ized 2:1 to receive intrasphincteric injection of 150 x 106 AMDC-USR or
placebo and 1:1 to receive one or two treatments. Second treatments were
POD-03.05. Table 2. Baseline characteristics of AMDC-USR and placebo groups
(n affected) 43.0% (40) 30.0% (15) 0.15 Prior hysterectomy
(n affected) 21.5% (20) 26.0% (13) 0.54 Current stage 1–2 pelvic
organ prolapse (n affected)
28.0% (26) 26.0% (13) 0.85 Prior vaginal prolapse
surgery (n affected) 4.3% (4) 4.0% (2) >0.99 Pure stress urinary
incontinence (n affected) 67.7% (63) 66.0% (33) 0.83 Mixed urinary
incontinence, stress predominant (n affected)
32.3% (30) 34.0% (17) 0.83
Prior continence surgery
(n affected) 11.8% (11) 12.0% (6) 0.98 Median number of stress
leaks over 3 days (range) 12 (3–117)
15.5
(4–111) 0.17 Median 24-hour pad test
(g) (range)
28.5 (4–340.2)
29.2
(4.1–416.4) 0.91 Median in-office pad test
(g) (range) AMDC-USR: autologous muscle-derived cells for urinary sphincter repair; BMI: body mass index; IQOL: Incontinence Quality of Life; SD: standard deviation.
POD-03.05. Table 1. Enrollment and followup by treatment group
Category Number of patients
AMDC-USR Placebo
Planned enrollment 164 82
Randomized and treated 93 50
Completed 1-month visit 92 50
Completed 3-month visit 93 50
Completed 6-month visit 92 50
Completed 12-month visit 91 50
Opted to receive open-label
AMDC-USR -- 49
Completed 2-year visit 80 47
Remain in followup 3
administered six months after first treatments. At baseline and followup, three-day diaries, 24-hour pad tests, in-office pad tests, and Incontinence Quality of Life (IQOL) questionnaires were collected. The primary com-posite efficacy endpoint was the percentage of patients 12 months post-treatment with ≥50% IEF reduction or ≥50% reduction in either pad test. Patients were followed for two years, but were unblinded after 12-month visits. After unblinding, placebo patients received AMDC-USR.
Results: The study treated 58% (143/246) of the planned enrollment; 99%
(141/143) of patients completed 12-month visits (Table 1). Enrollment was halted early due to an unexpectedly high placebo responder rate with the composite endpoint. Baseline characteristics were similar for both AMDC-USR and placebo (Table 2). No AMDC-USR safety signals were identified. Post-hoc analyses correlated IQOL score improvement with IEF reduction to identify alternate, clinically meaningful endpoints. Patients with ≥50% IEF reduction had greater IQOL score improvement than those with <50% IEF reduction, and patients with ≥75% IEF reduc-tion or ≤1 stress leak/three days had even greater IQOL improvement (Fig. 1). With alternate IEF reduction endpoints, placebo rates were reduced and a potential treatment effect was detected (Fig. 2).
Conclusions: AMDC-USR is safe in women with SUI. The composite
endpoint, which included pad tests, was too liberal to detect treatment differences between AMDC-USR and placebo; however, IEF reduction endpoints suggest efficacy.
POD-03.06
Microscopic evaluation of the vasal fluid for sperm at the time of vasectomy reversal: Do we really need to check?
Ethan D. Grober1, Sammi Tobe1
1Department of Surgery, Division of Urology, Women’s College & Mount
Sinai Hospital, University of Toronto, Toronto, ON, Canada
Introduction: During vasectomy reversal (VR), intraoperative microscopic
evaluation of the vasal fluid for sperm presence and quality can inform of the possibility of epididymal obstruction and need for a vasoepididy-mostomy (VE). Despite its potential utility, the practice of intraoperative microscopic vas fluid evaluation is not universal. To validate the utility of microscopic vasal fluid evaluation, the current initiative correlates vasal fluid characteristics with sperm presence and quality in a large series of VRs.
Methods: 1108 bilateral VRs performed by a single surgeon yielded a total
of 2216 vasal units for analysis. During VR, vasal fluid was expressed from the testicular end vas and the fluid was characterized (thick-paste/opaque/ translucent/clear). Each aspirated sample underwent microscopic evalua-tion for sperm quality and categorized as: motile sperm/intact non-motile sperm/sperm parts/no sperm. The predictive utility of the gross vasal fluid characteristics with respect to sperm presence and quality was analyzed.
Results: Table 1 summarizes the relationship between the gross vasal fluid
characteristics and the microscopic presence and quality of sperm. When thick-pasty fluid was observed, no sperm were seen in the samples in 50% of cases and if present, only non-motile sperm were observed. Importantly, even in the setting of more favourable vasal fluid characteristics (clear, translucent, and opaque fluid), no sperm were seen in 7‒11% of cases, suggesting the possibility of epididymal obstruction and the need for a VE.
Conclusions: Intraoperative microscopic evaluation of the vasal fluid
for sperm is a necessary practice during VR to optimize surgical out-comes. The gross characteristics of the vasal fluid alone does not univer-sally predict sperm presence and quality. Reliance on vasal fluid charac-teristics in isolation, may lead to unrecognized epididymal obstruction, and the possible need for a VE, in approximately 10% of cases of VR. 100
90
80
70
60
50
40
30
20
10
0
-100 -80 -60 -40 -20 0 20 40 60
Raw score changes in IQOL
Better Worse
Cumulative per
centage (%)
<50% IEF reduction
≥50% IEF reduction
≥75% IEF reduction
≤1 leaks over 3 days
Fig. 1.POD-03.05. Cumulative distribution function plot examining Incontinence
Quality of Life (IQOL) score change and incontinence episode frequency (IEF) reduction at 12 months. Results analyzed independently of treatment received.
Visit (months)
≥50% IEF reduction ≥75% IEF reduction ≤1 leak over 3 days
Treatment AMDC-USR Placebo
Responder rate (%)
100
80
60
40
20
0
1 3 6 12 1 3 6 12 1 3 6 12
50.0 51.0
52.0 52.0
25.0 28.6
24.0 26.0
16.0 14.0 12.2 14.6
17.0 22.2
26.7 26.4 26.1
36.7 43.3
37.4 65.6
56.7
51.1 57.1
Fig. 2.POD-03.05. Percentage of autologous muscle-derived cells for urinary
sphincter repair (AMDC-USR) and placebo patients with ≥50% incontinence episode frequency (IEF reduction), ≥75% IEF reduction, or ≤1 stress leak over three days.
POD-03.06. Table 1. Microscopic sperm presence and quality stratified by intraoperative vassal fluid characteristics
No sperm
Sperm parts
Non-motile intact sperm
Motile sperm
Thick-paste 49% 42% 9% 0%
Opaque 11% 58% 24% 7%
Translucent 7% 30% 42% 21%
POD-04.01
Safety of minimizing intensity of followup on active surveillance for clinical stage I testicular germ cell tumours
Matthew Da Silva1,2, Michael A. Jewett2, Padraig Warde2, Eshetu Atenafu2, Lynn Anson-Cartwright2, Aaron Hansen2, Peter Chung2, Philippe Bedard2, Joan Sweet2, Martin O’Malley2, Robert J. Hamilton2
1Medicine, University of Toronto, Toronto, ON, Canada; 2Surgical
Oncology-Urology, University Health Network, Toronto, ON, Canada
Introduction: The Princess Margaret Cancer Centre began
recommend-ing non-risk adapted active surveillance (AS) for all clinical stage I (CSI) testicular germ cell tumours (TGCT) in 1981. Over time, the frequency of visits, blood work, imaging, and radiation dose have been reduced in order to achieve lower cumulative radiation dose, number of lost work days for patients, and to reflect the understanding that very few relapses occur after
two years. To date, the consequence of our reduced intensity surveillance has not been studied.
Methods: Our seminoma and non-seminoma TGCT AS cohorts were
analyzed from 1981‒2014 (allowing a minimum of two years followup). Surveillance schedules were meaningfully changed four times for non-sem-inoma and three times for semnon-sem-inoma. Primary endpoints included relapse rate, time to relapse, stage at relapse, and burden of relapse treatment during each schedule. Chi-square tests were used to examine differences between surveillance iterations.
Results: Overall, 710 seminoma and 552 non-seminoma patients
under-went AS, with median followups of 6.76 and 5.21 years, respectively. Over the study period for non-seminoma, the number of computed tomography (CT) scans decreased from 11 to five, and chest X-rays from 27 to 0. For seminoma, the number of CT scans decreased from 20 to 10, and chest
Podium Session 4: Other Oncology
June 27, 2017; 1105–1205
POD-04.01. Table 1. Relapse data for clinical stage 1 seminoma and non-seminoma patients
Non-seminoma
Number relapsed n (%) 25 (47.2) 21 (33.9) 83 (25.2) 23 (21.3) 0.0023
Median (range) time from orchiectomy to relapse (months)
Modes of therapy required n (%) Single mode
X-rays from 13 to four. For both cohorts, the relapse rate decreased over time, with no increase in stage or treatment burden at relapse (Table 1). For seminoma, there appeared to be a decrease in N, M, and S stages at relapse. On the most recent schedules, 100% of seminoma and 82.6% of non-seminoma patients were cured with monotherapy only.
Conclusions: After substantial reductions in the intensity of AS and
radia-tion exposure over time in our CSI TGCT AS protocols, we observed no significant change in the ability to detect relapse, the severity of relapse, or the burden of treatment upon relapse. This suggests our reduced intensity schedules are sufficiently safe for active surveillance.
POD-04.02
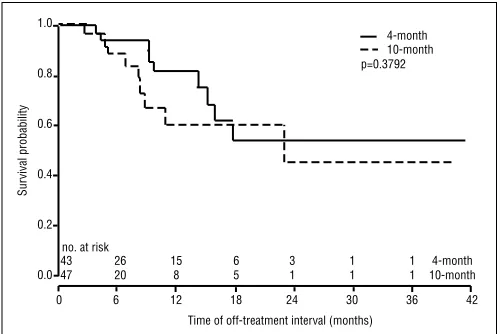
Four vs. 10 months of induction androgen-deprivation therapy for intermittent therapy (the FIT trial): A prospective Canadian Urology Research Consortium randomized trial
Laurence H. Klotz1, Andrew Loblaw2, D. Robert Siemens3, Paul Jr. Ouellette4, Anil Kapoor5, Fred Saad6
1Urology, Sunnybrook Health Sciences Centre, University of Toronto,
Toronto, ON, Canada; 2Radiation Oncology, Sunnybrook Health Sciences
Centre, Toronto, ON, Canada; 3Urology, Queen’s University, Kingston,
ON, Canada; 4Urology, Granby Hospital, Granby, QC, Canada; 5Urology,
McMaster University, Hamilton, ON, Canada; 6Urology, Université de
Montréal, Montreal, QC, Canada
Study Groups: Canadian Urology Research Consortium. This study was funded by a grant from Ferring Canada.
Introduction: Intermittent androgen-deprivation therapy (IADT) is widely
used for the treatment of men with prostate cancer. However, the optimal duration of ADT induction is unknown. IADT induction varies from 3‒12 months in phase 2 and 3 studies, but different periods of induction have never been compared prospectively. This is the first report of a prospec-tive, randomized, multicentre Canadian Urology Research Consortium (CURC) trial comparing the effect of four months vs. 10 months of degare-lix induction on the length of the off-treatment interval in men with biochemical failure.
Methods: This was a prospective, open-label, multicentre, randomized
trial. 101 patients were enrolled, and 91 were randomized between four and 10 months of degarelix. Eligible patients had biochemical recurrence after definitive local therapy with surgery or radiation, a rising prostate-specific antigen (PSA) >5.0, and no bone metastases. Patients were strati-fied for PSA < or >10, and Gleason score ≤ or >7. The primary endpoint was the time until PSA reached 5.0 during the off-treatment interval.
Results: The median age was 75, and median PSA was 12. There was no
difference between the two groups in median age, PSA, body mass index (BMI), racial distribution, Gleason score, T stage, Eastern Cooperative
Oncology Group (ECOG), smoking history, or baseline testosterone. The median time off treatment was 22.8 months. There was no difference between four and 10 months of ADT induction in the median off-treatment interval (p=0.38) (Fig. 1). PSA nadir <0.1, but not baseline PSA ≤ or >10, predicted for more prolonged time off treatment. There was no difference in time to testosterone recovery between the groups (median 7.2 months).
Conclusions: There was no difference in the duration of the off-treatment
interval between the four- and 10-month groups. This study suggests that a shorter course of ADT induction offers comparable benefit with respect to the duration of the off-treatment interval in men with PSA failure and may reduce the side effects and costs of ADT.
POD-04.03
Long-term followup of small renal masses: A prospective cohort study
Emily Whelan1, Jeffrey G. Himmelman1, Ross Mason1, Kara Thompson1, Ricardo A. Rendon1
1Department of Urology, Dalhousie University, Halifax, NS, Canada Introduction: Active surveillance (AS) has become the preferred treatment
for small renal masses (SRM) in elderly and the infirm. The vast majority of data comes from small retrospective series with short-term followup. We report the natural history of SRM in patients with a five-year median followup.
Methods: This prospective cohort included patients undergoing AS for
SRMs diagnosed between 2001 and 2011 in Nova Scotia. Age, sex, symp-toms at presentation, diameters at diagnosis (cm), tumour location (cen-tral, peripheral), degree of endophytic component (1–100%), tumour con-sistency (solid, cystic), and renal mass biopsy were evaluated. Outcomes observed included progression to treatment or metastatic disease and death, as well as tumour growth rate and its predictors.
Results: Of the 324 patients in the initial cohort, 103 patients with 107
SRMs were included in our analysis. Median followup time for patients on continued AS was 59.2 months and the median maximum diameter and volume at diagnosis were 2.1 cm (min 0.7 cm, max 6.6 cm) and 4.8 cm3 (min 0.1 cm3, max 129.7 cm3), respectively. 1.9% of patients
developed metastatic disease. In total, 45.6% of the population died from other causes and 1.9% died from kidney cancer. Of the patients on continued AS, 51.5% were alive without metastatic disease and 1.0% were alive with metastatic disease. The average growth rate of all SRMs was 6.2 cm3/year (standard error=2.2 cm3/year), with an average volume
at diagnosis of 9.3 cm3 (p=0.0043). Tumour growth rate was significantly
different between peripheral and central SRMs (p=0.0007), with periph-eral masses growing at a rate of 1.75 cm3/year (volume at diagnosis=7.9
cm3) and central masses growing at a rate of 17.3 cm3/year (volume at
diagnosis=11.4 cm3). Tumour growth rate of SRMs that were ³3 cm at
diagnosis was approximately 15 times greater than masses that had an initial diameter of <1 cm (23.5 cm3/year vs.3.0 cm3/year; p=0.0067). Conclusions: In this cohort with a median followup of five years, 45.6%
of patients died from other causes and only 1.9% developed metastatic disease. This demonstrates that AS is the preferred treatment for patients who are elderly or infirm. Tumour growth rate can be predicted by initial tumour size and tumour location.
POD-04.04
Dense dose combination of methotrexate/vinblastine/ doxorubicin/cisplatin vs. gemcitabine/cisplatin in patients with cT3-4a bladder cancer treated with radical cystectomy: A real-world experience
Wassim (Wes) Kassouf1, Homi Zargar2, Jay Shah3, Elisabeth Fransen van de Putte4, Kylea Potvin5, Kamran Zargar6, Bas van Rhijn4, Sia Daneshmand7, Jeff Holzbeierlein8, Phil Spiess6, Eric Winquist5, Simon Horenblas4, Colin Dinney3, Adrian Fairey9, Evan Kovac10, Laura Krabbe11, Michael Cookson12, Niels-E. B. Jacobsen9, Nilay Gandhi13, Joshua Griffin8, Jeff Montgomery14, Nikhil Vasdev15, Evan Yu16, Evanguelos Xylinas17, Nicholas Campain18, Marc Dall’Era19, Jo-An Seah20, Cesar Ercole10, Srikala Sridhar20, John McGrath18,
no. at risk
43 26 15 6 3 1 1 4-month
47 20 8 5 1 1 1 10-month
Sur
vival probability
1.0
0.8
0.6
0.4
0.2
0.0
0 6 12 18 24 30 36 42
Time of off-treatment interval (months) p=0.3792
4-month 10-month
Jonathan Aning18, Shahrokh Shariat21, Jonathan Wright16, Andrew Thorpe15, Todd Morgan14, Petros Grivas10, Andrew Stephenson10, Trinity Bivalacqua13, Scott North9, Daniel Barocas22, Yair Lotan11, Peter C. Black2
1Urology, McGill University Health Centre , Montreal, QC,
Canada; 2Vancouver Prostate Centre, University of British Columbia,
Vancouver, BC, Canada; 3Urology, MD Anderson Cancer Centre, Houston,
TX, United States; 4Urology, Netherlands Cancer Institute, Amsterdam,
Netherlands; 5Medical Oncology, Western University, London, ON,
Canada; 6GU Oncology, Moffitt Cancer Centre, Tampa, FL, United
States; 7Urology, USC Comprehensive Cancer Centre, Los Angeles,
CA, United States; 8Urology, University of Kansas, Kansas, KS, United
States; 9Urology and Medical Oncology, University of Alberta, Edmonton,
AB, Canada; 10Urology, Glickman Urological and Kidney Institute,
Cleveland, OH, United States; 11Urology, UT Southwestern, Dallas, TX,
United States; 12Urology, University of Oklahoma College of Medicine,
Oklahoma, OK, United States; 13Urology and Medical Oncology, Johns
Hopkins School of Medicine, Baltimore, MD, United States; 14Urology, <