_____________________________________________________________________________________________________
www.sciencedomain.org
Correlation of Body Composition with Pulmonary
Function in Adults
Namrata Agarwal
1and Sandip Meghnad Hulke
2*1
All India Institute of Medical Sciences, Bhopal, India.
2Department of Physiology, All India Institute of Medical Sciences, Bhopal, India.
Authors’ contributions
This work was carried out in collaboration between both authors. Both authors read and approved the final manuscript.
Article Information
DOI: 10.9734/BJMMR/2015/18065 Editor(s): (1) Gaetano Santulli, College of Physicians & Surgeons, Columbia University Medical Center, New York, NY, USA. Reviewers: (1) Anonymous, Turkey. (2)Diana C. Tapia-Pancardo, Biomedicine Unit, National Autonomous University of México, México. (3)Syed Hafeezul Hassan, Physiology, Liaquat National Medical College, Karachi, Pakistan. Complete Peer review History:http://www.sciencedomain.org/review-history.php?iid=1232&id=12&aid=9684
Received 1st April 2015 Accepted 1st June 2015 Published 9th June 2015
ABSTRACT
Context: General population has a wide variation in physical activities ranging from the people with sedentary lifestyle to people involved in regular physical activity; there is also variation amongst different age group. All these factors may produce wide variation in body composition and this in turn affects pulmonary function.
Aims: To see the correlation between various PFT parameters and various body composition parameters like body mass index (BMI), the fat percentage of the body mass (fat%), the fat-free mass (FFM), and the fat-free mass index (FFMI).
Settings and Design: Cross sectional study which was done on attendants of the patients visiting AIIMS Bhopal OPD
Methods and Materials: Two hundred and twenty three subjects (152 male and 71 female) in the age group of 18 to 48 years underwent the pulmonary function test and body composition assessment. Body composition was assessed using sex matched prediction equation based on skin fold thickness.
Statistical Analysis Used: Univariate correlation coefficient (Pearson) was used to check the relationship between various PFT parameters and body composition.
Results: In males, Fat percentage showed significant negative correlation with FEV1 (r=-0.198, p=0.014) and FEF 25-75%, p=0.0005). Fat free mas showed non-significant positive correlation with the most of the PFT parameters and fat free mass index showed significant negative correlation with the FEV1 (r=-0.164, p=0.04) and PIFR.(r=-0.174, p<0.0001). In females significant positive correlation was seen only between fat free mass and FVC. (r=0.32, p=0.005).
Conclusion: Body composition has a predominant effect on pulmonary function test in males. In females, some effect is also seen. So we recommend body composition assessment for PFT interpretation.
Keywords: Body composition; FEV1; FVC; fat free mass.
1. INTRODUCTION
Pulmonary function test is a basic and essential test for diagnosis and assessment of pulmonary dysfunction, pulmonary diseases, and treatment effects. Their interpretation depends on the reference values which should be obtained from studies in the normal or healthy subjects with the same anthropometric, ethnic, socioeconomic,
and environmental characteristics.
Anthropometric parameters include height and weight. These have been taken into account to calculate predicted value of the PFT parameters [1,2]. However weight or body mass comprises of fat free mass and fat mass. People who do regular exercise may have higher fat free mass and person with the sedentary lifestyle may have a higher fat mass. Thus individuals with same mass may have different body composition.
General population display wide variation in lifestyle; some do regular exercise while some have sedentary lifestyle. It also comprises of different age group. Fat percentage differs in amongst the different age groups. It increases with age. Obesity is prevalent in both developed and developing countries [3]. It has been estimated to affect 20 to 40% of the adults in the developing countries and 10 to 20% in the developed countries [4]. Thus general population consists of persons with the different body composition. Obesity may be associated with a number of pulmonary complications [5]. In contrast, athletes are known to have better respiratory function. We have come across the studies where relation between body mass index and pulmonary function test parameter was studied [6,7]. However body mass index may be high both in athletes as well as obese but their composition may be different. Thus body composition would be a better parameter than body mass index.
Studies regarding relation between body composition and pulmonary function test have
been done in foreign countries. They found contradictory results in males and females [5,6]. In India, similar studies had been done, however these studies had focused on young individual (adolescent and age group of 18 to 21 years). [7,8] Lad UP et al. [9] had stressed the need for longitudinal multi-centric study in a larger population.
In the present study, we have made an effort to find the relation between body composition and pulmonary function test. This study has enabled us to learn whether body composition has any effect on pulmonary function test. Thus it would assist in interpretation of pulmonary function tests.
2. SUBJECTS AND METHODS
This was a cross sectional study which was performed on attendants of the patients visiting AIIMS Bhopal OPD. Subjects in the age group of 18 to 48 years were enrolled for the study. Sample size was 223 with 152 males and 71 females. General and systemic examination was done, and then they underwent pulmonary function and body composition assessment. Detailed information about the study and procedure which they would be undergoing was given to the all subjects. The written informed consent was taken from all the subjects. Subjects with the history of smoking, H/o chronic respiratory disease, H/o cardiac disease, H/o diabetes, H/o drug intake known to affect respiratory function, examination finding suggestive of preexisting respiratory or cardiac disease, chest and abdominal pain for any cause, and oral or facial pain exacerbated by mouthpiece were excluded from the study.
2.1 For Pulmonary Function Test
AIIMS, OPD. The subjects were asked about the history of any physical activities which should be avoided before the lung function testing [1]. All the subjects were familiarised with the instrument and the procedure for performing the test. The data of the subject as regards to name, age, height, weight, sex, date of performing the test, atmospheric temperature and humidity were entered. Temperature and humidity were measured using digital temperature and humidity meter (HTC-1).
The tests were performed in sitting position. The subjects were asked to take full inspiration which was followed by as rapid and forceful expiration as possible in the mouthpiece. Three consecutive reading were recorded and the best reading among the three was selected.
PFT parameters were considered acceptable if they fell within the manoeuvre acceptability criteria. Guidelines given in the joint statements on lung function testing of the American Thoracic Society (ATS) and the European Respiratory Society (ERS) were followed [1,2].
PFT parameters studied were forced vital capacity (FVC), forced expiratory volume in 1 s (FEV1), FEV1 as percentage of FVC in % [FEV1 (%)], peak expiratory flow rate in L/s (PEFR), peak inspiratory flow rate in L/s (PIFR), forced expiratory flow rate in L/s in 25% of FVC (FEF25%), forced expiratory flow rate in L/s in 50% of FVC (FEF50%), forced expiratory flow rate in L/s in 75% of FVC (FEF75%), forced expiratory flow rate during 25-75% of expiration (FEF25-75%) and Minute Ventilation Volume (MVV).
For fat mass %: it was calculated from the sex matched prediction equation based fat fold thickness. (10) Fat fold thickness was measured at biceps, triceps, sub scapular, suprailiac regions (nearest to 0.1 mm) skin fold calliper (scientific & laboratory instrument & equipment). This was repeated thrice and the average was taken to nearest millimeter. Fat mass was calculated using fat % and weight. Fat free mass or lean body mass was calculated by deducting fat mass from the total body weight. Fat-free mass index was calculated by dividing Fat free mass by body surface area. Body surface area was calculated from height and weight.
Weight was measured with the digital weighing machine to the nearest 5 gm. Height was measured using the scale after the subject stood erect with the feet firmly in contact with platform and looking straight ahead in Frankfurt plane to the nearest millimeter.
Statistical analysis was done using Graph pad Prism 6 Software. Prior to formal statistical testing, frequency distributions were tested for normality using the Kolmogrof-Smirnov test. Univariate correlation coefficient (Pearson) was used to examine the relationship between various PFT parameter and body composition.
3. RESULTS
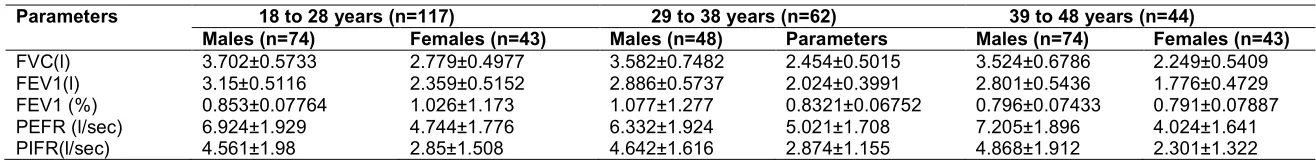
This was a cross sectional study which was done on attendants of the patients visiting AIIMS Bhopal OPD. One hundred and fifty two males (30.61 years±7.94) and seventy one females ((27.85 years±9.71) were involved in this study. General characteristics and body composition and pulmonary function parameters of the subject are displayed in Tables 1, 2 and 3. Distribution of the subjects as per BMI is shown in Fig. 1. Maximum number of the subjects (102 males and 40 females) had BMI within the normal range (18.5 to 24.99 kg/m2).
4
Table 1. General characteristics, body composition parameters of the subjects
Parameters 18 to 28 years (n=117) 29 to 38 years (n=62) 39 to 48 years (n=44)
Males (n=74) Females (n=43) Males (n=48) Females (n=14) Males (n=30) Females (n=14)
Age (yrs) 24.16 ±2.674 21.05±3.01 32.31±2.845 32.57±2.174 43.8±2.631 44.07±3.518
Height (cm) 1.681±0.08285 1.59±0.07621 1.685±0.06803 1.555±0.07625 1.664±0.191 1.539±0.04161
Weight (kg) 63.5±16.59 56.09±9.154 62.85±8.815 57.93±9.119 68.47±13.95 61.21±12.63
BMI (kg/m2) 22.4±5.622 22.15±3.09 22.15±2.809 24.02±3.968 23.56±5.82 25.73±4.645
BSA (m2) 1.713±0.2088 1.565±0.1457 1.714±0.1319 1.561±0.1324 1.755±0.2348 1.583±0.1659
Fat mass (kg) 9.328±4.881 12.27±3.057 10.87±2.445 14.33±3.296 14.28±5.054 17.08±4.833
% Fat 13.99±2.918 21.57±1.968 17.1±1.519 24.46±1.946 20.3±3.762 27.45±2.562
Fat free mass(kg) 54.17±11.82 43.83±6.13 51.98±6.398 43.6±5.855 54.18±9.282 44.14±7.871
Fat free mass index 19.12±3.898 17.31±2.102 18.32±2.013 18.07±2.548 21.02±11.56 18.56±2.814
Values are mean±SD
Table 2. Skin fold thickness of the subjects
Parameters 18 to 28 years (n=117) 29 to 38 years (n=62) 39 to 48 years (n=44)
Males (n=74) Females (n=43) Males (n=48) Parameters Males (n=74) Females (n=43)
Biceps fold (mm) 1.757±0.9905 3.524±0.5516 1.729±0.5739 3.857±0.663 2.167±1.262 4±0.8771
Triceps fold (mm) 5.554±1.931 7±1.091 5.375±1.003 7.357±1.216 6.433±2.373 7.929±1.592
Subscapular fold (mm) 10.3±2.885 10.63±1.574 10.13±1.511 11.21±1.847 11.63±3.681 11.79±2.359
Suprailiac fold (mm) 16.11±3.791 14.16±2.035 15.9±1.859 14.86±2.349 17.8±4.845 15.86±2.958
Total (mm) 33.72±9.526 35.21±5.081 33.13±4.796 37.26±5.727 38.03±12.11 39.67±7.639
Values are mean±SD
Table 3. Pulmonary function test parameters of the subjects
Parameters 18 to 28 years (n=117) 29 to 38 years (n=62) 39 to 48 years (n=44)
Males (n=74) Females (n=43) Males (n=48) Parameters Males (n=74) Females (n=43)
FVC(l) 3.702±0.5733 2.779±0.4977 3.582±0.7482 2.454±0.5015 3.524±0.6786 2.249±0.5409
FEV1(l) 3.15±0.5116 2.359±0.5152 2.886±0.5737 2.024±0.3991 2.801±0.5436 1.776±0.4729
FEV1 (%) 0.853±0.07764 1.026±1.173 1.077±1.277 0.8321±0.06752 0.796±0.07433 0.791±0.07887
PEFR (l/sec) 6.924±1.929 4.744±1.776 6.332±1.924 5.021±1.708 7.205±1.896 4.024±1.641
5
Parameters 18 to 28 years (n=117) 29 to 38 years (n=62) 39 to 48 years (n=44)
Males (n=74) Females (n=43) Males (n=48) Parameters Males (n=74) Females (n=43)
FEF25% (l/sec) 6.007±1.958 4.198±1.713 13.35±55.41 4.304±1.555 5.966±1.749 3.478±1.459
FEF25-75%(l/sec) 3.758±1.169 2.825±0.9591 3.073±1.145 2.341±0.7887 2.878±1.08 1.826±0.9334
FEF50% (l/sec) 4.332±1.291 3.258±1.122 3.705±1.313 2.977±1.019 3.679±1.34 2.236±0.9686
FEF75% (l/sec) 2.07±0.8293 1.611±0.6765 1.531±0.7692 1.093±0.5382 1.181±0.4452 0.8543±0.5049
MVV (l/m) 104.7±15.33 97.51±15.39 103±14.15 89.44±18.06 96.15±17.95 89.36±14.58
Values are mean±SD
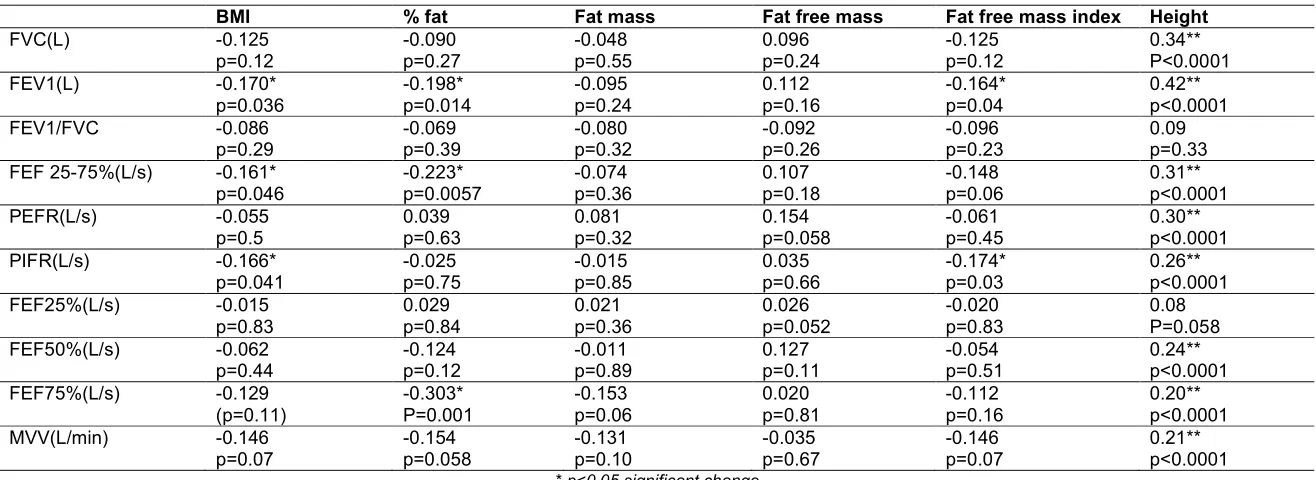
Table 4. Univariate correlation between body size, composition parameters and PFT parameters in males
BMI % fat Fat mass Fat free mass Fat free mass index Height
FVC(L) -0.125
p=0.12 -0.090 p=0.27 -0.048 p=0.55 0.096 p=0.24 -0.125 p=0.12 0.34** P<0.0001
FEV1(L) -0.170*
p=0.036 -0.198* p=0.014 -0.095 p=0.24 0.112 p=0.16 -0.164* p=0.04 0.42** p<0.0001
FEV1/FVC -0.086
p=0.29 -0.069 p=0.39 -0.080 p=0.32 -0.092 p=0.26 -0.096 p=0.23 0.09 p=0.33 FEF 25-75%(L/s) -0.161*
p=0.046 -0.223* p=0.0057 -0.074 p=0.36 0.107 p=0.18 -0.148 p=0.06 0.31** p<0.0001
PEFR(L/s) -0.055
p=0.5 0.039 p=0.63 0.081 p=0.32 0.154 p=0.058 -0.061 p=0.45 0.30** p<0.0001
PIFR(L/s) -0.166*
p=0.041 -0.025 p=0.75 -0.015 p=0.85 0.035 p=0.66 -0.174* p=0.03 0.26** p<0.0001
FEF25%(L/s) -0.015
p=0.83 0.029 p=0.84 0.021 p=0.36 0.026 p=0.052 -0.020 p=0.83 0.08 P=0.058
FEF50%(L/s) -0.062
p=0.44 -0.124 p=0.12 -0.011 p=0.89 0.127 p=0.11 -0.054 p=0.51 0.24** p<0.0001
FEF75%(L/s) -0.129
(p=0.11) -0.303* P=0.001 -0.153 p=0.06 0.020 p=0.81 -0.112 p=0.16 0.20** p<0.0001
MVV(L/min) -0.146
p=0.07 -0.154 p=0.058 -0.131 p=0.10 -0.035 p=0.67 -0.146 p=0.07 0.21** p<0.0001
6
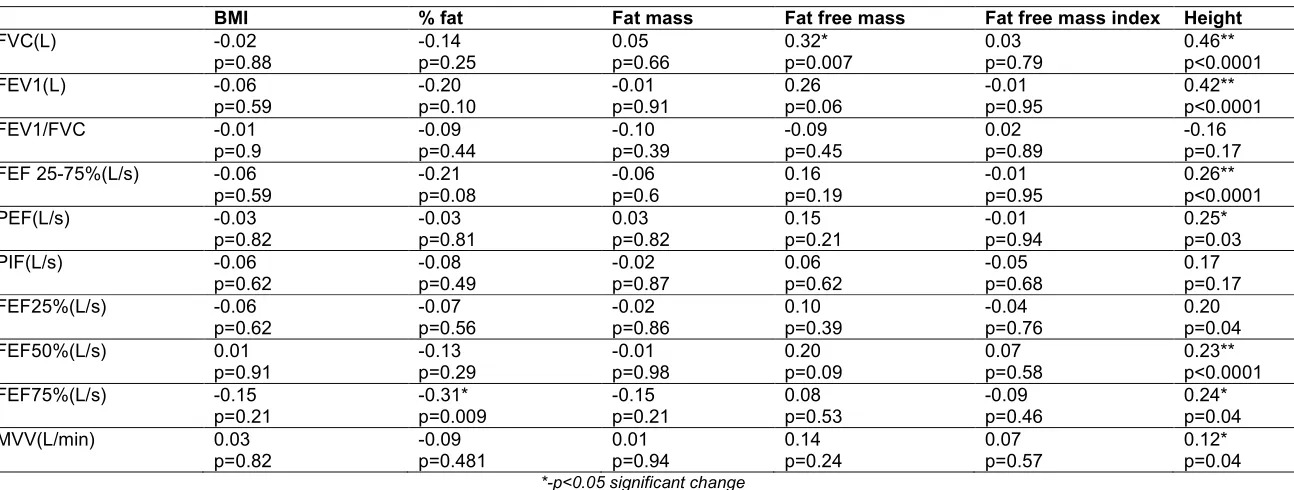
Table 5. Univariate correlation between body size, composition parameters and PFT parameters in females
BMI % fat Fat mass Fat free mass Fat free mass index Height
FVC(L) -0.02
p=0.88 -0.14 p=0.25 0.05 p=0.66 0.32* p=0.007 0.03 p=0.79 0.46** p<0.0001
FEV1(L) -0.06
p=0.59 -0.20 p=0.10 -0.01 p=0.91 0.26 p=0.06 -0.01 p=0.95 0.42** p<0.0001
FEV1/FVC -0.01
p=0.9 -0.09 p=0.44 -0.10 p=0.39 -0.09 p=0.45 0.02 p=0.89 -0.16 p=0.17
FEF 25-75%(L/s) -0.06
p=0.59 -0.21 p=0.08 -0.06 p=0.6 0.16 p=0.19 -0.01 p=0.95 0.26** p<0.0001
PEF(L/s) -0.03
p=0.82 -0.03 p=0.81 0.03 p=0.82 0.15 p=0.21 -0.01 p=0.94 0.25* p=0.03
PIF(L/s) -0.06
p=0.62 -0.08 p=0.49 -0.02 p=0.87 0.06 p=0.62 -0.05 p=0.68 0.17 p=0.17
FEF25%(L/s) -0.06
p=0.62 -0.07 p=0.56 -0.02 p=0.86 0.10 p=0.39 -0.04 p=0.76 0.20 p=0.04
FEF50%(L/s) 0.01
p=0.91 -0.13 p=0.29 -0.01 p=0.98 0.20 p=0.09 0.07 p=0.58 0.23** p<0.0001
FEF75%(L/s) -0.15
p=0.21 -0.31* p=0.009 -0.15 p=0.21 0.08 p=0.53 -0.09 p=0.46 0.24* p=0.04
MVV(L/min) 0.03
p=0.82 -0.09 p=0.481 0.01 p=0.94 0.14 p=0.24 0.07 p=0.57 0.12* p=0.04
Fig. 1. Distribution of the male and female subjects as per body mass index
4. DISCUSSION
The aim of the present study was to evaluate the effect of body composition on PFT parameters. Our hypothesis was that fat mass would have a negative effect on pulmonary function test parameters. In the present study, significant negative correlation was noticed between some of the PFT parameters and BMI fat percentage and fat free mass. Fat free mass showed non-significant positive correlation with the most of the PFT parameters. We got these findings in males, however in females; we got only significant correlation between FVC and fat free mass. Since we had included BMI and fat free mass index where the denominator is height, relation of the PFT parameters with the height
was also studied and significant positive correlation between height and PFT parameters was witnessed. Thus our hypothesis was supported up-to a certain degree.
significant positive correlation [5,6,8,9,12]. This forced us to investigate the relation between height and PFT parameters. Here we expected a positive correlation, and we also obtained a strong positive correlation with most of the PFT parameters. Fat free mass index is calculated from the fat free mass and height where height is in the denominator. Strong positive correlation with the height was responsible for the negative correlation in the present study.
Body weight or body mass mainly consists of fat free mass and fat mass. Fat free mass comprises of organ cell mass and non-fatty tissues, including skeletal muscle, tendons, ligaments and bone. Thus body weight may be increased as a result increase in fat free mass which occur with the exercise, another reason for increase body mass can be obesity where increase in fat mass occurs. Thus body mass index will be high both in athletes as well as in obese persons. Thus a high BMI lead to an incorrect interpretation of over fatness in lean individuals with the excessive muscle mass because of genetic make-up or exercise training [3]. Hence we had taken into account fat mass as well fat free mass along with the other variables. Feng K et al. [12] had suggested that FM and FFM are independent factors influencing ventilatory function in adults. FM is negatively correlated with ventilatory function, but FFM which is reflection of muscle mass is positively correlated with ventilatory function in adults. FFM includes skeletal muscle, tendons, ligaments, and bones. Spirometry is the physiological test that measures how an individual inhales or exhales volume of air as the function of the time. Thus power of the muscle plays important role in PFT and increased fat free mass will be associated with the improved PFT parameters. Regular exercise or regular physical activity is known to cause increase in fat free mass. Besides this body composition also changes with the age [13].
Obesity is state of excess adipose tissue mass. Obesity may be accompanied with a number of pulmonary abnormalities. This include reduced chest wall compliance, increased work of breathing, increased minute ventilation due to increased metabolic rate, and decreased total lung capacity and functional residual capacity. Weight loss can bring substantial improvement in pulmonary function [14]. Fat distribution has also been shown to affect lung function [15].
Angiogenesis may be one of factor for impairment of lung function seen in obesity. Angiogenesis play important role in lung pathophysiology not only in cancer but also in other chronic disease like chronic obstructive pulmonary disease and pulmonary hypertension. Increased angiogenesis is observed in cancer and pulmonary hypertension; however loss of capillary bed is seen in emphysema [16] Development of obesity is also associated with angiogenesis [17,18]. Activated adipocytes produce multiple angiogenic factors including vascular endothelial growth factor, placental growth factor, thrombopondins, leptin, angiopoietins, resistin, tissue factor, neuropeptide-y, tumor necrosis factor, fibroblast growth factor, hepatocyte growth factor, interlukin-6 which either alone or collectively stimulate neovascularization during fat mass expansion. Adipose tissue hypoxia and inflammation are considered to be responsible for release of these mediators. It had been shown that capillary endothelial cells communicate with adipocytes via paracrine signaling pathways, extracellular components, and direct cell-cell interactions [18,19]. Thus these angiogenic factors circulate everywhere which may cause angiogenesis in lung. Lung remodeling is seen as a result of angiogenesis and inflammation in COPD in preclinical stages in smokers [16]. Thus angiogenesis and low grade inflammation as a result of obesity may also cause impairment in pulmonary function test in obese persons.
Should body composition be determined in every case? Its determination may not be feasible in every case. In our study fat mass had shown negative correlation with PFT parameters in males. According to us, body composition should be determined in every overweight and obese person. However we recommend further multi centric studies in males and especially in females with a larger sample size.
4.1 Limitations of the Study
Sample size especially in the case of females was small; we recommend further studies with larger sample size. In the present study we had assessed body composition with the help of skinfold thickness using equations. Although we had taken utmost precaution while taking skin fold measurement, there is a chance of error which may get magnified while using the equation. Hence we recommend that body composition should be measured by at least two methods so to decrease the chances of error. Besides this, other parameters could have been studied like waist and hip circumferences, waist-to-hip ratio, and sagittal abdominal diameter. We could have compared PFT parameters in persons with the different body mass index. This was not possible in the present study, as there was large difference in sample size with different body mass index. We recommend further studies keeping this point in view.
5. CONCLUSION
To conclude, body composition has prominent effect on various pulmonary function test parameters in males. In females, some effect is also seen. So we advise body composition assessment for PFT interpretation especially in overweight and obese persons. However we suggest further multi-centric studies with larger sample size in males as well as females.
ETHICAL APPROVAL
Ethical approval was taken from institution ethics committee, AIIMS, Bhopal.
COMPETING INTERESTS
Authors have declared that no competing interests exist.
REFERENCES
1. Miller MR, Crapo R, Hankinson J, Brusasco V, Burgos F, Casaburi R, et al. General considerations for lung function Testing. Eur Respir J. 2005;26:153–161. 2. Miller MR, Crapo R, Hankinson J,
Brusasco V, Burgos F, Casaburi R, et al. Standardization for spirometry. Eur Respir J. 2005;26:319-338.
3. McArdle WD, Katch FI, Katch VL. The body composition assessment. In: McArdle WD, Katch FI, Katch VL, editor. Exercise physiology, Energy, Nutrition and Human Performance. 7th edition, Philadelphia, Baltimore, Newyork, London, Buenos Aires, HongKong, Sydney, Tokyo: WoltersKluwerhealth, Lippincott Williams. 2010;725-757.
4. WHO expert consultation. Appropriate body-mass index for Asian populations and its implications for policy and
intervention strategies. Lancet.
2004;363:157–63.
5. Park JE, Chung JH, Lee KH, Shin KC. The effect of body composition on pulmonary function. Tuberc Respir Dis. 2012;72:433-440.
6. Wang DY, Feng K, Chen L, Zu SY, Han SM, Zhu GJ. Relation between fat mass, fat free mass and ventilatory function in children and adolescents. Sheng Li XueBao. 2010;62:455-64.
7. Paralikar SJ, Kathrotia RG, Pathak NR, Jani MB. Assessment of pulmonary functions in obese adolescent boys. Lung India. 2012;29:236-40.
8. Joshi AR, Singh R, Joshi AR. Correlation of pulmonary function tests with body fat percentage in young individuals. Indian J Physiol Pharmacol.2008;52:383-8.
9. Lad UP, Jaltade VG, Lad SS,
Satyanarayan P. Correlation between body mass index (BMI), body fat percentage and pulmonary function in underweight, overweight and normal weight adolescent. Journal of Clinical and Diagnostic Research. 2012;6:350-353.
11. Saxena Y, Saaxena V, Dvivedi J. Evaluation of dynamic function tests in normal obese individuals evaluation. Indian J Physiol Pharmacol. 2008;52:375– 382.
12. Feng K, Chen L, Zu SY, Han SM, Zhu GJ.Sheng Li XueBao. Fat mass and fat free mass on ventilatory function in adults. Sheng Li Xue Bao.2010;25(62):122-8. 13. Barrett KE, Barman AM, Boitano S, Brools
HL. Cardiovasular regulatory mechanism. In: Barrett KE, Barman AM, Boitano S, Brools HL, editor. Ganong‘s Review Of Medical Physiology, 24th edition, New Delhi: McGraw Hill Publisher. 2012;3-31. 14. Luce JM. Respiratory complications of
obesity. Chest. 1980;78:626–631
15. Santana H, Zoico E, Turcato E, Tosoni P, Bissoli L, Olivieri M, Bosello O, Zamboni M. Relation between body composition, fat distribution, and lung function in elderly men. Am J Clin Nutr. 2001;73:827-31.
16. Matarese A, Santulli G. Angiogenesis in Chronic Obstructive Pulmonary Disease: A Translational Appraisal. Translational Medicine. 2012;3:49-56.
17. Lemoine AY, Ledoux S, Quéguiner I, Caldérari S, Mechler C, Msika S, et al. Link between Adipose Tissue Angiogenesis and Fat Accumulation in Severely Obese Subjects. J Clin Endocrinol Metab. 2012; 97:775-780.
18. Cao Y. Angiogenesis modulates
adipogenesis and obesity. J. Clin. Invest. 2007;117:2362–2368.
19. Lijnen HR. Angiogenesis and obesity Cardiovascular Research. 2008;78:286-293.
20. Barrett KE, Barman AM, Boitano S, Brools HL. Cardiovasular regulatory mechanism. In: Barrett KE, Barman AM, Boitano S, Brools HL, editor. Ganong‘s Review Of Medical Physiology, 24th edition, New Delhi: McGraw Hill Publisher. 2012;621-40.
© 2015 Agarwal and Hulke; This is an Open Access article distributed under the terms of the Creative Commons Attribution License (http://creativecommons.org/licenses/by/4.0), which permits unrestricted use, distribution, and reproduction in any medium, provided the original work is properly cited.
Peer-review history:
The peer review history for this paper can be accessed here: