O R I G I N A L R E S E A R C H
The prognostic value of the lymphocyte-to-monocyte
ratio for high-risk papillary thyroid carcinoma
This article was published in the following Dove Press journal: Cancer Management and Research
Linlin Song 1,2
Jingqiang Zhu1
Zhihui Li1,3
Tao Wei1,3
Rixiang Gong1,3
Jianyong Lei1
1Thyroid and Parathyroid Surgery Center,
West China Hospital of Sichuan
University, Chengdu 610041, People’s
Republic of China;2West China School of
Medicine, Sichuan University, Chengdu 610065, People's Republic of China;
3Thyroid and Breast Surgery Center,
Chengdu Shang Jin Nan Fu Hospital,
Chengdu 611700, People’s Republic of
China
Background and Aims: The prognosis of papillary thyroid carcinoma (PTC) is highly variable, even for high-risk cases. The predictive and prognostic role of the lymphocyte-to-monocyte ratio (LMR) has been reported in other cancers. The aim of our present study was to explore the value of LMR prognostic prediction in high-risk PTC patients.
Patients and Methods:Two hundred and twenty-four PTC high-risk cases at West China Hospital were randomized into a training set (112 cases) and testing set (112 cases), while 48 cases in Shang Jin Nan Fu Hospital were included as the external validation set.
Results:A lower preoperative LMR correlated with larger tumor size, advanced N and M stages, and an increased number of multiple PTC cases in the training, testing, and validation sets (allP<0.05 in the three sets). Patients with a high LMR exhibited significantly improved overall and PTC-free survival compared with those of patients with a low LMR in the training, testing, validation, and combined sets (all P<0.05 in the individual and combined sets). Moreover, multivariate analyses identified the LMR as an independent prognostic factor for overall and PTC-free survival. The nomograms for predicting the 5-year mortality and PTC recurrence were developed based on the risk factors in the training set and validated in the independent testing and validation sets.
Conclusion:The preoperative LMR was identified as an independent prognostic factor that could be incorporated into the two nomograms with other risk factors to predict overall survival and PTC-free survival for individual patients.
Keywords: lymphocyte-to-monocyte ratio, papillary thyroid carcinoma, lymph node metastasis, recurrence
Introduction
The incidence of papillary thyroid carcinoma (PTC) continues to increase worldwide.1
PTC exhibits a broad range of clinical behaviors ranging from indolent tumors with low
mortality in most cases to very aggressive malignancies.2 According to the 2015
American Thyroid Association (ATA) recurrence risk stratification,3the postoperative
recurrence rate of low-risk PTCs is less than 5%; however, that of high-risk PTCs can
reach more than 20%.2Thyroidectomy and metastatic lymph node dissection remain
the main curative treatments for PTCs; for high-risk PTC cases, postoperative 131-I is an important possible adjuvant treatment. However, the recurrence rates for high-risk patients are high and variable, largely due to locoregional recurrence, metastases or
radioiodine (RAI) refractoriness. Therefore, an urgent precise classification of
high-risk PTC is needed to better predict patient outcomes and adjuvant RAI responses.
Recently, certain systemic inflammatory markers, such as the
lymphocyte-to-mono-cyte ratio (LMR), have been reported as predictive and prognostic factors for human
Correspondence: Jianyong Lei
Thyroid and Parathyroid Surgery Center, West China Hospital of Sichuan
University, Chengdu 610041, People’s
Republic of China Tel +86 288 542 3822 Fax +86 288 542 3822 Email leijianyong11@163.com
Cancer Management and Research
Dove
press
open access to scientific and medical research
Open Access Full Text Article
Cancer Management and Research downloaded from https://www.dovepress.com/ by 118.70.13.36 on 20-Aug-2020
cancers.4–6 However, the prognostic predictive role of the LMR remains unclear in PTCs, especially in high-risk PTCs with increased risk of recurrence/metastasis or mortality. In
our previous study,7we reported that a lower preoperative
LMR was related to a higher rate of lymph node metastasis (LNM) in medullary thyroid carcinoma (MTC). Therefore, the incorporation of the LMR into a prognostic model might add prognostic value to further stratify and better manage high-risk patients with different prognoses.
According to the 2015 ATA guidelines,3high-risk PTC
was defined as cases meeting any of the following
char-acteristics: gross extrathyroid extension (GEE), distant metastases, and LNM for which the largest tumor diameter
is at least 3 cm2. The recurrence/metastasis rate ranged
from 20% to 72%.3,8This risk-stratification system cannot
be applied to individuals due to its noncontinuous nature. Additional insights could be gained by appreciating that the risk of structural disease recurrence is a continuum of
risk, as recommended in the 2015 ATA guidelines.3
In our present study, we explored the relationship of the preoperative LMR with PTC clinical characteristics and clinical outcomes and attempted to establish a nomo-gram based on risk factors to predict the possibility of recurrent/metastasis or mortality in high-risk PTC
indivi-duals by obtaining a specific risk value.
Methods
In our present study, we enrolled 3 independent sets of PTC patients from 2 medical hospitals in Sichuan, China. The inclusion criteria were PTCs with GEE, distant metas-tases or LNM for which the largest tumor diameter was at least 3 cm. The exclusion criteria were the presence of other histological thyroid cancers, such as MTC and ana-plastic thyroid cancer; additional operations; and previous other cancers. Based on these criteria, 224 cases in West China Hospital (Wuhou, Sichuan) from Jan 2010 to Dec 2016 were included and then randomized into two groups
using the sealed envelope method (https://www.sealedenve
lope.com/): the training and testing sets included 112 cases each. An additional 48 cases (from Dec 2012 to Dec 2016) met the inclusion and exclusion criteria from Chengdu Shang Jin Nan Fu Hospital (Pixian, Sichuan) and were set as the external validation group. This study was approved by the Clinical Research Ethics Committee of the two hospitals, and the patients or their families signed the informed consent form. The study complied with the standards set by the Declaration of Helsinki.
The GEE definition was based on the surgeon’s
dis-covery of GEE during the operation and the pathologist’s
subsequent designation of pT4;9 distant metastases were
evaluated mainly by imaging screening and then
con-firmed by 3–5 mCi of 131-I for scanning. The surgical
protocols for PTC were mainly total or near total thyr-oidectomy combined with bilateral central compartment lymph node dissection; lateral compartment lymph node
dissection was performed only therapeutically (when fine
needle aspiration (FNA) cytology or thyroglobulin assess-ment proved metastasis). The details of the surgical
pro-cedure and postoperative adjuvant therapies were
described in our previous study.10 Postoperative RAI
therapy could be empiric (30–200 mCi) for these
high-risk PTC cases at 6 months post surgery. RAI refractory
was defined in one of the following four ways:3 the
metastatic tissue did not ever concentrate RAI; metastatic tissue lost the ability to concentrate RAI; RAI was con-centrated in some lesions but not in others; and metastatic
disease progressed despite significant concentration of
RAI. The PTC patient lists were gathered from the two
hospitals’ information centers, and the clinical baseline,
surgical data and postoperative recovery data were then retrospectively collected manually from the His-medical system. Based on the inclusion and exclusion criteria, follow-up of the 272 cases was performed by evaluating out-patient follow-up medical records combined with phone interviews.
All of the data were input into an Excelfile and then
imported into SPSS 22.0 (IBM Corporation, Armonk, USA) for statistical analysis. The association between the clinicopathological features and preoperative LMR level
was evaluated by the chi-square test or Fisher’s exact test.
Univariate and multivariate regression analyses were used to identify independent prognostic factors in the three sets,
andP<0.05 was defined as the criterion for variable
dele-tion when performing backward stepwise selecdele-tion. Based
on the identified risk factors, a nomogram of risk factors
associated with recurrence was established in R software studio. The predictive performance of this model was evaluated in the test and validation sets using the concor-dance index (C-index). Kaplan-Meier analysis was used to determine the overall survival (OS) and tumor-free survi-val. A log-rank test was used to compare the survival
between subgroups. A two-tailed test P-value less than
0.05 was considered significant.
Cancer Management and Research downloaded from https://www.dovepress.com/ by 118.70.13.36 on 20-Aug-2020
Results
PTC patient demographics and
clinicopathological characteristics
The PTC patient baseline characteristics are summarized in Table S1. There were fewer patients of an older age (>55) in the validation set than in the training and testing sets (4.2% vs. 12.5% and 8.9%, respectively). These heterogeneities might help ensure that our nomo-gram is universally applicable because the age-related
heterogeneities and heterogeneous populations of
patients may be different in different districts and
conditions.11 There were no significant distribution
dif-ferences between patients with or without the BRAF V600E mutation in the three sets. This result was mainly due to the later inclusion of the BRAF V600E test at Shang Jin Nan Fu Hospital than at West China Hospital.
Receiver operator characteristic (ROC)
curve to determine the cutoff value
We performed ROC curve analyses of the OS to select the
best LMR cutoff point, as shown inFigure 1A(AUC=0.654,
P=0.004). The best and most objective LMR cutoff value for
predicting OS was 4.0 with the best sensitivity (0.832) and
specificity (0.441), as shown in Figure 1B (AUC=0.637,
P=0.010).
Association of the preoperative LMR with
PTC tumor characteristics
The relationships between the preoperative LMR and clin-ical or tumor features in the training, testing and validation
sets are shown in Table 1. A lower preoperative LMR
correlated with a larger tumor size (allP-values less than
0.05 in the three sets), advanced N stage (P=0.011,
P<0.001, and P=0.048) and M stage (P=0.003, P=0.024,
and P=0.007), more multiple PTC cases (P=0.001,
P<0.001, and P=0.045), and more cases with the largest
nodule larger than 3 cm (P=0.048,P=0.033, andP=0.023)
in the training, testing, and validation sets, respectively. A lower LMR was also negatively correlated with the LNM
number in the testing set (P=0.009), whereas such a
cor-relation was not found in the training and validation sets.
Thisfinding was mainly due to our selection of cases that
were all high-risk with PTCs that were usually invasive.
Correlation between the LMR and
prognosis of high-risk ptcs
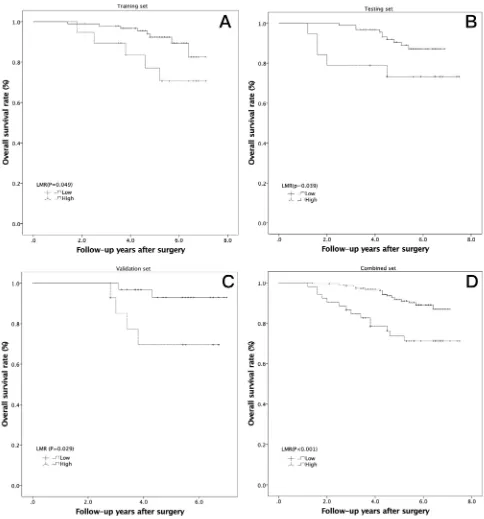
Kaplan-Meier analysis was conducted to investigate the prognostic value of the preoperative LMR, and a log-rank test was used to compare the overall and PTC-free survival between the low- and high-LMR groups.
Patients with a high LMR gained a significant overall
benefit over those with a low LMR in the training
Figure 1Receiver operator characteristic curve analysis to predict overall survival for high-risk PTCs using the LMR in the pooled analysis. (A) The preoperative LMR can be used to predict overall survival (AUC=0.654,P=0.004); (B) the preoperative LMR=4.0 is the best cutoff to predict overall survival (AUC=0.637,P=0.010).
Cancer Management and Research downloaded from https://www.dovepress.com/ by 118.70.13.36 on 20-Aug-2020
Table 1Relationships between the preoperative LMR and clinical or tumor features in three sets of PTC patients with a high risk of recurrence. A lowser preoperative LMR correlated with a larger tumor size, advanced N stage and M stage, more multiple PTC cases, and more cases with the largest nodule larger than 3 cm in the 3 sets
Factor Training set Testing set Validation set
Preoperative LMR Preoperative LMR Preoperative LMR
Low (<4) High (≥4) P Low (<4) High (≥4) P Low (<4) High (≥4) P
All patients 19 93 19 93 14 34
Age (years) 0.728 0.566 0.476
<45 10 53 12 65 9 18
≥45 9 40 7 28 5 16 0.096
Age (years) 0.188 0.540 33 0.096
<55 18 77 18 84 12 33
≥55 1 16 1 9 2 1
Sex 0.552 0.742 0.205
Female 14 31 14 65 12 23
Male 5 62 5 28 2 11
BMI (kg/m2) 0.059 0.358 0.195
<24 16 50 13 53 12 22
≥24 3 43 6 40 2 12
Largest tumor size 0.002* 0.014 0.017
<4 cm 11 83 12 87 8 29
≥4 cm 8 10 7 6 6 5
Total tumor size 0.001* <0.001 0.037
<4 cm 8 74 10 82 7 26
≥4 cm 11 19 9 11 7 8
Intra-thyroid PTC 0.001* <0.001 0.045
Single 7 69 10 74 8 31
Multiple 12 24 9 19 6 3
T classification 0.258 0.112 0.374
T1–T3 4 32 3 31 6 10
T4 15 61 16 62 8 24
N classification 0.011* <0.001* 0.048*
N0/N1a 1 27 1 20 0 8
N1b 18 66 18 73 14 26
Distant metastasis 0.003* 0.024* 0.007*
No 11 75 11 76 8 28
Yes 8 18 8 17 6 6
LNM number 0.210 0.009* 0.102
<15 10 63 8 68 3 16
≥15 9 30 11 25 11 18
Largest LNM diameter 0.048* 0.033* 0.023*
<3 cm 11 71 11 75 7 28
≥3 cm 8 22 8 18 7 6
Notes:*P<0.05.
Abbreviations:BMI, body mass index; PTC, papillary thyroid carcinoma; T, tumor invasion depth; N, lymph node involvement; TNM, tumor node metastasis; LNM, lymph node metastasis.
Cancer Management and Research downloaded from https://www.dovepress.com/ by 118.70.13.36 on 20-Aug-2020
(Figure 2A, P=0.048), testing (Figure 2B, P=0.039),
validation (Figure 2C, P=0.029), and combined sets
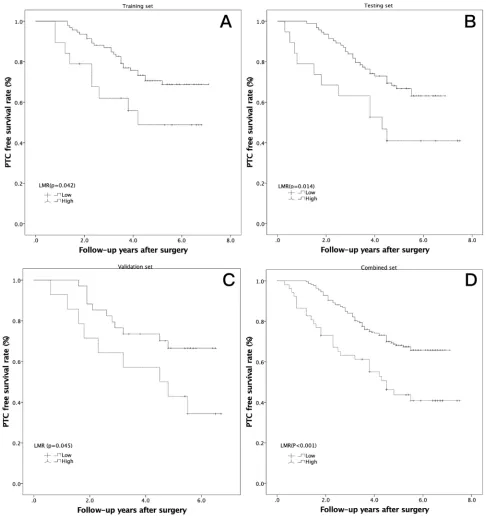
(Figure 2D, P<0.001). The high-LMR cases also had
an increased PTC-free survival benefit in the training
(Figure 3A, P=0.042), testing (Figure 3B, P=0.014),
validation (Figure 3C, P=0.045), and combined sets
(Figure 3D, P<0.001).
Association between the LMR and
postoperative RAI refractory
Thirteen cases in the training set, 15 cases in the testing set and
7 cases in the validation set were classified as refractory to
RAI after 2–6 sessions. When we compared the LMR values
between the RAI refraction cases with the non-RAI refraction cases, the preoperative LMR of the RAI refraction cases was
Figure 2Kaplan-Meier analysis of overall survival in high-risk PTCs according to the LMR in 3 independent sets. (A) Training set (P=0.049); (B) testing set (P=0.039); (C) validation set (P=0.029); (D) combined set (P<0.001).
Cancer Management and Research downloaded from https://www.dovepress.com/ by 118.70.13.36 on 20-Aug-2020
significantly lower than that of the non-RAI refraction cases in
two sets (4.5±2.3 vs. 5.9±2.0,P=0.020 in the training set; 4.8
±2.6 vs. 6.2±1.9,P=0.012 in the testing set; and 4.1±2.7 vs. 5.7
±2.8 in validation set, which did not reach significance,
P=0.163). When we combined these three sets as a pooled
set, this phenomenon was also observed (4.5±2.4 vs. 6.0±2.1,
P<0.001).
Univariate and multivariate regression
analyses of overall survival and ptc-free
survival
Univariate Cox regression analysis identified clinical and
tumor factors significantly associated with OS, as shown
in Table 2; the largest tumor size (P=0.037), total tumor
Figure 3Kaplan-Meier analysis of PTC-free survival in high-risk PTCs according to the LMR in 3 independent sets. (A) Training set (P=0.042); (B) testing set (P=0.014); (C) validation set (P=0.045); (D) combined set (P<0.001).
Cancer Management and Research downloaded from https://www.dovepress.com/ by 118.70.13.36 on 20-Aug-2020
Table 2Univariate Cox regression analyses of overall survival in three sets of high-risk PTC patients. The largest tumor size, total tumor size, distant metastasis, LNM number, and preoperative LMR in the training set were significant. In contrast, only distant metastasis and the preoperative LMR were risk factors for OS in the testing set, and the largest tumor size, total tumor size, distant metastasis, and preoperative LMR were significant in the validation set
Factors Overall survival
Training set Testing set Validation set
HR (95% CI) P HR (95% CI) P HR (95% CI) P
Age (years) 0.126 0.713 0.182
≤55 1 (reference) 1 (reference) 1 (reference)
>55 2.520 (0.772 to 8.230) 0.683 (0.090 to 5.200) 4.331 (0.503 to 37.260)
Gender 0.204 0.743 0.828
Female 1 (reference) 1 (reference) 1 (reference)
Male 2.658 (0.589 to 11.994) 0.836 (0.286 to 2.445) 0.828 (0.151 to 4.530)
BMI (kg/m2) 0.711 0.965 0.590
<24 1 (reference) 1 (reference) 1 (reference)
≥24 1.229 (0.413 to 3.660) 0.997 (0.348 to 2.746) 0.627 (0.115 to 3.426)
Largest tumor size 0.037* 0.297 0.014*
<4 cm 1 (reference) 1 (reference) 1 (reference)
≥4 cm 2.280 (1.072 to 10.034) 1.962 (0.553 to 6.954) 8.439(1.542 to 46.201)
Total tumor size 0.025* 0.882 0.043*
<4 cm 1 (reference) 1 (reference) 1 (reference)
≥4 cm 3.490 (1.171 to 10.400) 1.100 (0.310 to 3.903) 5.001 (1.915 to 27.338)
Intra-thyroid PTC 0.471 0.192 0.743
Single 1 (reference) 1 (reference) 1 (reference)
Multiple 1.673 (0.561 to 4.992) 1.991 (0.708 to 5.600) 1.688 (0.800 to 5.907)
T classification 0.198 0.329 0.949
T1-T3 1 (reference) 1 (reference) 1 (reference)
T4 2.691 (0.596 to 12.157) 1.878 (0.530 to 6.657) 1.057 (0.193 to5.780)
N classification 0.181 0.590 0.509
N0/N1a 1 (reference) 1 (reference) 1 (reference)
N1b 4.027 (0.523 to 31.033) 1.505 (0.340 to 6.670) 25.964 (0.002 to 40.728)
Distant metastasis 0.039* <0.001* 0.028*
No 1 (reference) 1 (reference) 1 (reference)
Yes 3.156 (1.5058 to 9.414) 13.537 (4.271 to 42.906) 6.759 (1.236 to 36.964)
LNM number 0.003* 0.166 0.232
<15 1 (reference) 1 (reference) 1 (reference)
≥15 7.292 (2.003 to 26.541) 2.049 (0.742 to 5.655) 3.707 (0.433 to 31.749)
Largest LNM diameter 0.171 0.640 0.663
<3 cm 1 (reference) 1 (reference) 1 (reference)
≥3 cm 2.144 (0.719 to 6.391) 1.314(0.418 to 4.129) 1.459(0.267 to 7.972)
Preoperative LMR 0.031* 0.049* 0.042*
Low 1 (reference) 1 (reference) 1 (reference)
High 0.340 (0.110 to 0.912) 0.340 (0.116 to 0.997) 0.185 (0.034 to 0.912)
Notes:*P<0.05.
Abbreviations:HR, hazard ratio; 95% CI, 95% confidence interval; T, tumor invasion depth; N, lymph node involvement; LNM, lymph node metastasis.
Cancer Management and Research downloaded from https://www.dovepress.com/ by 118.70.13.36 on 20-Aug-2020
size (P=0.025), distant metastasis (P=0.039), LNM
num-ber (P=0.003), and preoperative LMR (P=0.031) in the
training set were significant. In contrast, only distant
metastasis (P<0.001) and the preoperative LMR
(P=0.049) were risk factors for OS in the testing set, and
the largest tumor size (P=0.014), total tumor size
(P=0.043), distant metastasis (P=0.028), and preoperative
LMR (P=0.042) were significant in the validation set. As
shown in Table 3, variables demonstrating a significant
effect on OS were included in the multivariate analysis.
The largest tumor size (P=0.044, P=0.032, P=0.048 and
P=0.045, respectively), distant metastasis (P=0.045,
P<0.001, P=0.050 and P<0.001, respectively), and
preo-perative LMR (P=0.018,P=0.019, P=0.048 andP=0.020,
respectively) were identified as independent prognostic
factors associated with OS in the 3 sets and in the pooled analysis.
As shown inTable S2, the largest tumor size (P=0.016,
P=0.017 and P=0.045), distant metastasis (P=0.031,
P<0.001 and P=0.023), largest LNM diameter (P=0.008,
P=0.048 and P=0.011), and preoperative LMR (P=0.048,
P=0.018 and P=0.042) were risk factors for PTC-free
survival in the training, testing and validation sets,
respec-tively, and the total tumor size (P=0.021) and T classifi
ca-tion (P=0.013) were identified as risk factors in only the
training set. As shown in Table S3, variables
demonstrat-ing a significant effect on PTC-free survival were included
in the multivariate analysis. The largest tumor size
(P=0.049,P=0.038,P=0.050 andP=0.045), distant
metas-tasis (P=0.016, P<0.001, P=0.014 and P=0.002), largest
LNM diameter (P=0.048, P=0.024, P=0.034 and
P=0.033), and preoperative LMR (P=0.018, P=0.037,
P=0.049 and P=0.021) were identified as independent
prognostic factors associated with OS in the 3 sets and in the pooled analysis, respectively.
Nomogram for predicting OS and
ptc-free survival
As shown inTables 3andS3, all risk factors that showed
significance in the training set were included in the
nomo-gram, tested by the testing set and validated by the
valida-tion set. As shown in Figure 4, the likelihood of 5-year
mortality (Figure 4A) and recurrence (Figure 4B) in
indi-vidual PTC patients was easily calculated. Gathering these risk factor data, each risk factor can be used to obtain a number of points. Then, the points are added to calculate
their total number. From the total-points axis, a line can be Table
3 Multivariate Cox regr ession analyses of ov erall sur vival in the training, testing, validation, and combined sets. The largest tumor size, distant m etastasis, and pr eoperativ e LMR w er e identi fi ed as independent pr ognostic factors associated with ov erall sur vival in the 3 sets and in the pooled analysis Sets V ariables T raining Set HR 95% CI P -value T esting Set HR 95% CI P -value V alidation Set HR 95% CI P -value Combined Set HR 95% CI P -value Largest tumor size (<4/ ≥ 4 cm) 2.231 1.114 – 4.251 0.044* 1.688 1.281 – 2.491 0.032* 2.469 1.071 – 3.112 0.048* 2.998 1.181 – 13.606 0.045* T otal tumor size (<4/ ≥ 4 cm) 3.513 1.622 – 19.828 0.045* 3.338 0.810 – 28.118 0.936 2.929 0.923 – 4.995 0.299 3.556 0.127 – 12.427 0.435 Distant metastasis (No/Y es) 3.329 1.027 – 10.792 0.045* 13.918 4.089 – 47.378 <0.001* 6.177 1.001 – 38.122 0.050 5.386 2.631 – 11.027 <0.001* LNM number (<15/>15) 6.645 1.770 – 24.954 0.005* 4.782 0.862 – 12.339 0.126 3.230 0.898 – 15.408 0.087 2.234 0.865 – 4.686 0.033* Pre operative LMR (High/low) 3.714 1.724 – 12.441 0.018* 4.457 1.140 – 14.911 0.019* 2.469 1.071 – 3.112 0.048* 2.644 1.290 – 11.432 0.020* Notes: * P <0.05.
Cancer Management and Research downloaded from https://www.dovepress.com/ by 118.70.13.36 on 20-Aug-2020
drawn down to the risk axis. Then, the risk of 5-year mortality and recurrence can be calculated for individual patients. In the internal (testing set) and external
(validation set) validation cohorts, the C-indexes of the PTC recurrence nomogram were 0.78 (95% CI: 0.67 to 0.86) and 0.77 (95% CI: 0.64 to 0.82), respectively.
Figure 4Nomogram for predicting high-risk PTC patient mortality (A) and PTC recurrence (B) for individual high-risk PTC patients. We can calculate the risk of early recurrence as follows. After obtaining the risk factor data, each risk factor can be used to calculate the number of points. Then, the points are added to obtain a total value. On the total-points axis, a line is drawn down to the risk axis. Then, the risk probabilities of mortality (A) and PTC recurrence (B) can be calculated for individual patients.
Cancer Management and Research downloaded from https://www.dovepress.com/ by 118.70.13.36 on 20-Aug-2020
Therefore, the proposed nomograms performed well for all high-risk PTC cases.
Discussion
Our study might be considered one report in the context of
several on the LMR in various human cancers;5,12however,
our present study has some potential innovations. First, to our
knowledge, this is thefirst study on the relationship between
the preoperative LMR of PTC patients and PTC features or
prognosis. Second, we further stratified the high-risk PTCs
according to the 2015 ATA guidelines. Third, a nomogram was developed based on the risk factors and can be used to
calculate individual patients’ 5-year mortality and PTC
recurrence risks. Fourth, we detected that patients with a low LMR were more likely to be RAI-refractory than those with a high LMR. Finally, all of the results were tested in the internal cohort patients (testing group) and validated in the external cohort patients (validation group).
Inflammation plays a crucial role in cancer
develop-ment and progression13and could be a key determinant of
outcomes in cancer patients.14 Inflammation can destroy
cancer cells but also establishes a tumor microenvironment
that facilitates cancer cell proliferation.14 Several infl
am-matory parameters have been reported, and some have been converted to ratios such as the neutrophil to lympho-cyte ratio (NLR) and LMR. Lympholympho-cytes are key immune cells, and a low lymphocyte count has been frequently observed in patients with advanced cancer and is
asso-ciated with a poor OS in various cancers.15,16Monocytes
are also major immune cells and are recruited into tumors and alter the tumor microenvironment to promote cancer
cell progression through immune suppression and
angiogenesis.17,18 Moreover, a low ratio of peripheral
lymphocytes to monocytes has been associated with advanced PTC stage features, including larger tumor sizes, advanced lymph node stages and metastases, in our
analysis and is identified as a poor prognostic indicator,
including lower OS and PTC-free survival rates, which is
consistent with previous studies on other cancers.5,19
However, the potential mechanism by which low-LMR PTC cases were more likely to be RAI-refractory was not explained in our present study. Lymphocytes or mono-cytes might change the expression of the sodium/iodide symporter, which is the main mechanism of a RAI-refrac-tory status. Future research is needed regarding this issue. The cutoff values of the LMR range greatly, from 2.0 in
urothelial cancer to 5.26 in endometrial cancer,12and there
is no reference cutoff value for PTC patients; however, we
detected the cutoff value by ROC curve analysis and
confirmed this value in our further analysis.
Our present study included only high-risk PTCs and excluded low- and intermediate-risk cases. Two reasons
contributed to this selection: first, low-risk patients have
an excellent prognosis, with only 2–3% experiencing
recurrence and a nearly 1% 10-year mortality rate.
Intermediate-risk patients exhibit a 5–8% recurrence rate
and a 2–5% 10-year mortality rate.3These data encourage
the performance of a multiple-center, large-cohort case
analysis to determine the significance, and we are planning
this study in the future. Second, one aim of this study was to stratify high-risk PTCs with very diverse prognoses, and our multivariate analysis and nomogram achieved this goal. With a median of 5.3 years of follow-up, the overall recurrence rate was 37.5%, which was comparable to those
reported in previous studies;20 Pitoia et al21 reported 171
high-risk PTC cases, with a median follow-up of 4 years and a recurrence rate of 31.0%, which is slightly lower
than ours. Tuttle et al22 reported a high-risk PTC patient
recurrence of 68.0% with a median follow-up of 7 years. This large gap among previous studies might be caused by selection bias, and none of these studies attempted to further stratify high-risk PTCs.
This study provides some practical suggestions or tools in clinical practice for not only postoperative surveillance but also for some predictive preoperative risk factors. In
our present study, we stratified high-risk PTCs using
mul-tivariate analysis and provided a certain likelihood of mortality or recurrence using nomograms. Our proposed nomograms could also be used to design a follow-up protocol after surgery and to select the proper candidates to receive potentially effective adjuvant therapy such as RAI. Furthermore, these models might facilitate commu-nication between doctors and patients regarding the
prog-nostic analysis and postoperative sequential therapy.23Our
study proved that a lower preoperative LMR was corre-lated with advanced N and M stages in the training,
test-ing, and validation sets (allP<0.05 in the three sets). Our
results not only help establish the follow-up protocol but also provide some useful information for preoperative surgical planning. As reports have widely discussed, the role of lymph node dissection in the treatment of PTC has been controversial, and the best indicators for routine or
therapeutic neck dissection remain a subject of research.24
A low preoperative LMR may be a basis for the prophy-lactic dissection of lymph nodes in PTC patients.
Furthermore, in addition to PTC, the inflammation
Cancer Management and Research downloaded from https://www.dovepress.com/ by 118.70.13.36 on 20-Aug-2020
parameter can also be used in“follicular
neoplasms/suspi-cious for follicular neoplasms” to help the preoperative
diagnosis of malignant nodules, as discussed in a large
research study,25but further studies are needed.
Our study has the following limitations: 1) as a retro-spective study, the pathological variables included in the analysis were according to the original pathological diag-nosis reports from the Department of Pathology and were not re-evaluated; 2) due to the routine follow-up protocol according to the guidelines and limitations of medical insurance, routine postoperative blood examinations are not recommended, and postoperative changes in the LMR could therefore not be obtained in our present study; 3) the nomograms need to be validated by a larger cohort at multiple centers; and 4) while the preoperative
LMR was sufficiently evaluated in our study, using the
postoperative LMR to monitor the tumor load also makes
sense.26,27 However, because this was a retrospective
study, we paid attention to the thyroid, parathyroid, and nerve functions. We did not include the postoperative LMR into our routine examination during the follow-up period. Furthermore, the 2015 ATA guidelines did not recommend routine blood tests after surgery. Further stu-dies on this topic are warranted.
In conclusion, we determined that a low preoperative LMR is a risk factor for an RAI-refractory status, mortality and recurrence. Furthermore, we developed two nomo-grams to objectively and accurately predict OS and PTC-free survival in high-risk PTC patients.
Abbreviations
ATA, American Thyroid Association; PTC, papillary thyr-oid carcinoma; LMR, lymphocyte-to-monocyte ratio; LNM, lymph node metastasis; MTC, medullary thyroid carcinoma; BMI, body mass index; T, tumor invasion depth; N, lymph node involvement; TNM, tumor node metastasis; BMI, body mass index.
Acknowledgment
This study was supported by grants from the National Key R&D Program of China (2017YFC0907504), the National Natural Science Foundation (81702646), the Sichuan Province Science and Technology Project of China (no. 2017SZ0139), the Sichuan University for Youth Fund
(2017SCU11016), the Health and Family Planning
Commission of Sichuan Province (17PJ296), and the Postdoctoral Sustentation Fund of Sichuan University (2017SCU12035).
Author contributions
All authors made substantial contributions to the concep-tion and design, acquisiconcep-tion of data, or analysis and inter-pretation of data; took part in drafting the article or revising it critically for important intellectual content;
gave final approval of the version to be published; and
agree to be accountable for all aspects of the work.
Disclosure
The authors report no conflicts of interest in this work.
References
1. Siegel RL, Miller KD, Jemal A. Cancer statistics, 2017.CA Cancer J
Clin.2017;67:7–30. doi:10.3322/caac.21387
2. Cabanillas ME, McFadden DG, Durante C. Thyroid cancer.Lancet.
2016;388:2783–2795. doi:10.1016/S0140-6736(16)30172-6
3. Haugen BR, EK A, KC B, et al. 2015 American Thyroid Association Management Guidelines for Adult Patients with Thyroid Nodules and Differentiated Thyroid Cancer: The American Thyroid Association Guidelines Task Force on Thyroid Nodules and Differentiated
Thyroid Cancer.Thyroid.2016;26:1–133.
4. Zenan H, Zixiong L, Zhicheng Y, et al. Clinical prognostic evaluation
of immunocytes in different molecular subtypes of breast cancer.J
Cell Physiol.2019234(11):20584–20602. doi:10.1002/jcp.28662 5. Chan JC, Chan DL, Diakos CI, et al. The lymphocyte-to-monocyte
ratio is a superior predictor of overall survival in comparison to
established biomarkers of resectable colorectal cancer. Ann Surg.
2017;265:539–546. doi:10.1097/SLA.0000000000001743
6. Ahn J, Song E, Oh H-S, et al. Low lymphocyte-to-monocyte ratios are associated with poor overall survival in anaplastic thyroid carcinoma
patients.Thyroid.2019;29:824–829. doi:10.1089/thy.2018.0684
7. Jiang K, Lei J, Li C, et al. Comparison of the prognostic values of selected
inflammation based scores in patients with medullary thyroid carcinoma:
a pilot study.J Surg Oncol.2017;116:281–287. doi:10.1002/jso.v116.3
8. van Velsen EFS, Stegenga MT, van Kemenade FJ, et al. Evaluating
the 2015 American Thyroid Association Risk Stratification System in
High Risk Papillary and Follicular Thyroid Cancer Patients.Thyroid.
2019;29:1073–1079. doi:10.1089/thy.2019.0053
9. Hay ID, Johnson TR, Thompson GB, Sebo TJ, Reinalda MS. Minimal extrathyroid extension in papillary thyroid carcinoma does
not result in increased rates of either cause-specific mortality or
postoperative tumor recurrence.Surgery.2016;159:11–19. doi:10.10
16/j.surg.2015.05.046
10. Lei J, Zhong J, Jiang K, Li Z, Gong R, Zhu J. Skip lateral lymph node metastasis leaping over the central neck compartment in
papil-lary thyroid carcinoma.Oncotarget.2017;8:27022–27033. doi:10.18
632/oncotarget.15388
11. Kitahara CM, Sosa JA. The changing incidence of thyroid cancer. Nat Rev Endocrinol.2016;12:646–653. doi:10.1038/nrendo.2016.110 12. Nishijima TF, Muss HB, Shachar SS, Tamura K, Takamatsu Y. Prognostic value of lymphocyte-to-monocyte ratio in patients with
solid tumors: a systematic review and meta-analysis.Cancer Treat
Rev.2015;41:971–978. doi:10.1016/j.ctrv.2015.10.003
13. Grivennikov SI, Greten FR, Karin M. Immunity, inflammation, and
cancer.Cell.2010;140:883–899. doi:10.1016/j.cell.2010.01.025
14. Zitvogel L, Pietrocola F, Kroemer G. Nutrition, inflammation and
cancer.Nat Immunol.2017;18:843–850. doi:10.1038/ni.3754
15. Ray-Coquard I, Cropet C, Van Glabbeke M, et al. Lymphopenia as a prognostic factor for overall survival in advanced carcinomas,
sarco-mas, and lymphomas.Cancer Res.2009;69:5383–5391. doi:10.1158/
0008-5472.CAN-08-3845
Cancer Management and Research downloaded from https://www.dovepress.com/ by 118.70.13.36 on 20-Aug-2020
16. Ceze N, Thibault G, Goujon G, et al. Pre-treatment lymphopenia as a prognostic biomarker in colorectal cancer patients receiving
che-motherapy. Cancer Chemother Pharmacol. 2011;68:1305–1313.
doi:10.1007/s00280-011-1610-3
17. Chanmee T, Ontong P, Konno K, Itano N. Tumor-associated
macro-phages as major players in the tumor microenvironment. Cancers
(Basel).2014;6:1670–1690. doi:10.3390/cancers6031670
18. Goswami KK, Ghosh T, Ghosh S, Sarkar M, Bose A, Baral R. Tumor promoting role of anti-tumor macrophages in tumor microenvironment. Cell Immunol.2017;316:1–10. doi:10.1016/j.cellimm.2017.04.005 19. Gu L, Li H, Chen L, et al. Prognostic role of lymphocyte to monocyte
ratio for patients with cancer: evidence from a systematic review and
meta-analysis. Oncotarget. 2016;7:31926–31942. doi:10.18632/
oncotarget.7876
20. Vaisman F, Momesso D, Bulzico DA, et al. Spontaneous remission in thyroid cancer patients after biochemical incomplete response to initial
therapy.Clin Endocrinol (Oxf).2012;77:132–138.
doi:10.1111/j.1365-2265.2012.04342.x
21. Pitoia F, Bueno F, Urciuoli C, Abelleira E, Cross G, Tuttle RM.
Outcomes of patients with differentiated thyroid cancer risk-stratified
according to the American thyroid association and Latin American
thyroid society risk of recurrence classification systems. Thyroid.
2013;23:1401–1407. doi:10.1089/thy.2013.0011
22. Tuttle RM, Tala H, Shah J, et al. Estimating risk of recurrence in differ-entiated thyroid cancer after total thyroidectomy and radioactive iodine remnant ablation: using response to therapy variables to modify the initial risk estimates predicted by the new American Thyroid Association
sta-ging system.Thyroid.2010;20:1341–1349. doi:10.1089/thy.2010.0178
23. Li J, Zhou J, Yang P-H, et al. Nomograms for survival prediction in patients undergoing liver resection for hepatitis B virus related early
stage hepatocellular carcinoma. Eur J Cancer. 2016;62:86–95.
doi:10.1016/j.ejca.2016.04.011
24. Conzo G, Docimo G, Mauriello C, et al. The current status of lymph node dissection in the treatment of papillary thyroid cancer. A literature
review.Clin Ter.2013;164:e343–e346. doi:10.7417/CT.2013.1599
25. Conzo G, Calò PG, Gambardella C, et al. Controversies in the surgical management of thyroid follicular neoplasms. Retrospective
analysis of 721 patients. Int J Surg. 2014;12 Suppl 1:S29–S34.
doi:10.1016/j.ijsu.2014.05.013
26. Peng D, Lu J, Hu H, Li B, Ye X, Cheng N. Lymphocyte to monocyte ratio predicts resectability and early recurrence of Bismuth-Corlette
type IV Hilar Cholangiocarcinoma. J Gastrointest Surg. 2019.
doi:10.1007/s11605-018-04086-9
27. Jin F, Han A, Shi F, Kong L, Yu J. The postoperative neutrophil-to-lymphocyte ratio and changes in this ratio predict survival after the
complete resection of stage I non-small cell lung cancer. Onco
Targets Ther.2016;9:6529–6537. doi:10.2147/OTT.S117290
Cancer Management and Research
Dove
press
Publish your work in this journal
Cancer Management and Research is an international, peer-reviewed open access journal focusing on cancer research and the optimal use of preventative and integrated treatment interventions to achieve improved outcomes, enhanced survival and quality of life for the cancer patient.
The manuscript management system is completely online and includes a very quick and fair peer-review system, which is all easy to use. Visit http://www.dovepress.com/testimonials.php to read real quotes from published authors.
Submit your manuscript here:https://www.dovepress.com/cancer-management-and-research-journal
Cancer Management and Research downloaded from https://www.dovepress.com/ by 118.70.13.36 on 20-Aug-2020