Harikumar Rajaguru, Sunil Kumar Prabhakar*
Department of ECE Bannari Amman Institute of Technology Sathyamangalam, India. *Corresponding author’s E-mail: [email protected]
Accepted on: 10-11-2016; Finalized on: 30-11-2016.
ABSTRACT
Nearly 1% of entire human population suffers from epilepsy and around 80-90% is prevalent in the developing economies only. Due to the abnormalities in the electrical activity of the brain, epilepsy occurs and it results in sudden body movement and sensation accompanied by abnormal perception and behaviour. In the cerebral cortical regions of the brain, the firing of neurons is in a hyper synchronous state and is visualized as epileptic seizures. The three important characteristic features of seizures are that it is highly recurrent in nature, random and brief. The exact diagnosis of epilepsy is a tough task to perform because the symptom of epilepsy and the symptoms of other brain disorders are more or less similar and overlapping. Also, there is no clear knowledge about the progression of seizure. For treating the epileptic patient, diagnosis has to be done and for that it is essential to recognize the affected area in the brain. With the advent of Electroencephalogram (EEG), it serves as a great boon for the analysis of the dynamic and complex behaviors of the brain and it is helpful to learn about the various physiological states of the brain. For recognizing and diagnosing epilepsy, EEG has become a versatile tool. The clinical EEG data obtained is highly complex, difficult to interpret and multi-dimensional in nature. The extraction and interpretation of the useful information from the raw data is a very challenging task. The amount of data generated by EEG is massive and only with an expert it can be interpreted. In this paper, dimensions of the EEG data are reduced with the help of Linear Discriminant Analysis (LDA) and Isomap. The dimensionally reduced values are then classified with the aid of automated seizure prediction models in the form of post classifiers like Singular Value Decomposition (SVD), Cascaded Forward Back Propagation Network (CFBPN), Multi Layer Perceptron (MLP) and Radial Basis Function (RBF). The result analysis shows that when both the dimensionality reduction techniques are classified with RBF, a perfect classification and accuracy of 100% is obtained.
Keywords:EEG, Epilepsy, LDA, Isomap, CFBPN, MLP, RBF.
INTRODUCTION
ne of the most common neurological disorders occurring in the brain is epilepsy and it troubles more than 40 million people worldwide1. The standard hallmark symptom of epilepsy is seizure and it has a wide range of both social and medical effects. Many patients do not respond to the intervention of the pharmacological methods and so to treat majority of patients, antiepileptic drugs cannot help. So to understand this dynamic disease, various new methodologies and possibilities for treatment are rising. Developing suitable devices that can incorporate versatile algorithms for early detection of onset of seizures is the need of the hour. With the help of such techniques, the severe physical manifestations starts in the patient, the seizure of the patient’s can be easily detected and prevented. When the neuronal networks in the cortical regions of the brain synchronize excessively, this same problem occurs2. So the epileptic patients experience a lot of abnormal bursts in the electrical activity discharges of the brain. A lot of temporary changes in behaviour and perception are observed in a lot of patients who suffer from epileptic seizures. Due to the various structural malformations in the cerebral cortex, various kinds of brain injuries, genetic and physiological defects, the epilepsy occurs.
With the help of EEG, epileptic seizures can be analyzed in the human brain. Thus EEG serves as an important means to identify the seizure activity in brain of human. A great amount of information about the activities and function of the brain can be analyzed through EEG. To analyze the complex electrical fields of the activity of brain, EEG helps the clinician greatly. The electrodes are placed directly on the scalp and the cortical regions are analyzed in the brain. The EEG specialist tries to determine and understand the location and nature of the various EEG patterns, like corresponds to normal and abnormal neural activity from all the types of recordings. The EEG signal of epileptic patients display patterns which is very different when compared to the patterns of the normal state of brain. The varieties are shown with respect to time, frequency and space. When the electrodes are placed on the scalp, the potential differences between electrodes are detected by EEG. Depending on the synchronization of the involvement of neuronal activity, the patterns are displayed. With the aid of skilled visual encephalography professionals, the epileptic EEG signal can be identified in majority of the cases but it is quite time consuming and it is hard to find such experts and therefore automated seizure detection algorithms are important and its rise came into existence3. Some of the most important recent literature is discussed as follows: The automatic detection of seizure onset in pediatric EEG was done by Khan et al4. An algorithm for
Efficient Automatic Seizure Detection Algorithms to Classify Epilepsy from EEG Signals Using
Certain Post Classifiers
O
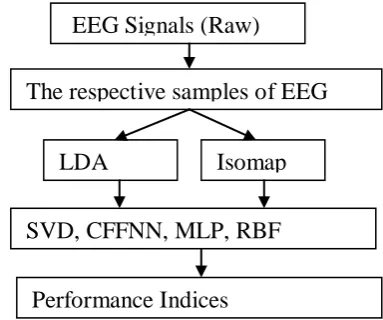
seizure onset detection using intracranial EEG was performed by Kharbouch et al5. The comparison of Short Time Fourier Transform and wavelet transform methods in determining epileptic seizure activity in EEG signals for real-time applications was found by Kiymik et al6. The network mechanism of the spread of paroxysms, typical versus atypical absence seizures was performed by Perez Velazquez et al7. A system to detect the onset of epileptic seizures in scalp EEG was developed by Saab and Gotman8. The application of machine learning to epileptic seizure detection was performed by Shoeb and Gutterg9. With the help of matching pursuit, automatic epileptic seizure onset detection was done by Sorensen et al10. The continuous analysis of EEG’s alpha wave by morlet wavelet transform was done by Wang et al11. Fuzzy support vector machine for classification of EEG signals using wavelet-based features was performed by Qi Xu et al12. The best basis-based wavelet packet entropy feature extraction and hierarchial EEG classification for epileptic detection was done by Deng Wong et al13. In this work, as the recordings of the EEG are quite long, the dimensions of it are initially reduced by using LDA and Isomap and later classified with SVD, CFFNN, MLP and RBF. The block diagram of the paper is given in Figure 1. The paper is organized as follows: The methods and materials are given in section 2 followed by the application of dimensionality reduction techniques in section 3. Section 4 gives the classification details of the employed post classifiers and section 5 gives the results and discussion followed by conclusion in section 6.
Figure 1: Overall Block Diagram of the Work
MATERIALSANDMETHODS
Acquiring the EEG Data
The system employed to place the electrodes on the scalp of the brain to record EEG is the standard International 10-20 system. The EEG is recorded continuously for totally 16 channels. The reference of one electrode is done with respect to its adjacent electrode. For periods like resting, deep sleep, fast and slow movements, eyes open, semi closed, fully closed, the recording are done. Siemens Minograph Universal, a versatile EEG machine is used for
the amplification purpose. Before the help of electrode paste, the electrodes are washed well and then placed on the scalp. The contact impedance is of the range less than 10
k
. 30 mm/s is the recording speed of EEG signals. Umax 6696 scanner is used for scanning purposes here. For totally 20 patients, with the help of experience neurologists, the readings had been obtained at Sri Ramakrishna Hospital, Coimbatore, India in European Data Format. For 30 minutes duration, the EEG recordings are done continuously and then it is divided into equal epochs which have 2 second duration. Later it is scanned to a small bitmap image size which contains nearly 400 x 100 pixels. To trace the vital changes in the signal, the 2 second epoch is pretty good.Mitigating the Dimensions of the EEG Data
As 50 Hz is the maximum frequency of EEG, to obtain its samples, based on the Nyquist criterion the sampling frequency obtained is about 200 Hz. The amplitude values of the signal which are highly instantaneous in nature represent the sample values and ultimately for a single epoch there are totally 400 values. As there are totally 16 channels and each channel comprises of 3 epochs, the total number of samples to be processed is around 25,500 samples and this number is too massive for computation. The dimensionally reduced values are more sufficient to deliver the exact calculation in mean and variance. For the quantification of EEG, the different parameters are computed by utilizing the amplitude values with the help of appropriate programming codes. For both the training and testing purposes, EEG recordings of twenty patients are used.
LDA AND ISOMAP AS DIMENSIONALITY REDUCTION
TECHNIQUES
The two important dimensionality reduction techniques utilized here are LDA and Isomap.
LDA
It is very common to implement a feature extraction technique as a basic pre-processing step while solving pattern classification problems. It not only reduces the computational complexity performance but also enhances the classification performance to a great extent. A particular class of feature extraction procedures is defined by a particular transformation
)
(
X
T
Y
, whereX
R
DandY
R
d.By optimizing the necessary objectives, the transformation
T
is obtained. Thus, there are two important parts to a feature extraction, firstly, the suitable objectives must be formulated well and secondly, the respective optimal solution of the transformation should be determined. One of the most famous linear dimensionality reduction algorithms is LDA14. Suppose aD
-dimensional data setX
is considered as follows{
X
x
1,
x
2,....,x
n}
, withEEG Signals (Raw)
The respective samples of EEG
Signals
LDA
Isomap
SVD, CFFNN, MLP, RBF
totally
C
classes, the actual Fisher criteria implemented in LDA is given as followsT w
T B
wS
wS
J
Where
S
wdenotes the average within class scatter matrix andS
Bindicates the in between-class covariance matrix ofX
.An Eigen value decomposition of
S
w1S
B is performed nowand then the rows of
is made equal to totally'
d
'
Eigen vectors which represents or belongs to thed
(
d
C
1
)
largest eigen values. Then a condition
)
(
d
D
D
by
d
transformation matrix
is examined so that the Fisher criterion is satisfied. The exact setX
is mapped fromD
dimensional space which is original to the newly foundd
dimensional space with the help of functionY
X
. The newly formed space maintains all the discriminative information and content contained inX
so that good classification rate can be obtained.Isomap
It is a recently developed approach in the field of non linear dimensionality reduction and is based primarily on Multi Dimensionality Scheme (MDS)15. It is a type where non linear generalization is done to classical MDS. The main plan is to implement MDS in the geodesic space of the given non linear data manifold. Isomap is generally not applied in the input space. The shortest path in the curved surfaces of the non linear data manifold is measured by the geodesic distances. If short steps are initiated in between the adjacent sample points, then it can be easily approximated. Isomap then implement the MDS to the geodesic spaces rather than the distances which are in the form of straight line in order to trace a very low-dimensional mapping scheme. The Isomap has three steps; Firstly, in the high dimensional data space, the adjacent neighbors of each and every data point are found out. In between all the points, the geodesic pair wise distances are computed. Finally to preserve the distances, use MDS to embed the data. Similar the Local Linear Embedding (LLE), it can be proceeded as follows: The K nearest neighbour are identified by choosing all the points within a particular fixed radius
. In a graphG
, the representation of those neighborhood relations are done, so that each data point is connected to its adjacent and nearest neighbor with edges of weightd
x(
i
,
j
)
in between the neighbor. Between all the pairs of points of data manifoldM
, the geodesic distancesd
M(
i
,
j
)
is estimated. In the graphG
, the Isomap approximates thed
M(
i
,
j
)
as the shortest path distanced
G(
i
,
j
)
. The shortest path iscomputed using Dijkstra’s algorithm or Floyd’s algorithm. The matrix of graph distances
D
(G)is found out which tells the shortest path distance in between the pairs of points in the manifold. Finally classical MDS is applied toD
(G)so that embedding of data is generated in ad
dimensional Euclidean spaceY
. By managing the coordinates ofy
ito the top'
d
'
Eigen vectors, theg
minof the cost function is obtained.I CLASSIFYING EPILEPSY FROM EEG SIGNALS
The dimensionally reduced values are then fed inside the post classifiers to classify the epilepsy from EEG signals. The post classifiers used here are SVD, CFFNN, RBF and MLP.
SVD
The generalization of the eigen-decomposition yields the SVD and is primarily used to analyze rectangular matrices. In eigen decomposition, a matrix is decomposed into 2 simple matrices, whereas in SVD, a rectangular matrix is decomposed into three simple matrices, namely, a diagonal matrix and 2 orthogonal matrices. The SVD is more or less equivalent to PCA and metric MDS because a least square matrix for a particular matrix is obtained by a lower rank matrix which has similar dimensions. Therefore SVD serves as an important tool for multivariate analysis16. If
A
is a positive semi-definite matrix, the Eigen decomposition of it is expressed asT
U
U
A
Where the ortho normal matrix is represented as
U
(i.e.)I
U
U
T
,
represents the diagonal matrix which contains the eigen values ofA
. To obtain a similar decomposition this is implemented to all the rectangular matrices comprising of real numbers, the SVD employs the eigen-decomposition of a positive semi-definite matrix. The idea is to simply decompose any matrix into 3 simple matrices into one diagonal matrix and second orthonormal matrices, the SVD becomes equivalent to the Eigen decomposition if it is applied to a positive semi-definite matrix.If
B
is a rectangular matrix, the SVD of it is decomposed as followsT
F
E
B
Where
E
represents the normalized Eigen vector of the matrixBB
T(i.e)E
TE
I
. The left singular vectors ofB
represent the columns ofE
.Q
represents thenormalized eigen vector of the matrix
B
TB
(i.e)I
F
F
T
. The right singular vectors ofB
represent the columns ofF
.
represents the diagonal matrixrepresents the diagonal matrix of the Eigen values of both the matrices
BB
TandB
TB
. For a positive semi-definite matrix, if eigen-decomposition is performed, then SVD is obtained.Cascaded Forward Back Propagation Network
A fundamental mathematical model of the human brain is Artificial Neural Network (ANN). A lot of interconnection in between the neurons is required to get a good performance in the real time neural network scenario. Through learning process, the Neural Networks can get the knowledge of the surrounding environment, so that the attainment of the desired design objective is done by changing the synaptic weights of the network analytically. Generally an ANN comprises of 3 and more neuron layers, one input layer, one hidden layer and one or more output layers. For restricting the building time of the model, only a single hidden layer is used in some cases. Various types of architecture are used in ANN. The architecture in Figure 2 explains the number of layers. The architecture explains the number of layers a network should have, the total number of neurons in each layer, the connection in between the layers and the transfer function of the layer. In this case, there are 2 main architecture involved namely, Feed forward back propagation and cascade forward back propagation17. The figure is shown here as one input layer of 3 neurons, one hidden layer of 2 neurons and one output layer. In feed forward back propagation, there is one input layer, one or more hidden layers and one output layer. The hidden layer consists of sigmoid neurons and it is followed by the output layer which consists of linear neurons. Cascaded Forward Back Propagation Network is similar to Feed Forward Back Propagation Network which utilizes Back Propagation Algorithm for the weight updation process. In this architecture the neurons in each layer relates itself to the neurons in the previous layer. The architecture of the cascade neural networks is dynamic in nature. In the context of cascade networks, only with the help of one neuron, learning is started and during the training phase, the learning algorithm adds new neurons automatically thereby creating a multilayer architecture. If the training error decreases, it implies that the total number of hidden layer neurons increases in a step by step fashion. The growth of the network is determined by the learning algorithm. For the updation of the weights in the network, two training algorithms such as Levenberg-Marquardt and Bayesian regulation back propagation algorithms are used. If the connectivity is controlled inside the network, then it can lead to a very fast learning rate.
Multi Layer Perceptron (MLP)
It is capable of learning nonlinear decision surface. This type of feed-forward network is normally directed and acyclic18. This type of feed-forward network is normally directed and acyclic as shown in Figure 3.
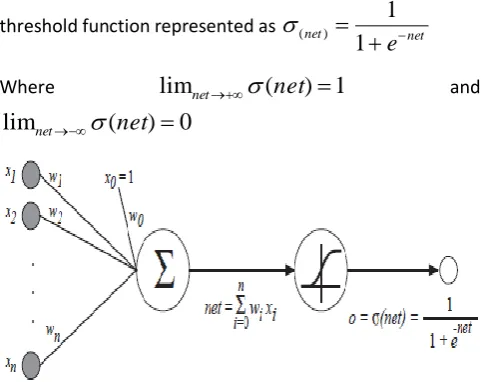
Figure 2: Architecture of CFBPN
It is based on a sigmoid unit and resembles much like a perceptron but based on a smoothed, differentiate
threshold function represented as net net
e
1
1
)(
Where
lim
net
(
net
)
1
and0
)
(
lim
net
net
Figure 3: Multi Layer Perceptron (MLP)
To update the weights, Back propagation algorithm is used. The weights are learnt thoroughly for a feed-forward multilayer network with a particular set of fixed neurons of interconnection. To minimize the error, gradient descent is employed. The back propagation (training_examples,
)
,
,
,
in
outn
hidden
is carried out as follows. The input from uniti
to unitj
is represented asx
jiand the weightfrom unit
i
to unitj
is represented asw
ji. Afeed-forward network with
in inputs,n
hiddenunits andn
outoutput units is created initially. The network weights are all initialized to very small random numbers. Till the achievement of the termination condition, the following steps are repeated.
For all
x
,
t
in training samples,a) The propagation of the input in the forward direction
1) The input
x
is given to the network and then computeo
ufor every unitu
.b)The errors are propagated back through the
network
2) For each network output unit
k
, its respective error term
kis calculated as follows)
)(
1
(
k k kk
k
o
o
t
o
3) For each hidden unit
h
, its error term
his calculated as followsk h k outputs k h h
h
o
o
w
(
1
)
4) Each weight
w
jiis updated as followsji ji
ji
w
w
w
Where
w
ji
jx
jiThe termination conditions are set as with fixed no of iterations, the error value falls below some threshold values. A function is said to be radial basis if the output is dependent on the distance of the input from a particular stored vector and it is shown in Figure 4.
Radial Basis Function (RBF)
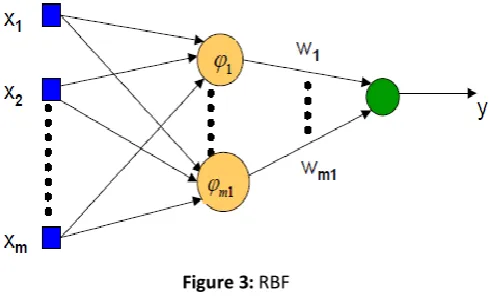
A function is said to be radial basis if the output is dependent on the distance of the input from a particular stored vector. They generally represent local receptors, where each and every point is a stored vector applied in a single RBF18. In the context of a RBF network, one hidden layer implements neurons with RBF activation functions and as a result it explains the local receptors in detail. Also an output node used here is implemented to combine all the output of the hidden neurons in a linear fashion.
Figure 3: RBF
One hidden layer with RBF activation functions is represented as
1,....,
m1. The output layer with linear activation function is produced as follows)
(
...
)
(
1 1 1 11
1
x
t
w
m mx
t
mw
y
where
x
t
represents the distance ofx
(
x
1,...,
x
m)
from a vector
t
. Here the hidden units use the radial basis function
x
t
, wheret
represents the centre and
represents the spread. Here the centre and spread are the parameters. The output is mainly dependent on the distance of the inputx
from the centre pointt
. Only near its centre, the hidden neurons will be more sensitive to data points. In the case of Gaussian RBF, if the spread
is adjusted, then the sensitivity can be tuned easily. If the spread is large, then it implies less sensitivity.RESULTSANDDISCUSSION
When LDA and Isomap are effectively utilized as dimensionality reduction techniques and classified with post classifiers like SVD, CFBPN, MLP and RBF, based on the parameters like Performance Indices, Accuracy, Specificity, Sensitivity, Quality values and Time Delay the average results are computed in Tables 1 and 2 respectively. The mathematical formulae for the terms like Performance Index (PI), Sensitivity, Specificity and Accuracy are given as follows
100
PC
FA
MC
PC
PI
The Perfect Classification is indicated by PC, the Missed Classification is indicated by MC and the False Alarm is indicated as FA. The Sensitivity, Specificity and Accuracy measures are mentioned by the following formulae:
100
FA
PC
PC
y
Sensitivit
100
MC
PC
PC
y
Specificit
100
2
Sensitivit
y
Specificit
y
Accuracy
The Quality Value QV is defined in a significant manner as
)
*
6
*
(
*
)
2
.
0
(
fa dly dct msdv
P
P
T
R
C
Q
Here the scaling constant is mentioned as C,
The number of false alarm per set is mentioned by Rfa, The average delay of the onset classification (seconds) is indicated by Tdly,. The percentage of perfect classification is mentioned by Pdct. The percentage of perfect risk level missed is identified by Pmsd,. The time delay is mathematically expressed as follows
100
6
100
2
PC
MC
If the Table 1 is considered for analysis, if LDA is utilized as a dimensionality reduction technique and classified with SVD, an average accuracy of 91.77 % is obtained with a perfect classification rate of 83.54%.
Table 1: Average Results Analysis for LDA
PARAMETERS LDA +
SVD
LDA + CFBNN
LDA + MLP
LDA + RBF
PC (%) 83.54 94.30 88.05 100
MC (%) 2.01 1.73 0 0
FA (%) 14.44 3.95 11.95 0
PI (%) 78.81 93.72 86.42 100 Sensitivity (%) 85.55 96.04 88.05 100 Specificity (%) 97.98 98.26 100 100 Time Delay (sec) 1.79 1.99 1.76 2
Quality Values 17.57 21.65 17.77 25 Accuracy (%) 91.77 97.15 94.03 100
If LDA-CFBNN combination is used, an average accuracy of 97.15% along with a perfect classification rate of about 94.30% is obtained, for LDA-MLP combination a perfect classification rate of about 88.05% and LDA-RBF combination, an accuracy of 100% is obtained.
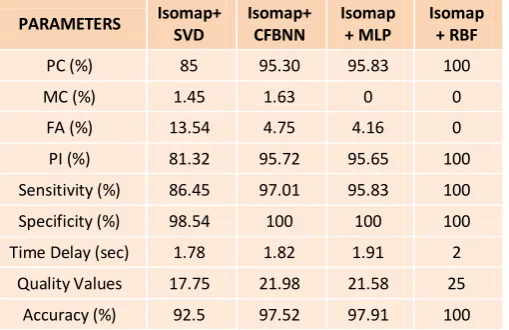
Table 2: Average Results Analysis for Isomap Analysis
PARAMETERS Isomap+ SVD
Isomap+ CFBNN
Isomap + MLP
Isomap + RBF
PC (%) 85 95.30 95.83 100
MC (%) 1.45 1.63 0 0
FA (%) 13.54 4.75 4.16 0
PI (%) 81.32 95.72 95.65 100
Sensitivity (%) 86.45 97.01 95.83 100 Specificity (%) 98.54 100 100 100 Time Delay (sec) 1.78 1.82 1.91 2
Quality Values 17.75 21.98 21.58 25 Accuracy (%) 92.5 97.52 97.91 100
If the Table 2 is considered for analysis, if Isomap is utilized as a dimensionality reduction technique and classified with SVD, an average accuracy of 92.5 % is obtained. If Isomap-CFBNN combination is used, an average accuracy of 97.52% is obtained, for Isomap-MLP combination, an average accuracy of 97.91% is obtained and Isomap-RBF combination, an accuracy of 100% is obtained.
CONCLUSION
Thus with the help of EEG signals, the electrical activity of the brain is easily indicated. The most important information about the state of the brain is given by the EEG. For the extraction of features, to reduce the dimensions of the EEG data and for the application of various advanced signal processing techniques to it, EEG is of great utility. Thus in this paper, two dimensionality
reduction techniques such as Isomap and LDA was utilized efficiently and then classified with four classifiers such as SVD, CFBNN, MLP and RBF. The result analysis shows that the best perfect classification rate is obtained when both the dimensionality reduction techniques are classified with the RBF Classifier with an average performance Index of 100 % and an average accuracy of 100%, with a very less time delay and a good quality value. Apart from the RBF classifier, the next best technique is the combination of Isomap-MLP which gives an average performance index of 95.65% along with an average accuracy of 97.91%. Future works may incorporate the usage of different modifications in the post classification techniques.
REFERENCES
1. Prabhakar S K, Rajaguru H, ICA, LGE and FMI as Dimensionality Reduction Techniques followed by GMM as Post Classifier for the Classification of Epilepsy Risk Levels from EEG Signals, 9th IEEE European Modelling Symposium , 2015, pp: 61-65.
2. Prabhakar S K, Rajaguru H, GMM Better than SRC for Classifying Epilepsy Risk Levels from EEG Signals, Proceedings of the International Conference on Intelligent Informatics and BioMedical Sciences (ICIIBMS), 2015, pp. 347-350.
3. Prabhakar S K, Rajaguru H, Utilizing Genetic Algorithms with Dimensionality Reduction Techniques for Epilepsy Classification from EEG Signals, International Journal of Pharmacy and Technology, Vol.8, Issue.1, March 2016, pg:11334-11346.
4. Khan Y U, Farooq O, and Sharma P, Automatic detection of seizure onset in pediatric EEG, International Joural of Embeded Systems and Applications, vol. 2, no. 3, 2012, pp. 8189.
5. Kharbouch A, Shoeb A, Guttag J, and Cash S S, An algorithm for seizure onset detection using intracranial EEG, Epilepsy Behav, vol. 22, 2011, pp. 29-35.
6. Kiymik M K, Guler I, Dizibuyuk A, and Akin M, Comparison of STFT and wavelet transform methods in determining epileptic seizure activity in EEG signals for real-time application, Computers in Biology and Medicine, vol. 35, no. 7, 2005, pp. 603-616.
7. Perez V J L, Huo J Z, Garcia D, Leshchenko Y, Carter O S , Typical versus Atypical Absence Seizures: Network Mechanisms of the Spread of Paroxysms, Epilepsia, 48(8), 2007.
8. Saab M E, and Gotman J, A system to detect the onset of epileptic seizures in scalp EEG, Clinical Neurophysiology, vol. 16, no. 2, 2005, pp. 427-442.
9. Shoeb A, Edwards H, Connolly J, Bourgeois B, Ted S, and Guttag J, Patient-specific seizure onset detection, Epilepsy and Behavior, 5(4): 2004, pp: 483-498.
(EMBC), 2010 Annual International Conference of the IEEE, 2010, pp. 3277-3280.
11. Wang H, Chen Z, Zou S, Zhao L, The continuous analysis of EEG's alpha wave by morlet wavelet transform, Aug;27(4), 2010, 746-752.
12. Qi X, Hui Z, Yongji W, Jian H, Fuzzy support vector machine for classification of EEG signals using wavelet-based features, Medical Engineering & Physics, 31,2009, 858–865. 13. Deng W, Duoqian M, Chen X, Best basis-based wavelet
packet entropy feature extraction and hierarchical EEG classification for epileptic detection, Expert Systems with Applications, 38, 2011, 14314–14320.
14. Rajaguru H, Prabhakar S K, LDA, GA and SVM’s for Classification of Epilepsy From EEG Signals, Research Journal of Pharmaceutical, Biological and Chemical Sciences, Vol.7(3), 2016, pp:2044-2049.
15. Harikumar R, Kumar P S, ‘Dimensionality Reduction Techniques for Processing Epileptic Encephalographic Signals’, Biomedical and Pharmacology Journal, Vol.8, No.1, 2015, pg no:103-106.
16. Sadasivam P K, Narayana D, “SVD Based Technique for noise reduction in Electroencephalographic signals”, Elsevier Signal Processing, Vol 55, 1996, pp 179-189,
17. Sumit et al, Cascade and Feedforward BPN Neural Network models for prediction of sensory quality of instant coffee flavoured sterilized drink, Canadian Journal on Artificial Intelligence, Machine Learning and Pattern Recognition, Vol.2, No:6, 2011.
18. Harikumar R, Sukanesh R, Analysis of Fuzzy Techniques and Neural Networks (RBF&MLP) in Classification of Epilepsy Risk Levels from EEG Signals IETE Journal of Research 2007 vol.53, no 5, Sep-Oct 2007 pp 465-474.