ECE Diagnostic for the initial Operation of Wendelstein 7-X
Matthias Hirsch1, Udo Höfel1, Johan Willem Oosterbeek1, Neha Chaudhary1, Joachim Geiger1,
Hans-Jürgen Hartfuss1, Walter Kasparek3, Nikolai Marushchenko1, Boudewijn van Milligen2, Burkhard Plaum3, Torsten Stange1, Jakob Svensson1, Hayato Tsuchiya4, Dietmar Wagner1, Gavin McWeir1, Robert Wolf1 and the W7-X Team
1 Max-Planck-Institut für Plasmaphysik, Greifswald/Garching, Germany
2 Laboratorio Nacional de Fusion, CIEMAT, Avda. Complutense 40, 28040 Madrid, Spain 3Inst. für Grenzflächenverfahrenstechnik und Plasmatechnologie, Univ. Stuttgart, Germany 4 National Institute for Fusion Science, Toki, Japan
Abstract. The ECE diagnostic at W7-X in its standard mode of operation measures in X2 mode polarization with a 32 channel radiometer in the frequency band around 140 GHz for central magnetic field 2.5T. The radiometer is calibrated by a noise source and the overall system absolutely calibrated by means of a hot-cold source placed outside the torus in front of a Gaussian telescope optics with identical geometry and transmission line as it is installed for the measurements in the plasma vessel. The system is supplemented with a 16 channel zoom device with 4 GHz span for higher frequency resolution at a suitable radial range and a Michelson interferometer for the characterization of higher harmonics sharing the same line of sight.
1 Introduction
Wendelstein 7-X is a second generation Stellarator with optimized physics properties of its three-dimensional confining magnetic field along the HELIAS concept [1]. Aim of the first operational phase, OP1, split into essentially three campaigns, is to prove the success of this optimization and develop an Electron Cyclotron Resonance heated (ECRH) high-density scenario with island divertor edge and a high-beta core as a basis for steady-state operation. Instead of the later high heatflux divertor and fully cooled in-vessel components, a geometrically identical but inertially cooled test-divertor unit is used. Long-pulse high-density operation relies on the flexible ECRH system [2] with total power ~ 7 MW provided to the plasma by 10 cw-gyrotron units and optical transmission lines and by microwave absorption using mutipass O2 mode launch [3] instead of X2 launch as used at lower density.
During the first test operation, OP1.1, dedicated to integrated commissioning, tests of components and diagnostics, the device was equipped with five uncooled inboard carbon limiters only, which restricted the magnetic configuration and the overall energy input for a single experiment scenario to avoid uncontrolled overheating [4], [5]. Test-divertor operation started September to December 2017 (OP1.2a) and has been completed July to Oct. 2018 (OP1.2b). Due to still uncooled first wall and divertor elements the overall energy input during an experiment scenario was restricted to < 200 MJ, resulting in detached high performance plasmas with a pulse duration of 32s @ 5MW O2-heating and feedback controlled density
~ 0.9 1020 m-3 not limited by plasma performance. The
first operation of the NBI system with PNBI= 3.4 MW
(Hydrogen injection 55 keV) and maximum technically available duration of a few seconds was performed to explore direct ion-heating, deep fueling (resulting in peaked density profiles with n(0)= 2.0 1020 m-3 and fast
ion confinement and for the commissioning of beam-related diagnostics as well. Long-pulse operation is scheduled early 2021 (OP2) after the high-heatflux divertor and fully cooled in-vessel components have been installed.
The Electron Cyclotron Emission Diagnostic (ECE) has been operated throughout these experiments with the task to monitor ECR heating and measure electron heat transport [6],[7]. This contribution summarizes the technical status and characterization of the ECE diagnostic as a basis for an overview on typical results and the status of their evaluation.
2 ECE diagnostic for W7-X
2.1. Sightline
Due to the large aspect ratio of W7-X the cyclotron harmonics are well separated and the cold resonances up to the 4th harmonic do not overlap. The full 2nd harmonic
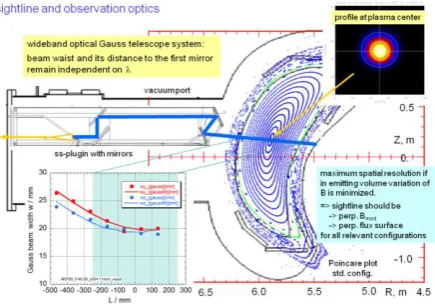
localized temperature measurements the toroidal location is selected such that the local magnetic field strength increases Tokomak-like with the distance from the observation optics towards the inner side of the torus. Simultaneously the magnetic field on the axis is different from the 2.52 T at the ECRH launching ports to avoid that access to the plasma center is hampered by 140 GHz stray-radiation of unabsorbed ECRH beams [10]. This radiation is particularly strong in cases of O2-heating where single pass absorption is 70% only. To alleviate this the toroidal location of the ECE is chosen nearly opposite to the ECRH launching plane. Notch filters have been developed as described below for the radiometer and the Michelson interferometer. However, temporary perturbations occur in individual ECE channels due to spurious sidebands in particular gyrotron modes of operation. They easily can be identified and need to be suppressed for data evaluation. At the selected slightly elongated local plasma cross section the flux surfaces are compressed by about a factor of two with respect to an equivalent circular cross section where the average minor radius is a~50cm (Fig.1). For a maximum spatial resolution of ECE, the variation of B in the probed emitting volume needs to be minimized. This is achieved by a small emitting volume defined by a narrow Gaussian beam characteristic focused moderately at the plasma center. The 1/e width of its power distribution is w0 < 23 mm all along the pathlength of about 55 cm where the sightline crosses the confinement region. The temperature variation within a probed volume defined by Gauss beam and bandwidth of a given radiometer channel is minimized by a sightline widely perpendicular to the crossed flux-surfaces and thus to the fieldlines. The criterion coincides with the requirement that magnetic field components along the sightline should be minimized to reduce broadening by Doppler shift. Furthermore a sightline that is widely perpendicular to the flux surfaces and thus to the density gradient reduces beam refraction during high-density operation. Due to helical excursions of the plasma axis - and thus in contrast to a tokamak - the required condition is not straightforward achieved in a stellarator. For the selected diagnostic position it results in a tilt of 6 deg and -10deg of the sightline axis to the vertical and horizontal plane respectively [9].
Fig. 1:Cut through the W7-X plasma and -vessel at the poloidal plane of the ECE sightline and the Gaussian telescope optics plugin in the diagnostic port.
The selected ECE sightline is realized by intrinsically broadband Gaussian beam telescope optics (Fig. 1), consisting of 2 elliptical and 2 plain stainless steel mirrors - the latter for beam folding and -steering - and an adapted broadband horn antenna altogether assembled in a common stainless-steel frame attached to one of the major port flanges. For later long-pulse operation the optics is already prepared to be water cooled by a meander structure integrated in the front mirrors and cooling pipes along the support frame.
Due to the low magnetic shear of W7-X, the pitch angle of the magnetic field varies only moderately along this ECE sightline - e.g. by 6 deg for W7-X standard magnetic field configuration resulting in rather well defined conditions for ordinary O- and extraordinary X-mode polarization. At the plasma axis the magnetic field is tilted by 13 deg with respect to the horizontal direction. During the first campaign X-mode polarization was selected already in the vessel by a microwave horn with rectangular fundamental mode exit. For OP1.2 a conical 70mm long extremely wideband horn has been developed by means of an optimizer [11]. The free space Gauss mode TEM10 is converted to a TE11 at its circular 4 mm diameter exit which allows for both X- and O-mode measurements selecting the desired polarization outside the torus. A 4 mm diameter circular Cu waveguide then leads the radiation to the broadband vacuum window consisting of 100 µm thick Viton-sealed mica sheet in a 4 mm circular aperture. The calculated mode purity of the horn exceeds 97% for frequencies 140 to 500 GHz and remains > 93% down to 50GHz thus reducing cross polarization coupling. For high frequencies (> 250 GHz) the calculated horn characteristics approach those of a truncated waveguide. In the horn the nominal beam waist has been selected to increase with ~ sqrt() which guarantees frequency independent wavefront curvature and thus broadband capabilitiy of the telescope arrangement. The nominal beam waist location in the horn varies only moderately keeping the location of the beam waist on the other side reasonably well at the plasma center. So far calculated and measured waists and waist locations have been compared for frequencies 5GHz < f < 200 GHz and agree well.
2.2 Transmission line and notch filter
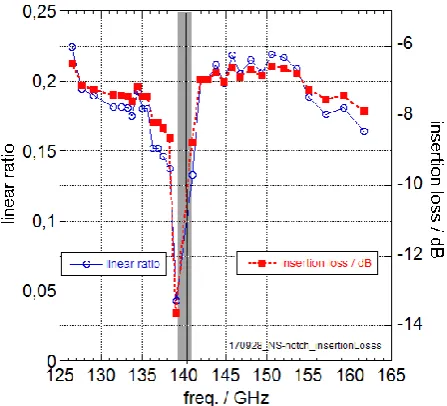
d= 28mm to d= 4mm tapers on both sides of the transmission line. In the transmission line the TE11 mode has moderate losses, and is rather insensitive to perpendicular alignment inaccuracies (e.g. radial displacements) at the connection between subsequent Cu-tubes. However, care has to be taken to avoid any tilts in the waveguide (at flanges, inaccurate mitre bends etc.), which lead to the excitation of spurious unwanted modes. The total length is 23.7m including the two tapers. To minimize crosstalk X- and O-mode are split already right outside the torus by a wire grid in the oversized waveguide and the corresponding O-mode transmission line runs in parallel to the X-mode one. The overall attenuation of this transmission line in the spectral range of the radiometer 124 to 162 GHz measured with a noise source (Fig. 3) increases from 8 to 10 dB mainly resulting from losses at the mitre bends which essentially act like gaps in the oversized waveguides with a distance of transmission line diameter. In contrast cross polarization coupling is as low as ~1% only.
Fig. 2: Insertion loss of the transmission line determined by differential measurement with a noise source and the radiometer cannels used for detection.
Fig.
3 shows an overview of the transmission line
system. Besides the calibration optics discussed in 2.4 below it shows a second plasma observation from the opposite "high field side". It views along the same line of sight but reversely and has been prepared to allow for studies of optically grey emission expected there which gives access to the electron distribution function [8]. This high-field side observation may be selected by a switch in the oversized transmission line. The antenna consists of a 10 mm aperture stainless steel horn integrated in a tile of a water-cooled baffle-like heatshield selecting X-mode radiation. The horn aperture is slightly retracted into the surface of the plasma facing graphite tile which itself prolongs the flare angle of the horn. Optics or larger horn dimensions are impossible to realize due to geometrical restrictions and the expected convective heatloads of < 300 kW/m2. Calculatedmaximum temperatures reach 450 oC near the horn itself
which is just acceptable for the CuCrZr heat-sink. Fundamental mode and slightly oversized rectangular
waveguides hidden behind the heat shield lead the signals to the next port and the respective 4 mm diameter mica vacuum window at its end.
Fig. 3:Scheme of the overall transmission line system. The additional transmission line for O-mode radiation running in parallel from the low field side observation port to the radiometer has been omitted for clarity.
The frequency band of ECRH stray-radiation is 139.9 to 140.4 GHz resulting from the various individual long-pulse gyrotrons and taking into account their individual frequency downchirp of ~ 300 kHz as they are switched on. It is cut out of the spectrum directly in front of the radiometer by a waveguide Bragg reflection notch filter [12] with depth > 40 dB (this value being limited by the available measurement equipment) and an insertion loss of about 5 dB outside this frequency band (Fig. 4).
Fig. 4: Insertion loss of the Bragg reflection notch filter measured with a noise source and the radiometer
channels. About 2 dB of the measured values account for the tapers and waveguides used for the measurement itself. The overall insertion loss is 5 dB in the probed frequency band. Ch16 and 17 are already at the edge of the notch and thus difficult to calibrate.
2.3 Radiometer
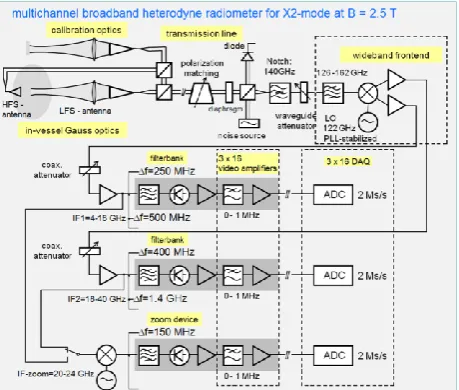
frequency range 2 to 40 GHz (Fig. 5). Already in the mixer itself the IF signal is split into the bands of the subsequent filterbanks 2 - 18 GHz and 18 - 40 GHz with 16 channels each [6[,[14]. The bandwidth of the individual filters (0.25 - 1.4 GHz) corresponding to a radial resolution between 0.5 to 1 cm is adapted to the radial resolution of the ECE emission, as calculated from the optical depth at the expected plasma conditions for standard plasma profiles [9]. The detector diode output after pre-amplification is launched and filtered via differential amplifiers (Tektronix AM502), to the subsequent DAQ system. Its analogue input stage expands the nominal range of ± 5 V to the capabilities of the 2 Ms/s, 16 bit DAQ (ATCA-MIMO-ISOL based on an FPGA) which allows to study fast mesoscale events also and simultaneously limits the measured frequency range according Nyquist theorem by a low pass filter with a 3dB compression at 550 kHz.
The overall noise level of the radiometer is determined by the broadband mixer and the subsequent broadband video amplifiers, the noise of the IF system itself is negligible. In each of the two IF-systems the gain can be adapted by calibrated attenuators such that the diodes are operated in their linear range. The fixed gain of the broadband video pre-amplifiers has been set such that linearity is guaranteed if the output does not exceed 1V which is monitored during operation and attenuation is adapted if necessary.
Fig. 5: Scheme of the 32ch radiometer and the 16ch zoom device.
A characteristic of the two IF-systems is the rather large variety of individual channel sensitivity which varies by up to a factor of 20 generally decreasing towards the higher frequencies (Fig. 6). For the individual channels the signals are levelled by attenuators in front of the diodes such that for all channels of a filterbank linearity is guaranteed up to the same level of microwave input power as proven with the noise source
For higher frequency resolution at a suitable radial range the radiometer is supplemented with a “zoom” device in parallel to the standard filterbank [15] with 16
channels (bandwidth 150 MHz) spread over an IF band of 4 GHz only (20 - 24GHz). It uses a tunable LO and a wideband mixer to select any part of the original 2 to 40 GHz IF-band. In magnetic radial coordinates this frequency span of 4 GHz covered with 16 channels corresponds to a radial range of r ~ 6 cm at the High-Field Side (HFS) or ~15cm at the Low High-Field Side (LFS), respectively.
Fig. 6: Individual response of the radiometer channels to the chopped Noise Source.
2.4 Calibration
For an absolute overall calibration of the diagnostic a second identical Gaussian optical system has been built as a twin outside the torus (Fig. 3). This calibration unit includes identical waveguide components, mica window, polarization splitter and a geometrically identical transmission line, however, with a hot-cold calibration source chopping between LN2 temperature and room
temperature in front of it. Laboratory measurements with this arrangement showed that the two optical systems can be relative calibrated relative to each other with an accuracy of about 5% provided spurious reflections in the transmission path are carefully avoided. A detailed analysis of this hot/cold calibration process including a straightforward Bayesian error analysis is given in Höfel et al. [16].
possible calibration errors of the DAQ modules cancel in the final determination of radiation temperatures. The video amplifier gain shows an accuracy of ± 1.5% over the full three decades. The DC offset used during calibration to balance the finite DC component of the signal resulting from the frontend noise does not hamper this linearity. Worst cases exceeding this value of ± 1.5% range up to a non-linearity of 2.7% for a few individual channels.
Conditional averaging over 1 - 2 hours uses the signal from the rotating mirror (rotation speed ~ 3 Hz) that serves as a chopper between hot and cold for reference. Finally, this absolute calibration of the ECE channels is directly hampered by the temporal stability of all components in the signal chain, which may depend on thermal drifts. To minimize drifts the DAQ system temperature is controlled. As a monitor for drifts and to detect possible individual channel failure during operation, a D-band (120 to 160 GHz) noise source can be selected by waveguide switch in the oversized transmission line right before the notch filter. It provides a relative calibration correction with respect to the last Hot/Cold calibration that needs to be taken into account.
Due to the large variation of channel sensitivity some individual channels with low signal-to-noise ratio during the hot/cold calibration are recalibrated by means of their neighbor channels using the ECE emission of selected plasma discharges as broadband noise sources. To avoid perturbation with possible ECR heating effects only time windows significantly after ECRH has been switched off are used for this relative calibration step.
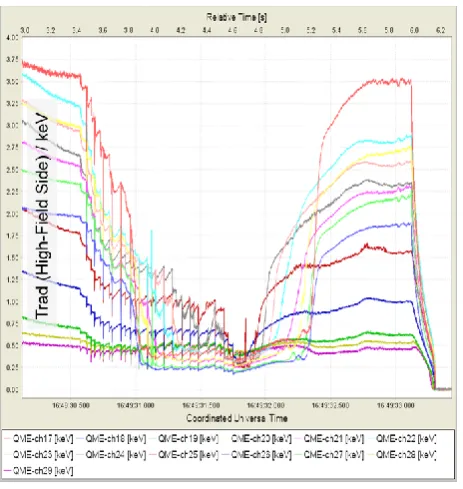
Fig. 7: Time traces from the ECE Low-Field Side right after 2 MW ECRH in a stationary low density plasma (ne= 1.5 1019 m-3) has been terminated. The inlay shows
exponential fits to the two timescales for a selected central LFS channel. Note that the High Field Side channel (f= 141.1 GHz) plotted in light green displays the energy confinement time only.
3
ECE time traces, spectra and
temperature profiles
Besides X2 blackbody emission the ECE radiation temperature spectra Trad(f)show features that display EC emission from hot core electrons for frequencies where the plasma is optically grey (Fig. 8). Moreover, in low density plasmas with small optical depth the ECE radiation temperatures on the low field side near the center (f < fECRH = 140 GHz) tend to be increased due to shine-through from the hot ECRH-heated core region right behind. These non-thermal emission contributions can be distinguished from local blackbody emission by ECRH power steps downward, where their decay is faster than that of the thermal spectrum (order of 5 ms in contrast to order confinement time ~100 to 150 ms) as it displays local changes in the core electron distribution functions rather than temperature changes (Fig. 7).
Fig. 8:The radiation temperature spectrum Trad(f)at its Low-Field-Side shows downshifted emission from hot core-electrons as well. The example is a low density discharge with low with heating PECRH= 0.6 MW.
High-Field-Side already display downshifted core emission from the 3rd EC harmonic as seen by their fast
decay at ECRH power switch down as confirmed by TRAVIS.
Electron temperature Teprofiles are derived using ray tracing of the radiation transport along the line of sight with the TRAVIS code, equilibrium calculations from VMEC and the Bayesian framework Minerva (Fig. 9). The latter allows for a rigorous error analysis and the integration with the information obtained from other diagnostics as well. A detail description of this process is in preparation by Höfel [17].
4 Dynamic phenomena
Stationary and dynamic transport studies were conducted together with the flexible ECRH system with its option for on- and off-axis heating, power steps and power modulation. Heatwave propagation experiments, with on- and off-axis power modulation of the gyrotrons, allow for the determination of the ECRH power deposition profiles as well as for dynamic electron transport studies [20].
The ECE radiometer also displays spontaneous radially propagating electron temperature perturbations. They have been used as tracer to display electron heat transport applying transfer entropy as an advanced technique that detects causal information transfer [21]. The zoom device with its radially close channels also allowed for first temperature fluctuation studies using radial correlation techniques [22].
Fig. 10: Time traces of selected High-Field-Side radiometer channels during a discharge with a series of pellets driving the central ECE channels to cut-off. After the pellets the ECE signals recover channel for channel as the density is decreasing again.
The radiometer also provides MHD mode activity [23],[24] such as a nearly coherent activity with frequency around 7 to 10 kHz is visible in ECE channels located ~ r/a= 0.5 in several scenarios possibly related to an ι = 4/5 rational surface and edge related crashes.
Individual events such as pellet injection [25] and ECCD-driven current induced crash events [26],[26] have been investigated as well. Fig. 10 shows time traces during a density increase supported by a series of pellets. As a consequence X2 cut-off is reached for the core channels. ECE emission is recovered - one channel after the other -as the density falls again.
5 Outline: ECE diagnostic for
high-density steady state operation of W7-X
For the desired high-density (overdense) steady-state scenarios of W7-X at n > nco(X2) = 1.2 1020 m-3 heated by O2 ECRH, where X2 ECE fails, a continuous core temperature measurements needs to be developed. As an option the diagnostic capability of ECE at optically grey harmonics such as X3 is studied. Another alternative would be Electron Bernstein Wave Emission. As a first step a Michelson interferometer has been operated in OP1.2b which shares the same line-of sight as the X2-radiometer [28]. Strong emission of the 3rd and weaker at
the 4th harmonic are observed [29]. For high
performance plasma conditions the X3 emission is close to blackbody radiation in particular on its low frequency side as expected from TRAVIS calculations. In order to derive absolute temperatures an integrated data analysis using the frequent Thomson profiles and interferometry signals is being prepared.
The broadband spectra derived with the Michelson interferometer in both X- and O-mode also support the interpretation of the 2nd harmonic radiometer results as
e.g. the intensity of the O2 emission is affected by multipass effects resulting from reflection at the torus backwall. High heat loads there hamper the realization of an anti-reflection structure. The fact that in the stellarator this backwall is toroidally and poloidally tilted with respect to the ECE sightline complicates the interpretation of the multipass effects. A concern is that back-reflected microwave components which may be partially depolarized pollute the X2 measurements.
A critical issue of the Michelson interferometer is the suppression of ECRH stray-radiation which in O2 heating scenarios at high densities is significantly increased with respect to X2 heating scenarios due to the reduced single pass absorption [28]. Therefore a quasi-optical 140 GHz notch filter with wide passband has been developed which allows to measure the full ECE spectrum 50 to 500 GHz [29]. Gyrotron sidebands are a further issue to be taken into account under these diagnostic conditions.
6 Acknowledgement
This work has been carried out within the framework of the EURO fusion consortium and has received funding from the EURATOM research and training programme 2014-2018 under grant agreement No 633053. The views and opinions expressed herein do not necessarily reflect those of the European Commission
References
[1] Grieger G. et al. 1992 Phys. FluidsB 4 (7) 2081 [2] Laqua H. et al. 2018 this workshop, Wolf R. et al.
2018 Electron-cyclotron resonance heating in Wendelstein 7-X: A versatile heating and current drive method and a tool for in depth physics studies, submitted to Plasma Phys. Contr. Fusion
[3] Brunner K. J. et al. 2018 this workshop, Stange, T. et al. 2018 First Demonstration of Magnetically Confined high Temperature Plasmas beyond the X2 cut-off density sustained by O2-heating only, submitted to Phys Rev. Lett.
[4] Hirsch M. et al. 2017 Nucl. Fusion57 086010
[5] Dinklage A. et al. 2018 Magnetic Configuration
effects on the Wendelstein 7-X Stellarator, accepted for publ. Nature Physics
[6] Fuchs Ch. and Hartfuss H.-J. 2001 Fus. Eng. Design 53 451-456
[7] Hirsch M. et al. 2016 Proc. of the 43rd EPS
conference on Plasma Physics (EPS2016), P4.007 [8] Maruschenko N. B. et al. 2006 Fus. Sci. Technol.50
395
[9] Schmuck S. et al. 2009 Fusion Eng. and Design84 1739-1743
[10]Oosterbeek J. W. et al. 2018 this workshop
[11]Plaum B. 2018 J of Infrared Milli Terahz Waves 39:984-995
[12]Wagner D. et al. 2011 J Infrared Milli Terahz Waves32 1424–1433
[13]Schmuck S. et al. 36th EPS Conference on Plasma Phys. Sofia ECA Vol.33E, P-4.212
[14]Hirsch M. et al. 2015 Proceedings of Science, 1st EPS Conference on Plasma Diagnostics ECPD 14-17 April 2015, Villa Mondragone, Frascati Italy.
[15]Fuchs Ch. and Hartfuss H.-J. 2001 Rev. Sci Instrum 72 (1) 383
[16]Höfel U. et al. Bayesian Modelling of Microwave Radiometer Calibration on the example of the Wendelstein 7-X Electron Cyclotron Emission diagnostic to be published.
[17]Höfel U. et al. Bayesian Modelling of the ECE diagnostic at W7-X to be published.
[18]Marushchenko N. B., Turkin Y. and Maassberg H. 2014 Computer Physics Communications 185 165 – 176 ISSN 0010-4655
[19]Hirshman S. P. and Whitson J. C. 1983 The Physics
of Fluids26 3553–3568
[20]Höfel U. et al. 2016 Proc. of the 43rd EPS
conference on Plasma Physics (EPS2016) P4.008 [21]v. Milligen B. et al. 2016 Nucl. Fusion58 076002
[22]Weir G. et al. 2016 Proc. of the 43rd EPS
conference on Plasma Physics (EPS2016) P4.009 [23]Rahbarnia K. et al. 2016 Proc. of the 43rd EPS
conference on Plasma Physics (EPS2016) P4.011 [24]Thomsen H. et al. 2016 Proc. of the 43rd EPS
conference on Plasma Physics (EPS2016) P4.010 [25]Bozhenkov S. et al. 2018 Proc. of the IAEA
conference, Ahmedabad EX/P8-8
[26]Laqua H. et al. 2018 Observation of core electron temperature collapses during ECCD experiments at the Wendelstein7-X Stellarator, submitted to Phys Rev. Lett.
[27] Zanini M et al. this workshop
[28] Oosterbeek H., Chaudhary N. et al. 2018 Broad Band ECE Measurements in ECW heated Plasmas, SOFT 2018 submitted to Fusion Eng. and Design