451 | P a g e
APPLYING BIG DATA ANALYTICS FOR ENERGY
EFFICIENCY
A.Zakiuddin Ahmed
1, J.Sundar
2, P.Rizwan Ahmed
31
Assistant Professor of Computer Science, Mazharul Uloom College, Ambur (India)
2
Research Scholar, Mazharul Uloom College, Ambur (India)
Assistant Professor of Computer Applications, Mazharul Uloom College, Ambur (India)
ABSTRACT
Global energy requirements are continuously increasing. Conventional methods of producing more energy to meet
this growth pose a great threat to the environment. CO2 emissions and other bi-products of energy production and
distribution processes have dire consequences for the environment. Efficient use of energy is one of the main tools
to restrain energy consumption growth without compromising on the customer’s requirements. Improving energy
efficiency requires understanding of the usage patterns and practices. Smart energy grids, pervasive computing,
and communication technologies have enabled the stakeholders in the energy industry to collect large amounts of
useful and highly granular energy us-age data. This data is generated in large volumes and in a variety of
different formats depending on its purpose and systems used to collect it. The volume and diversity of data also
increase with time. All these data characteristics refer to the application of Big Data.
This research paper focuses on harnessing the power of Big Data tools and techniques such as MapReduce and
Apache Hadoop ecosystem tools to collect, process and analyse energy data and generate insights that can be
used to improve energy efficiency. Furthermore, it also includes studying energy efficiency to formulate the use
cases, studying Big Data technologies to present a conceptual model for an end-to-end Big Data analytics
platform, implementation of a part of the conceptual model with the capacity to handle energy efficiency use cases
and performing data analysis to generate useful insights.
The analysis was performed on two data sets. The first data set contained hourly consumption of electricity
consumed by a set of different buildings. The data was analysed to discover the seasonal and daily usage trends.
The analysis also includes the classification of buildings on the basis of energy efficiency while observing the
seasonal impacts on this classification. The analysis was used to build a model for segregating the energy
inefficient buildings from energy efficient buildings. The second data set contained device level electricity
consumption of various home appliances used in an apartment. This data was used to evaluate different prediction
models to forecast future consumption on the basis of previous usage.
The main purpose of this research is to provide the basis for enabling data driven decision making in organizations
working to improve energy efficiency.
Keywords: Big Data, Energy, Smart Grid, Energy Efficiency, Hadoop, Analytics, Machine Learning,
452 | P a g e
I INTRODUCTION
In the modern era, we have seen a phenomenal increase in human dependency on information and communication
technology (ICT). ICT-enabled products and services have transformed the way of life on this planet. We need and
depend on ICT to fulfill our needs from a basic physiological level to the human desire of being an effective part of
society. There are many research areas and opportunities that are emerging as bi-products of this continuous
transformation. One of them is the availability of digital traces of human activities. Every time we use these
services, we produce digital traces that can be recorded and analysed. Big Data refers to these digital traces of
human activity. Ubiquity of computing resources, fast and highly mobile connectivity and the advent of social media
has caused a great surge in the data volumes. Realising the true potentials of data, businesses are not only utilizing it
as a source of decision making, but as a new revenue stream. Emerging large scale opportunities are reshaping the
business models of many companies around the globe.
To support this transfiguration, we have seen a rapid development in distributed parallel computing, data
communication software and machine learning. Industry giants such as Google and Yahoo have open sourced
technologies and tools e.g. MapReduce and Hadoop to facilitate these advancements. Open source soft-ware
communities like Apache Software foundation have further developed these tools to provide a complete ecosystem
for handling Big Data and generating useful insights. The new specialized Big Data companies such as Cloudera and
Horton-works have emerged as the catalyst for this data revolution. In this research, we try to formulate a model for
an end-to-end Big Data analytics platform based on these technologies that can ingest data from heterogeneous
sources, process it in an efficient way, mine the data to generate insights based on business logic and then present
the information using interactive visualisations. This practical part of the research includes the development as well
as implementation of the mentioned Big Data platform to perform the analyses on real life use cases and generate
useful insights. The model is based on open source software components available free of charge. There are other
closed source software alternatives that can t into the presented model, but the discussions about these solutions are
not included in this document.
II PROBLEM STATEMENT
Energy efficiency can help to curtail production of energy to meet growth in demand. This in turn can help to reduce
CO2 emissions. To achieve this goal we need to understand and improve the energy efficiency at both producer and
consumer ends. ICT enabled smart energy grids and devices are being installed globally to measure energy
consumption and improve energy efficiency. These smart de-vices produce large volumes of data. The data
generated by different devices is in different formats. For the purpose of knowledge discovery, this data needs to be
collected, stored and analysed. The extracted insights from the analysis need to be visualised for easy and effective
understanding. The challenge gets even tougher when data needs to be collected and analysed in real time. Then
453 | P a g e
mentioned challenges, a highly scalable and flexible data analysis platform is required that can automate the whole
process. This platform needs to be very cost effective for global adaptation.
In the scope of this research we provide a model for Big Data analytics platform that can provide the solution to
meet these requirements. We also implement the proposed model and test it with real life data from smart energy
devices. The proposed solution is based on open source components that can be deployed on general purpose
hardware that can be procured very easily and inexpensively. The proposed platform can be scaled according to data
requirements and additional functional components can be integrated as per the scope of analysis. The data analysis
within our research also provides advance analytics models to extract the information based on energy efficiency
use cases from large volumes of data.
III SMART GRIDS
The energy industry across the globe is facing numerous challenges. There are huge pressures from regulatory
authorities and environmental organizations to re-duce their carbon footprint, expand their renewable energy
portfolios, and to take energy conservation measures. The demand response (DR)1 and its impacts on consumer
behaviour requires rapid adaptations in energy service providers' business models. According to United States
Federal Energy Regulatory Commission (FERC):
Demand response can provide competitive pressure to reduce wholesale power prices; increases awareness of
energy usage; provides for more efficient operation of markets; mitigates market power; enhances reliability; and in
combination with certain new technologies, can support the use of renewable energy resources, distributed
generation, and advanced metering. Thus, enabling demand-side re-sources, as well as supply-side resources,
improves the economic operation of electric power markets by aligning prices more closely with the value
customers place on electric power".
Traditionally, power system participants have been strictly producers or consumers of electricity. The demand
response and reliability issues with conventional electric power distribution models on the consumer side are
causing a major trend in motivating consumers to produce electricity at a domestic level mostly using the renewable
energy production methods. \Prosumer" is an emerging term used for an economically motivated entity.
IV THE GREEN CAMPUS INITIATIVE
The Green Campus initiative is a project by \Technical Research Centre of Fin-land" (VTT). It is part of the
EcoCampus 2030 program. The EcoCampus is an attempt to increase energy efficiency in districts and buildings by
innovative management and control systems capable to optimize the local consumption with-out compromising the
indoor environment, occupant comfort and building performance, and by introducing new ICT enabled business
models. The vision of the program is to realize a net zero energy model for a world class research, development and
educational facility. Program focuses on co-designing this model with user by educating them and then collecting
454 | P a g e
to become self sustainable for the future. As a consequence, this performance based ecosystem can help both
consumers and producers to adapt with the demand response.
The Green Campus initiative is a pilot project for the EcoCampus 2030 pro-gram. VTT has installed smart devices
inside Aalto University campus buildings in the cities of Espoo and Helsinki. These specialized devices are
equipped with smart meters for energy consumption and indoor environment monitoring sensors. The data used for
analysis in our research was collected from a subset of buildings used as test sites for this research paper. The data
includes hourly consumption of electricity and electricity used for heating. For one of the test sites VTT has
provided us with the data of device level energy consumption details i.e. electricity used by different home
appliances. This was achieved using smart NIALM meters that can distinguish between different electric devices
used on the basis of their signal thumb print.
Apart from providing the data, the researchers from VTT's Green Campus initiative have also helped us in
formulating the use cases for this research paper.
V BIG DATA ANALYTICS
Big Data analytics is the application of advanced data analytics techniques on large volumes of data. Advanced
analytics is a generalized term used for data analysis techniques: statistical analysis, data mining, machine learning,
natural language processing, text mining and data visualisation etc. Although the data volume is a widely used factor
for qualification of the Big Data, when it comes to Big Data analytics there are a few other important attributes i.e.
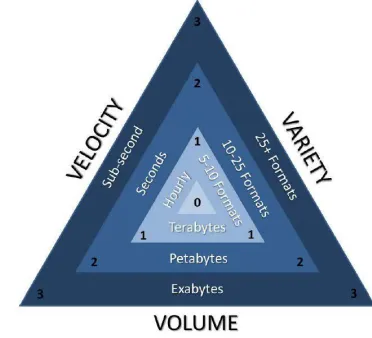
variety, velocity, valuation and veracity. The concept of the 3V's (volume, variety and velocity) of data was first
given by an analyst, Doug Laney from Gartner in a 2001 MetaGroup research publication, 3D data management:
Controlling data volume, variety and velocity" . Gartner used this concept to formulate a data magnitude index that
can support decision making for selection of the solutions for tackling Big Data challenges. This concept is shown in
Figure 1.1.
Numbers 0 to 3 represents the scale of the data that can be perceived on each dimension. Adding them together for a
Big Data case can provide the data magnitude index. This method provides some basis for quantifying the data as
Big Data, however it does not provide a definitive model as it allows presumptions to scale the data. Valuation and
veracity are two other factors that are being used widely along with Gartner's 3V's. Valuation supports the decision
making by considering the value of outcomes against the e orts required to collect, manage, process and analyse
large amounts of data. While veracity refers to ambiguity in the data that can cause complexity. There is no standard
definition of Big Data but most of the attempts to de ne Big Data can be associated with these five factors that we
have discussed.
As a matter of fact, we are not attempting to provide a definition of Big Data as part of this study or stating any
criteria for qualification of a data set as Big Data. Instead we are proposing an advanced analytics model that should
be capable enough to handle Big Data as well other smaller data sets. The modular architecture of the model
platform can be tweaked to handle volume, variety, velocity, and veracity based on the requirements while trying to
455 | P a g e
advancements that enable handling of the mentioned challenges of Big Data analytics. These concepts, tools and
techniques are also used in developing the data analytics platform and performing the analysis for our research
paper.
Figure 1.1: Gartner 3V's of data and data magnitude index
VI PARALLEL BATCH PROCESSING WITH HADOOP
It is hard to predict the size of data and computing power required to process the data when dealing with Big Data.
Scaling up 4is an option that is always bounded by some maximum capacity limits. Also specialized hardware to
scale up for higher capacity usually cost much more than general purpose hardware. So Hadoop is the open source
software framework whose main components are drived from MapReduce. It was developed by Doug Cutting and
Mike Cafarella. It was initially created in 2005 to support an open source search engine but then adapted to the
published MapReduced framework. It was released by the Apache foundation. Apache has also built various
supporting tools around Hadoop framework to support end-to-end Big Data analytics ecosystems e.g. Apache
resume for data collection, Hadoop File system (HDFS) for storing, Apache Pig and Hive for processing, Apache
Mahout for machine learning.
Hadoop is a batch processing framework that empower processing of large volumes of data using commercial grade
low cost computing infrastructure. So they support volume and valuation directly. Variety can also be supported by
different file formats in HDFS. Veracity is subjected to supported tools like data collection or data mining tools.
Support for such tools is available in Apache Hadoop e.g. Flume, Mahout etc. Velocity however is the only feature
that a batch processing framework like Hadoop cannot handle. The next subsection answers the question of velocity.
VII REAL TIME BIG DATA PROCESSING
Real time data processing is generally associated with live streams of the data. The real time data can be processed
and analysed on arrival or it can be buffered for small intervals to provide near to real time analysis. However in
456 | P a g e
data. To apply advanced analytics models such as machine learning, active feedback loops are also necessary. Even
for stored (non live data) Big Data, applications require data processing systems to answer queries very fast. To
fulfill these industry-driven requirements technology is in rapid advance mode. In the last twelve to eighteen months
we have seen software like YARN (Hadoop 2.0), Storm, Spark, Shark, Cloudera Impala etc. with near to real time
processing capabilities. On top of it, tools like Mlbase and Cloudera Oryx have started to enable real time advance
analytics. Most of these systems, frameworks and tools are being developed as the evolution path for Hadoop. All of
them have their own purpose, strengths, and limitations. They are mostly used in combinations depending on the use
cases. We are not discussing or comparing these systems and tools. Instead, in this article, We brie y discuss the two
prevailing architectural constructs that can enable real or near to real time Big Data processing.
VIII CONCLUSIONS
Global energy needs are continuously growing. The conventional methods for producing more energy to meet the
demand pose a great threat to the environment. Among other solutions, energy efficiency has become a major tool
for minimizing the need for producing more energy to cater for the growing demand. Inherently, the cause of
improving energy efficiency relies on understanding the usage patterns, identifying the problematic areas,
establishing good energy consumption practices and to rectify the faults to reduce energy leakages. The
advancement in sensors, ubiquitous computing and communication technologies has provided the basis for
effectively collecting the usage data to understand energy usage. The collected data needs to be processed to
generate leads for improving energy efficiency. The quality of insights generated from data improves if we consider
the current data in context to historic data. This means that data volume for processing will keep on increasing.
There can be multiple sources of data so the data formats can also vary. On the use case basis, data processing
requires flexibility for customization and variation in speed of data processing. All of these data features refers to
application of Big Data technologies for energy efficiency.
Distributed parallel computing programming models like MapReduce provide the basic environment for handling
Big Data. We leveraged on the power of MapReduce using Apache Hadoop ecosystem tools to present an
end-to-end Big Data analytics tool. Hadoop supports scalability to meet large volumes of data sets while the there are other
tools that can integrate with Hadoop to process complexity in data. We used the model platform to process real life
energy data and generated insights that can be used to improve energy efficiency. The proposed model provides a
'plug and play' environment for many other analytic tools to integrate on a need basis. It is based entirely on open
source software components and can be deployed using general purpose hardware or any cloud based model.
REFERENCES
[1] Arundel, A., and Kemp, R. Measuring eco-innovation. United Nations University Working Paper Series,
2009/017 (2009), 1{40.
[2] Balijepalli, V. M., Pradhan, V., Khaparde, S., and Shereef, R. Review of demand response under smart grid
paradigm. In Innovative Smart Grid Technologies-India (ISGT India), 2011 IEEE PES (2011), IEEE, pp.
457 | P a g e
[3] Boehm, B. A spiral model of software development and enhancement. SIG-SOFT Softw. Eng. Notes 11, 4
(Aug. 1986), 14{24.
[4] Box, G. E., and Jenkins, G. M. Time series analysis: forecasting and control, revised ed. Holden-Day, 1976.
[5] Commission, F. E. R., et al. Assessment of demand response and ad-vanced metering.
[6] Dean, J., and Ghemawat, S. Mapreduce: simpli ed data processing on large clusters. Communications of the
ACM 51, 1 (2008), 107{113.
[7] Dr. Chryssis Georgiou, U. o. C. Reference guide: Acm style. http:// www.cs.ucy.ac.cy/~
chryssis/specs/ACM-refguide.pdf. Accessed: 2014-06-09.
[8] Farhangi, H. The path of the smart grid. Power and Energy Magazine, IEEE 8, 1 (2010), 18{28.
[9] Forgy, E. W. Cluster analysis of multivariate data: efficiency versus interpretability of classi cations. Biometrics
21 (1965), 768{769.
[10]Forsstrom,• J., Lahti, P., Pursiheimo, E., Ram•a,• M., Shemeikka, J., Sipila,• K., Tuominen, P., and Wahlgren, I.
Measuring energy efficiency.
[11]Grijalva, S., and Tariq, M. U. Prosumer-based smart grid architecture enables a at, sustainable electricity
industry. In Innovative Smart Grid Technologies (ISGT), 2011 IEEE PES (2011), IEEE, pp. 1
[12]Hanrahan, P. Vizql: a language for query, analysis and visualization. In
[13]Proceedings of the 2006 ACM SIGMOD international conference on Management of data (2006), ACM, pp.