STUDIES ON BTEX IN AMBIENT AIR OF AGRA
Vineet Bhardwaj
1, Babita Rani
2and Ashok Kumar
31,3
School of Chemical Science, Department of Chemistry,
St.John’s College Agra, Uttar Pradesh (India)
2Department of Chemistry, Agra College. Agra, Utter Pradesh (India)
ABSTRACT
In this study, the concentration of benzene, toluene, ethylbenzene and xylene were measured in ambient air of Agra, Uttar Pradesh , India at five locations. Samples were collected by using Respo Rae 3000 Ultra VOC Monitor having PID with 9.8 eV discharge lamp. It is a real time measurement of BTEX. It was observed that the toluene has the highest concentration species, followed by benzene, ethylbenzene and xylene. Maximum concentration of BTEX were reported in winter season and the lowest concentrations of BTEX were reported in summer season. Refueling pump stations and vehicular exhaust emission as well as usage of petrochemical products are the dominant sources of BTEX were observed.
Key words: photo-ionization, pre-concentration, fatigue, solvent usage, FID (Flame Ionization
Detector).
I. INTRODUCTION
With the recent introduction of the problems associated with the air pollution in the whole world, this triggered
our interest in investigating the presences of BTEX in ambient air of Agra. The term BTEX is regarded as
benzene toluene, ethylbenzene and xylene collectively. Several megacities of the world are facing serious air
quality problems as a results of increase in urbanization and industrialization, as well as population [1]. There
has been a continuous increase in levels of pollutants (VOCs) and environmental emanating from these
pollutants particularly from the second half of the last century [2]. VOCs, mainly BTEX play an important role
in the chemistry of atmosphere such as their role in the formation of photochemical smog and their associated
oxidants, degrading air quality and threatening both human health and ecosystem is alarming [3,4]. Several
studies have shown that VOCs enter the human bloodstream through the following means; inhalation, ingestion
and through the skin. The short term adverse health effects of BTEX include conjunctive irritation, nose
irritation, throat discomfort, headache, sleeplessness, allergic skin reaction, nausea, fatique and dizziness. While
the long term health effects of BTEX include loss of coordination, leukemia, anaemia, cancer and damage to
liver, kidney and central nervous system(CNS) [5,6,7]. In addition, BTEX have long been object of study in
occupational epidemiology, hence, the health effects of these compounds among highly exposed population are
well known. The health effects, those caused by chronic exposure to benzene, which are considered to have
more serious consequences than the exposure to other compounds such as toluene, ethylbenzene and xylene. In
this context, there is a scientific evidences that benzene exposure is one of the risk for leukemia [8] and other
types of cancers [9] and that it has immune-toxic effects.
Several studies have shown that more of the BTEX were released in the ambient air during the dry season, this
may also be attributed to a greater industrial activities such as solvent usage, petrochemical processes, storage
and distribution of chemicals, combustion processes, vehicular exhaust and petroleum products emissions,
conditioner workshops, fuel filling stations and hawkers of cloths, footwears, cosmetics etc [11]. While in wet
season, BTEX levels are low due to dilution of the atmospheric air. In this context, the presence of heavy traffic,
gas stations, refueling pump stations and petrochemical plants in the vicinity are the main determinants of the
levels of BTEX pollutants [12,13]. Several researchers have attempted VOCs monitoring studies over different
parts of the world considering BTEX increasing importance in environmental issues[14].
In this context, the spatial and temporal distribution of VOCs concentration in Apapa industrial area was found
to be dependent mainly on industrial activities such as industrial solvent usage, petrochemical processes, storage
and distribution of chemicals, combustion processes, vehicular/petroleum products emission and meterological
factor such as wind speed, direction of wind, humidity, rainfall and temperature [11]. Weekdays – weekends
variations of total volatile organic compounds (TVOCs) in atmosphere of Benin city, Southern Nigeria was
determined [15]. Meteorological conditions and photochemical activities cause diurnal, seasonal and annual
variations of VOCs concentration [16]. Outdoor, indoor and personal distribution of BTEX in pregnant women
from two areas of Spain was studied and found that in comparision with other studies, sample population’s
exposure to BTEX compounds was not excessively high[17]. Indoor and outdoor air concentrations of BTEX
and NO2 was measured and observed that in a setting of moderate climate like Germany, the variability of
BTEX and NO2 concentrations over time id high [18]. Measurements and correlations of MTBE and BTEX in
traffic tunnels was estimated and pointed out that notanly the high ratios in all tunnels reflect a fresh air parcel
in the tunnels due to enclosed/half-enclosed environment[19]. Occupational exposure of gasoline station
workers to BTEX compounds in Bangkok, Thailand was reported and showed that exposure to BTEX
compounds would increase the risk of cancer in gasoline station workers. Exposure to benzene and toluene may
cause fatigue [20]. Patterns of VOCs and BTEX concentrations in ambient air around industrial sources in
Daegu, Korea was studied and indicated by the significant differences observed between daytime and nighttime
BTEX [21].
Therefore, monitoring of BTEX in urban area has become important issue. With this view, the present study
aims to report the ambient levels of BTEX measured at Agra at different locations.
II. METHODOLOGY
Several methods have employed to determine the concentrations of BTEX in ambient air, depend on the
presence of air pollutants. These methods are active and passive sampling. In active sampling method, first the
samples were collected by sampling tube filled with coconut shell charcoal at a height of 1.5m – 2.0m, by using
the sampling pump at the flow rate of 30– 60ml/minute. Then the absorbed BTEX were desorbed with
carbondisulphide and kept for ultrasonication for 30 minutes. Finally, the solution analysed using gas
chromatography (GC) fitted with flame ionization detector (FID). While in passive sampling method, the
sampling tube were exposed in air with the help of hood and then followed the active sampling method [22,23].
In the present study, the study area is Agra, which is located at latitude of 270 10’ N and longitude of 780 05’ E with an altitude of 169m above the sea level in the semiarid zone of India. Agra has a continental type of
climate characterized by extreme dryness in summer and cold winters with calm periods. The study period was
devided into four seasons on the basis of rainfall, namely summer ( March-June), mansoon ( July -August ),
Five different sites were selected namely, Avas Vikas colony ( residential ), Sadar Market ( Commercial ),
Foundary Nagar ( Industrial), St. John’s crossing (traffic intersections) and Hariparwat ( refueling pump
station) respectively. In this study, the ambient air samples were collected during the period of November 2008
to October 2009 at five locations in Agra , Uttar Pradesh, India. A real time measurements of benzene, toluene.
ethylbenzene and xylene (BTEX), ambient air concentrations were performed by using Respo Rea 3000 Ultra
VOC Monitor, which is a programmable compound specific photoionization detector (PID), designed to provide
instantaneous monitoring of BTEX. The PID has a 9.8 eV gas discharge lamp. Before using the VOC Monitor,
it was first calibrated with isobutylene gas level in usual fashion to read in isobutylene equivalent. After
calibration process, monitor now ready to use. Thus we collected samples and obtained the reading which
manually multiplied by the correction factor (CF) to obtain the concentration of BTEX. The sample size for
the pre-concentration step was four hours in a month at all the selected locations in Agra. The obtained data on
BTEX were statistically analysed and compared with other studies performed in India and other countries of the
world.
III. RESULTS AND DISCUSSIONS
Through this study, the levels of BTEX from five locations in Agra has been obtained. The average
concentrations of BTEX measured in Agra by means of VOC monitor, during November 2008 to October 2009
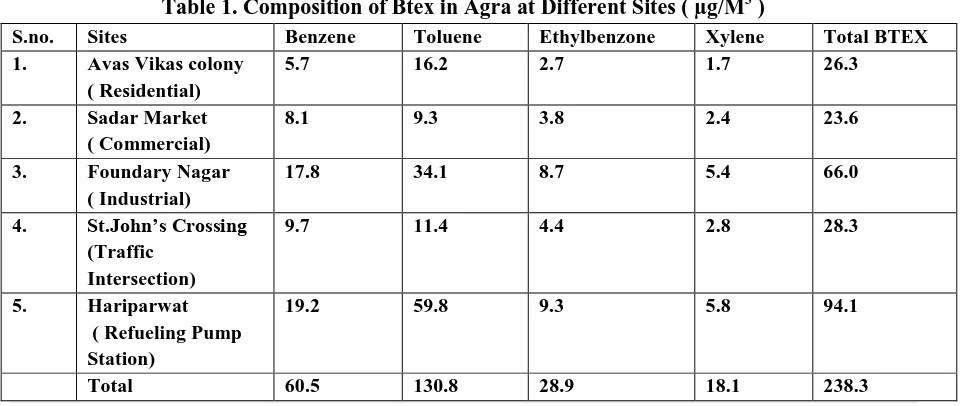
are summarized in Table 1. Highest concentrations of BTEX were observed at Hariparwat (Refueling pump
station) and followed by Foundary Nagar (Industrial), St. John’s crossing (Traffic Intersection), Sadar Market
(Commercial) and Avas Vikas colony (Residential) locations respectively. This showed that refueling pump
stations, petrochemical processes and products, vehicular exhaust emissions, anthropogenic activities are the
main sources of the BTEX in ambient air. In overall study, the total BTEX concentrations measured in Agra was
238.3 µg/m3 at all the locations during November 2008 to October 2009. The results indicate the following BTEX composition: 25.4 % of benzene, 54.8 % of toluene, 12.1 % of ethylbenzene and 7.7 % 0f xylene
respectively. Toluene constitutes highest percentage composition, followed by benzene, ethylbenzene and
xylene respectively. From the table-1, it was evident that the highest concentration of benzene was observed at
Hariparwat refueling pump station location and the lowest concentration was observed at Avas Vikas colony
(Residential). Similar patterns were shown by other species such as toluene, ethylbenzene and xylene.
Table 1. Composition of Btex in Agra at Different Sites ( µg/M
3)
S.no. Sites Benzene Toluene Ethylbenzone Xylene Total BTEX
1. Avas Vikas colony ( Residential)
5.7 16.2 2.7 1.7 26.3
2. Sadar Market ( Commercial)
8.1 9.3 3.8 2.4 23.6
3. Foundary Nagar ( Industrial)
17.8 34.1 8.7 5.4 66.0
4. St.John’s Crossing (Traffic
Intersection)
9.7 11.4 4.4 2.8 28.3
5. Hariparwat ( Refueling Pump Station)
19.2 59.8 9.3 5.8 94.1
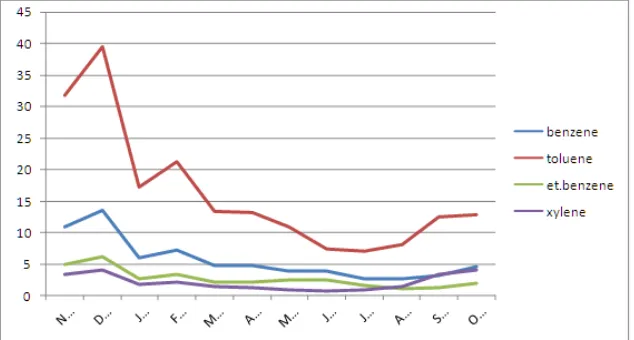
Figure 1-5,summarizes the trends of the monthly mean concentrations of BTEX measured in Agra. At all the
locations, the annual mean concentrations were : 5.7, 8.1, 17.8, 9.7 and 19.2
µg/m
3 for benzene, 16.2, 9.3, 34.1,11.4 and 59.8
µg/m
3 for toluene, 2.7, 3.8, 8.7, 4.4, and 9.3µg/m
3 for ethylbenzene and 1.7, 2.4, 5.4, 2.8 and5.8
µg/m
3 for xylene respectively. Toluene concentrations were 1.5 to 3 times higher than benzeneconcentrations. Similarly, toluene concentrations were 5 to 7 times higher than ethylbenzene concentrations and
6 to 9 times higher than the concentrations of xylene respectively. Therefore, at each locations, the
concentrations of toluene were highest and followed by the benzene, ethylbenzene and xylene respectively. The
concentrations of BTEX decreases during the summer, monsoon and post-monsoon periods and increases in
winter periods due to the reactivity of these compounds (Figures 1-5). It was also observed that the BTEX
concentrations were quite high in winter season than summer. These species follow the given trends in Agra
during November 2008 to October 2009:
Winter season > Summer season > Monsoon season > Post-monsoon season
Figure-1. Average monthly variation of BTEX at Avas Vikas Colony (Residential) during November
2008 to October 2009.
Figure-2. Average monthly variation of BTEX at Sadar Market (Commercial) during
November 2008 to October 2009.
Figure-4. Average monthly variation of BTEX at St. John’s Crossing (Traffic Intersection)
during November 2008 to October 2009.
Figure-5. Average monthly variation of BTEX at Hariparwat (Refuelimg pump station) during
November 2008 to October 2009.
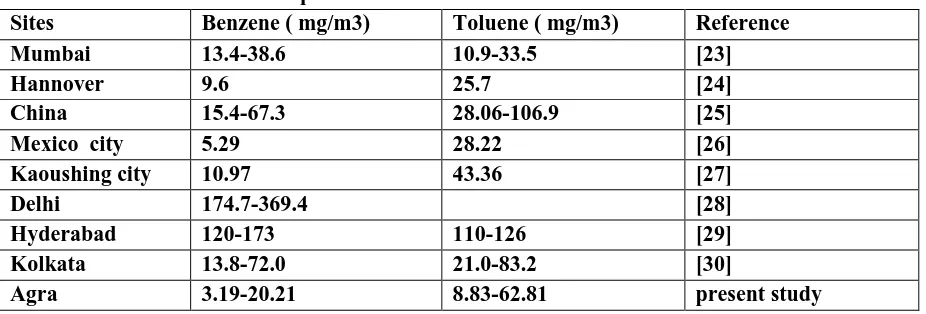
Table -2 Comparision of benzene and toluene with other sites.
Sites
Benzene ( mg/m3)
Toluene ( mg/m3)
Reference
Mumbai
13.4-38.6
10.9-33.5
[23]
Hannover
9.6
25.7
[24]
China
15.4-67.3
28.06-106.9
[25]
Mexico city
5.29
28.22
[26]
Kaoushing city
10.97
43.36
[27]
Delhi
174.7-369.4
[28]
Hyderabad
120-173
110-126
[29]
Kolkata
13.8-72.0
21.0-83.2
[30]
Agra
3.19-20.21
8.83-62.81
present study
much lower than other megacities like Mumbai [23], Delhi [28], China [25], Hyderabad [29], and Kolkata [30]. Comparatively higher concentrations of benzene and toluene might to be due to more traffic density and hence greater vehicular exhaust emission.
IV. CONCLUSIONS
The distribution of BTEX concentrations in Agra at five locations was found to be dependent mainly on
industrial activities such as industrial solvent usage, petrochemical processes, storage and distribution of
chemicals, combustion processes, vehicular exhaust emission, petroleum products emission and meterological
factors such as wind speed, direction of wind, humidity, rainfall and temperature .
V. ACKNOWLEDGEMENT
The department of Chemistry, School of Chemical Sciences, St. John’s College Agra are acknowledged for
supporting this research. The authors would like to thanks the head of the department of Chemistry , Dr. Hemant
Kulshrestha and principal Dr. P. E. Joseph. The authors would like to express their appreciation of Dr. Ajay
Taneja for helping this study and experiments successfully.
REFERENCES
[1.] M.J.Molina. A.V. Ivanov, S. Trakhtenberg and L.T. Molina, Atmospheric evaluation of organic aerosol,
Geophysical Research Letters, L 22104, 31, 2004, 1-5.
[2.] S.M. Robaa, A study of solar radiation climate at Cairo urban area, Egypt and its environs, International
Journal of Climatology, 26, 2006, 1913-1928.
[3.] L.T. Molina, C.E. Kolb, B. de Foy, B.K. Lamb, W.H. Brune, J.L. Jimenez, R.Ramos-Villegas, J.
Saarmiento, V.H. Paramo-Figueroa, B.Cardenas, V. Gutierrez-Avedoy and M. Molina, Volatile organic
compounds in urban and industrial atmosphere: Measurement techniques and data analysis, International
Journal of Environment Anal. Chemistry, 83, 2007, 199-217.
[4.] M. Ulman and Z. Chilmonczy, Volatile organic compounds- components, sources, determination : A
review, Chemia Analityczna, 52, 2007, 173-200.
[5.] Y.M. Kim, S. Harrad and R.M. Harrison, Concentrations and sources of VOCs in urban and public
[6.] R. Kerbachi, M. Boughedaoui, L. Bounoue and M. Keddam, Ambient air pollution by aromatic
hydrocarbons in Algiers, Atmospheric Environment, 40, 2006, 3395-4003.
[7.] E. Eljarrat and D. Barcelo, Priority lists for persistent organic pollutants and emerging contaminants based
on their relative toxic potency in environmental samples, Trends Analytical Chemistry, 22, 2003, 655-665.
[8.] E.S. Johnson, S. Longard and Y.S. Lin, A critique of benzene exposure in the general population, Science
of The Total Environment, 374, 2007, 183-198.
[9.] L. Miligi, A.S. Costantini, A. Benvenuti, D. Kriebel, V. Bolejack, R. Tumino, V. Ramazzotti, S. Rodella,
E. Stagnaro, P. Crocignani, D. Amadori, D. Mirabelli, L. Sommani, I. Mendico and G.A. Tozzi,
Occupational exposure to solvents and the risks of lymphomas, Epidemiology, 17, 2006, 552-561.
[10.]A. Veraldi, A.S. Costantini, V. Bolejack, L. Miligi, P. Veneis and H. van Loveren, Immunotoxic effects of
chemicals: A matrix for occupational and environmental epidemiological studies, American Journal of
Industrial Medicine, 49, 2006, 1046-1055.
[11.]C.C. Ojiodu, J.M. Okuo and E.G. Olumayede, Spatial and temporal variability of volatile organic
compounds (VOCs) pollution in Apapa industrial areas of Lagos State, Southwestern – Nigeria, Academia
Journal of Environmental Sciences, 1(3), 2013, 53-61.
[12.]C. Jia, J.D.’Souza and S. Batterman, Distributions of personal VOCs exposures: A population – based
analysis, Environment International, 34, 2008, 922- 931.
[13.]E. Symanski, T.H. Stock , P.G. Tee and W. Chan, Demographic residential and behavioral determinants of
elevated exposures to benzene, toluene, ethylbenzene and xylenes among the U.S. population : Results
from 1999-2000 NHANES, Journal of Toxicology and Environmental Health – Patr- A Current Issues 72,
2009, 915-924.
[14.]B. Son, P. Breysse and W. Yang, Volatile organic compounds in residential indoor and outdoor and its
personal exposure in Korea, Environment International, 29, 2003, 79- 85.
[15.]E. G. Olumayede, J. M. Okuo, and C. C. Ojiodu, Week-days – weekends variations of total volatile
organic compounds in the atmosphere of Benin city, Southern- Nigeria, International Journal of Chemistry
and Sciences, 4(2), 2011, 405-415.
[16.]K. Na and Y. P. Kim, Seasonal characteristics of volatile organic compounds in Seoul, Atmospheric
Environment, 35, 2003, 2603-2614.
[17.]S.Llop, F. Ballester, I. Aguilera, M. Estarlich, R-F. Patier, J. Sunyer, A. Esplugues and C. Iniguez,
Outdoor, indoor and personal distribution of BTEX in pregnant women from two areas in Spain-
Preliminary results from tne INMA project, 1, 2010, 147- 154.
[18.]K. K. Richter, H-E. Wiehmann and J. Heinrich, Indoor and outdoor concentrations of BTEX and NO2 :
Correlations of repeated measurements, Journal of Environmental Monitoring, 6, 2004, 807-812.
[19.]L-Te. Hsieh, Y-F. Wang, H-H. Yang and H-H. Mi, Measurements and correlations of MTBE and BTEX in
traffic tunnels, Aerosol and Air Quality Research, 11, 2011, 763-775.
[20.]T. Tunsaringkarn, W. Siriwong, A. Rungsiyothin and S. Nopparabundit, Occupayional exposure of
gasoline station workers to BTEX compounds in Bangkok, Thailand, The International Journal of
[21.]S. W. Choi, S. W. Park, C. S. Lee, H. J. Kim, S. Bae and H. I. Inyang, Patterns of VOC and BTEX
concentration in ambient air around industrial sources in Daegu, Korea, Journal of Environmental Science
and Health, 44(1), 2009, 99-107.
[22.]A. Kumar and S. K. Tyagi, Benzene and toluene profiles in ambient air of Delhi as determined by active
sampling and GC analysis, Journal of Scientific and Industrial Research, 65(3), 2006, 252-257.
[23.]A. M. Mohan Rao, G. G. Pandit , P. Sain, S. Sharma, T. M. Krishnamoorthy and K. S. V. Nambi, Non-
methane hydrocarbons in industrial locations of Bombay, Atmospheric Environment, 31(7), 1997,
1077-1085.
[24.]E. ILgen, N. Karfich, K. Levsen, Atomatic hydrocarbons in the atmospheric environment part 1 Indoor
[25.]Versus outdoor sources, the influence of traffic, Atmospheric Environment, 35(7), 2001,1235-1252.
[26.].M. Wang, G.Y. Shing, J.M. Fu it at , Urban Roadside aromatic hydrocarbons in three cities of the pearl
river delth, peoles Republic of china, Atmospheric Environment, 36(33), 2002,5141-5148.
[27.]. X.M. Wang, G.Y. Shing, J.M. Fu it at , Urban Roadside aromatic hydrocarbons in three cities of the pearl
river delth, peoles Republic of china, Atmospheric Environment, 36(33), 2002,5141-5148.
[28.]H.Brave, R. Sosa, P.Sanchez, E. Bue and L. Gonzaliz, Concentration of benzene and toluene in the
atmospheric area at the mexico city metropolitan Zone, Atmospheric Environment , 36(23), 2002,
3843-3849,
[29.]C.H. dai, K.S. Chen, Y.T. Ho, and M.S. Chou, Characteristics of c2-c15 hydrocaobons in the air of urban
koohsiung, Tiwan, Atmospheric Environment, 38(13), 2004,1997-2011.
[30.]A.Srivatava, A.E. Joseph. S.Patil, A.More, R.C.Dixit, and M.Prakash, Air toxics in ablient air of Delhi,
Atmospheric Environment, 39(1), 2015,59-71.
[31.]P.V. Rekhadevi, M.F. Rahman, M. Mohboob and P.Grover, Genotoricity in filling station attendants
exposed to petroleum hydrocarbons, Journal of occupational hygiene, 54(8), 2010, 944-954.
[32.]D.Majumbar, A.K. Mukherjee, and S.Sen, BTEX in ambient air of a Metroplitan city, Journal of