To Study the Failure Mode and Effective
Analysis of Trailing Arm Weldment
Prakash b Ramanna Bandi1, Vijayavithal Illa2, Navinesh B C2
Asst. Professor, Department of Mechanical Engineering, ICEAS, Engineering College, Bengaluru,
Karnataka, India1
Asst. Professor, Department of Mechanical Engineering, ICEAS, Engineering College, Bengaluru,
Karnataka, India2
ABSTRACT: In this project, the study is relates to vehicle suspension systems for mounting ground-engaging wheels to a vehicle frame and, more particularly, to the axle support means for securing a wheel-carrying axle to a vehicle. Vehicle suspension structures are well-known in the art. The suspension system comprises a trailing arm having a leading portion pivotally coupled to the vehicle frame. An axle is typically welded to a bracket which is, in turn, secured to the trailing arm of the vehicle suspension structure. The weldment securing the axle to the bracket is usually made at the midpoint of the side where vertical bending moment stresses are neutral. These areas are areas of high torsional loading which results from brake torque, vehicle roll and diagonal axle walk. The welding at the midpoint of the axle typically introduces a point of weakness where axle failure may initiate. Therefore to study the failure mode of a trailing arm weldment, static analysis and fatigue analysis will be done using ANSYS V14 and the results obtained will be discussed in details.
KEYWORDS: Vehicle suspension structures(VSH), trailing arm, weldment , fatigue analysis.
I.INTRDUCTION
When carried to the extreme, today's emphasis on automobile mass reduction has significant implications for vehicle ride and suspension design. We therefore review traditional automobile suspension systems and offer comments on the special considerations of suspension systems of extremely low-mass passenger cars. and the actual suspension system often falls short of the ideal in a variety of ways. [1]
In this project, a study is carried out on trailing arm weldment to know failure modes and its life cycle. A trailing arm is part of an automobile's suspension. It is normally located forward of the rear axle and connects the axle to the car chassis. It is a relatively large piece of the suspension that supports the coil springs. When driving down a bumpy road, the trailing arm moves up and down to smooth the ride. [2]
II.GEOMETRIC MODELING OF TRAILING ARM
A trailing arm is a simple mechanical design is often used in the rear suspension of rear wheel drive vehicles and some of them are inexpensive used in front drive vehicles also. In this kind of suspension, trailing arm is connected to the rear axle and to the unibody frame. This controls the motion of the rear axle relative to the vehicle frame through pivot joints on both
The design of trailing arm weldment with tubular cross section of 30mm X 30mm X 2.5mm, Axle support plate of 127 mm X 115mm X 6mm, gussets 205mm X 37.5mmX2.5, Hallow bush dia 51mm X 4.25mm with other gusset members forms the trailing arm structure. The trailing arm is designed to allow the twist beam to move up and down using the axle support plate to cushion and limit the movement with the suspension bracket. The dimensional requirements are critical, as it implies that the designed structure should be very rigid and capable of withstanding the forces generated due to bump loads
Fig1: Generic View of Trailing Arm Weldment III.METHODOLOGY FOLLOWED
IV.HOW TO RUN THE ANALYSIS
1. Carry out static analysis and study the results with respect to Yield Strength under different bump loads of 2G,
3G & 4G.
2. If the stress levels are near the Yield Strength, carry out fatigue analysis and calculate cycles to failure under
the following conditions:
a)Using Notch Sensitivity Factor of 1.25
b)Using Notch Sensitivity Factor of 1.5
c)Using Notch Sensitivity Factor of 1.75
3. If the fatigue life <1000 cycles, modify the design as per suggestions and re-run fatigue analysis as above for
Notch Sensitivities of 1.25, 1.5 & 1.75
4. Finalize the modification which meets infinite life criteria of > 1,000,000 cycles
V.LOAD CONDINATIONS
Fig3:load consideration
Reaction at rear side = 698 kg
Reaction on each wheel = 698 / 2 = 349 Kg
Case 1: Bump load 2G = 349 x 2 x 9.81 = 6847.38 N
Case 2: Bump load 3G = 349 x 3 x 9.81 = 10271.07 N
Case 3: Bump Load 4G = 349 x 4 x 9.81 = 13694.76 N
Static Structural Analysis has been carried out for bump loads of 2G, 3G & 4G
VI.STATIC STRUCTURAL ANALYSIS FOR BUMP LOAD OF 2G 3G AND 4G
The max stress location from the analysis corresponds to the crack initiation point in front crack .The comparison is shown
below Stress observed at the end of the weld
• Permissible Yield Stress for Butt and Fillet Welds = 0.60 ~ 0.66 Sy (Reference-page 352 Table 2 of Mechanical Engineering Design by Joseph Edward Shigley)
• Permissible Stress for Gusset =(0.60) 0.66 x 280 = (168) 184 Mpa
• The observed stress of 121.9 MPa is lesser than the allowable stress if 184 Mpa
Static structural analysis for bump load 3G
• Permissible Yield Stress for Butt and Fillet Welds = 0.60 ~ 0.66 Sy (Reference-page 352Table 2 of Mechanical Engineering Design by Joseph Edward Shigley)
• Permissible Stress for Gusset =(0.60) 0.66 x 280 = (168) 184 Mpa
• The observed stress of 183.5 MPa is almost equal to yield limit of 184 Mpa.
• This indicates potential fatigue failure. Hence fatigue analysis needs to be carried out
Static structural analysis for bump load 4G
• Permissible Yield Stress for Butt and Fillet Welds = 0.60 ~ 0.66 Sy (Reference-page 352 Table 2 of Mechanical Engineering Design by Joseph Edward Shigley)
• Permissible Stress for Gusset =(0.60) 0.66 x 280 = (168) 184 Mpa
• The observed stress of 251.7 MPa is higher than the allowable stress of 184 Mpa.
• This indicates static failure at a single application of 4G load
VII.FATIGUE ANALYSIS
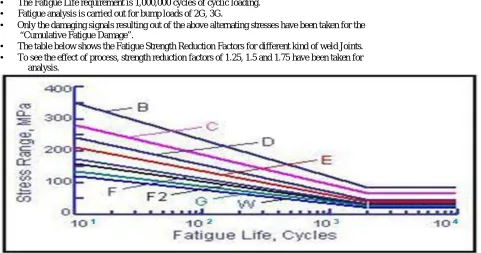
• The Fatigue Life requirement is 1,000,000 cycles of cyclic loading. • Fatigue analysis is carried out for bump loads of 2G, 3G.
• Only the damaging signals resulting out of the above alternating stresses have been taken for the “Cumulative Fatigue Damage”.
• The table below shows the Fatigue Strength Reduction Factors for different kind of weld Joints. • To see the effect of process, strength reduction factors of 1.25, 1.5 and 1.75 have been taken for
analysis.
Fig5:SN curve
• SN curve B indicates fatigue life for cold rolled carbon steel. This curve is used for analysis.
• Fatigue analysis is carried out for stress concentration factor (SCF) of 1.25, 1.5 and 1.75
TABLE 1.1
Bump Load Kf
No. of cycles from analysis (Location – 1)
2G 1.5 269
2G 1.75 68
3G
1.5 10
• The component under study is showing finite life and has to be modified to have an infinite life.
• The Failure follows a sequence – First Failure – Zone 1 Failure Line happens
VIII.FATIGUE ANALYSIS With Stress Concentration Factor = 1.25
• The Fatigue Life requirement is 1,000,000 cycles of cyclic loading.
• Fatigue analysis is carried out for bump loads of 2G, 3G.
• Only the damaging signals resulting out of the above alternating stresses have been taken for the “Cumulative Fatigue Damage”.
• To see the effect of process, strength reduction factor of 1.25 has been taken for analysis
Fig6;SN curve after design modification TABLE1.2:
Bump Load Kf
No. of cycles from analysis
(Location – 1)
2G 1.25 893900
3G
1.25 62010
IX.ANALYSIS APPROACH
• Static analysis with bump loads of 2G, 3G and 4G were carried out on the modified model.
• The analysis results are shown in the following slides.
The von-misses stress =103.458mpa(2G)
The von-misses stress =142.65mpa(3G)
• Permissible Yield Stress for Butt and Fillet Welds = 0.60 ~ 0.66 Sy (Reference-page 352 Table 2 of Mechanical
Engineering Design by Joseph Edward Shigley)
Von misses stress =185.65mpa TABLE:2
Sl. No.
Bump
Observed Stress (MPa)
Allowable Stress
Remarks Load (Mpa)
1 2G 103.45 184 Not failing by yielding in 2G bump load condition
2 3G 142.65 184
Not close to allowable stress but has potential for fatigue
failure
3 4G 185.65 184
Above allowable stress. Indicates static failure for single
X.DESIGN MODIFICATION OF TRAILING ARM
2 The 2nd design modfication incresing the
gusset no
• SN curve B indicates fatigue life for cold rolled carbon steel. This curve is used for analysis.
• Fatigue analysis is carried out for stress concentration factor (SCF) of 1.25, 1.5 and 1.75
XI.CONCLUSION
• The fatigue life observed in the modified model is higher than that of the base model.
• However, to reach fatigue life of 1,000,000 cycles additional modifications have to be carried out on the model.
• The Rate Of Improvements are big in comparison to Original ( 16,000 Kms). This will
• indicate Infinite Life.
• The Modification requires Welding improvement & Extension of Gusset upward –Box
• Further design modification and fouled by analysis is under progressive , will complete with in week
REFERENCES
[1] Satchell, T. L. 1981. The Design of Trailing Twist Axles. SAE810410.
[2] Marsh, A. J. et al. Simulation of the Twist Beam Rear Suspension System Using Flexible Bodies in ADAMS. ADAMS Application Seminar
Textbook. Information Service International-Dentsu, Ltd.
[3] Guyan, R. J. 1965. Reduction of Stiffness and Mass Matrics. AIAA Journal. Vol.3 No.2.
[4] Oden, J. T. 1967. Mechanics of Elastic Structures. McGRAW-HILL BOOK.
[5] Microsoft Corporation. 1998. Microsoft Excel/Visual Basic Reference Second Edition. Microsoft Press
[6] Zhang, S., 1999, ‘‘Approximate Stress Intensity Factors and Notch Stresses for Common Spot-Welded Specimens,’’Weld.J. ~Miami!, 78~5!, pp.
1735–1795.
[7] Zhang, S., 1999, ‘‘Stress Intensities Derived from Stresses Around a Spot Weld,’’ Int. J. Fract., 99, pp. 239–257.
[8] Zhang, S., 1997, ‘‘Stress Intensities at Spot Welds,’’ Int. J. Fract., 88, pp. 167–185.
[9] Wung, P., 2001, ‘‘A Force-Based Failure Criterion for Spot Weld Design,’’ Exp. Mech., 41~4!, pp. 107–113.
[10] Wung, P., Walsh, T., Ourchane, A., Stewart, W., and Jie, M., 2001, ‘‘Failure of Spot Welds Under In-Plane Static Loading,’’ Exp. Mech.,
41~1!, pp. 100–106.
[11] Zuniga, S., and Sheppard, S. D., 1997, ‘‘Resistance Spot Weld Failure Loads and Modes in Overload Conditions,’’Fatigue and Fracture
Mechanics: 27th Volume, ASTM STP 1296, R. S. Piascik, J. C. Newman, and N. E. Dowling, eds., American Society for Testing and Materials, pp.
469–489.
[12] Barkey, M. E., and Kang, H., 1999, ‘‘Testing of Spot Welded Coupons in Combined Tension and Shear,’’ Exp. Tech.,23~5!, pp. 20–22.
[13] Lee, Y., Wehner, T., Lu, M., Morrissett, T., Pakalnins, E., 1998, ‘‘Ultimate Strength of Resistance Spot Welds Subjected to Combined Tension
and Shear,’’ J. Test. Eval., 26~3!, pp. 213–219.
[14] Lin, S. H., Pan, J., Wu, S., Tyan, T., and Wung, P., 2002, ‘‘Failure Loads of Spot Welds under Combined Opening and Shear Static Loading
Conditions,’’ Int. J. Solids Struct., 39, pp. 19–39.
[15] Chao, Y. J., 2002, ‘‘Failure of Spot Weld: A Competition Between Crack Mechanics and Plastic Collapse,’’ RecentAdvances in Experimental