HIGHLIGHTED ARTICLE
| INVESTIGATION
Genetic Dissection of a Supergene Implicates
Tfap2a
in
Craniofacial Evolution of Threespine Sticklebacks
Priscilla A. Erickson, Jiyeon Baek, James C. Hart, Phillip A. Cleves, and Craig T. Miller1 Department of Molecular and Cell Biology, University of California, Berkeley, California 94720 ORCID IDs: 0000-0001-8420-995X (P.A.E.); 0000-0002-6746-5086 (J.B.); 0000-0002-6245-0459 (J.C.H.); 0000-0002-8526-8940 (P.A.C.); 0000-0002-1970-8389 (C.T.M.)
ABSTRACT In nature, multiple adaptive phenotypes often coevolve and can be controlled by tightly linked genetic loci known as supergenes. Dissecting the genetic basis of these linked phenotypes is a major challenge in evolutionary genetics. Multiple freshwater
populations of threespine stickleback fish (Gasterosteus aculeatus) have convergently evolved two constructive craniofacial traits,
longer branchial bones and increased pharyngeal tooth number, likely as adaptations to dietary differences between marine and freshwater environments. Prior QTL mapping showed that both traits are partially controlled by overlapping genomic regions on
chromosome 21 and that a regulatory change inBmp6likely underlies the tooth number QTL. Here, we mapped the branchial bone
length QTL to a 155 kb, eight-gene interval tightly linked to, but excluding the coding regions ofBmp6and containing the candidate
geneTfap2a. Further recombinant mapping revealed this bone length QTL is separable into at least two loci. During embryonic and
larval development, Tfap2a was expressed in the branchial bone primordia, where allele specific expression assays revealed the
freshwater allele ofTfap2awas expressed at lower levels relative to the marine allele in hybridfish. Induced loss-of-function mutations
inTfap2arevealed an essential role in stickleback craniofacial development and show that bone length is sensitive toTfap2adosage in
heterozygotes. Combined, these results suggest that closely linked but genetically separable changes inBmp6andTfap2acontribute
to a supergene underlying evolved skeletal gain in multiple freshwater stickleback populations.
KEYWORDSQTL;fine mapping; skeletal evolution; genome editing; supergene
I
NTRASPECIFIC morphological variation offers the oppor-tunity to dissect the genetic changes that underlie evolution, including adaptation to novel environments. Genetic mapping studies of naturally varying traits can reveal the genomic regions that contribute to evolutionary changes. When mul-tiple phenotypes are controlled by the same region of a genome, a single pleiotropic locus could affect multiple traits, or separate but closely linked genes could affect each trait independently. Clustering of two or more QTL into supergenes is a commonly described feature of evolution (Schwanderet al.2014; Thompson and Jiggins 2014), likely because close linkage of loci allows advantageous combinations of traits to
be inherited together. Supergenes have been shown to con-trol pigmentation patterns in locusts (Nabours 1933); mimetic patterns in butterflies (Joronet al. 2011; Kunte
et al. 2014); color and patterning in snails (Murray and Clarke 1976a,b); social behavior in ants (Wang et al.
2013; Pracana et al.2017); breeding behavior, morphol-ogy, and sperm traits in birds (Thomaset al.2008; Küpper
et al. 2016; Lamichhaneyet al.2016; Tuttle et al.2016; Kimet al.2017); and life history, morphology, and pollina-tion syndromes in plants (Mather 1950; Lowry and Willis 2010; Hermann et al. 2013). The supergenes that have been molecularly characterized to date are often con-trolled by chromosomal inversions with large phenotypic effects. InHeliconiusbutterflies, a supergene in one species was shown to be an inversion containing tightly linked loci that can recombine in other species (Joron et al. 2006, 2011; Nadeau et al.2016). Determining whether cluster-ing of QTL controllcluster-ing different traits is caused by close linkage or pleiotropy requires careful genetic dissection of the genomic intervals of interest.
Copyright © 2018 by the Genetics Society of America
doi:https://doi.org/10.1534/genetics.118.300760
Manuscript received January 26, 2018; accepted for publication March 26, 2018; published Early Online March 28, 2018.
Supplemental material available at Figshare: https://doi.org/10.25386/genetics.
6024338.
1Corresponding author: Department of Molecular and Cell Biology, 142 Life
While QTL for different traits can cluster in the genome, multiple genetic changes affecting a single phenotype can also be clustered within a QTL. Whether a given QTL typically represents an individual locus, or alternatively, multiple tightly linked loci, remains a largely open question in quan-titative genetics. For example, QTL mapping in maize3 teo-sinte crosses has revealed that some large-effect QTL can fractionate (Studer and Doebley 2011), including a QTL that was fractionated into up to five distinct tightly linked loci (Lemmon and Doebley 2014). In contrast, other maize 3 teosinte QTL contain single causative loci (Wang et al.
2005; Hung et al. 2012; Wills et al. 2013). In mice, one QTL controlling pigmentation maps to a single coding muta-tion inMc1r(Steineret al.2007), but a second QTL maps to multiple smaller effect mutations affecting different aspects ofAgoutiexpression (Linnenet al.2013). Interspecific differ-ences in Drosophilapigmentation map, in part, to a single regulatory element oftan(Jeonget al. 2008) and multiple point mutations in a single enhancer ofebony(Rebeizet al.
2009), but differences inDrosophilatrichome patterning are caused by changes in regulatory elements of theshavenbaby
gene that are spread over 50 kb (McGregor et al. 2007; Frankelet al.2011).
Testing whether the same or different genetic changes underlie the evolution of similar phenotypes in multiple lineages may shed light on the predictability and repeatability of evolution (Stern and Orgogozo 2008; Stern 2013; Rosenblumet al.2014). Both theoretical and empirical stud-ies indicate that parallel genetic evolution can occur quite often (Orr 2005; Conteet al.2012). However, given the rel-atively small number of cases where convergently evolved phenotypes have been associated with specific genes, the ex-tent of genetic parallelism remains largely unknown, espe-cially for quantitative traits.
The threespine sticklebackfish has convergently evolved countless freshwater forms from ancestral marine populations and has emerged as a powerful model system for studying both the genetic basis and repeatability of morphological evolution (Peichel and Marques 2017). In freshwater envi-ronments, sticklebacks repeatedly evolve a suite of craniofa-cial and other morphological adaptations to cope with differences in diet, predation, and other environmental var-iables (Bell and Foster 1994). Individuals from different pop-ulations are easily intercrossed to produce large clutches in the laboratory (Peichelet al.2001), the stickleback genome is well assembled and annotated (Joneset al.2012; Glazeret al.
2015), and reverse genetic techniques are available (Erickson
et al.2016a), facilitating both genetic and genomic dissection of the molecular basis of evolved traits.
Marine and freshwater sticklebacks occupy different tro-phic niches: while marinefish feed on small planktonic prey, freshwaterfish typically consume diets of larger macroinver-tebrates (Kislalioglu and Gibson 1977; Gross and Anderson 1984). Sticklebacks process food primarily in the throat, with the branchial skeleton and pharyngeal jaw used to chew and crush food en route to the gut (McGee and Wainwright 2013;
McGeeet al.2013). The branchial skeleton forms in the pos-terior-mostfive pharyngeal arches and consists of segmental homologs of the upper and lower jaw. The branchial skeleton is composed of five bilateral pairs of ventral bones (cerato-branchials), four bilateral pairs of dorsal bones (epibran-chials), and three bilateral pairs of tooth plates (Anker 1974; see Supplemental Material, Figure S1 for anatomy). We described increases in both pharyngeal tooth number and branchial bone length as repeatable and heritable features of freshwater adaptation (Cleves et al. 2014; Erickson et al.
2014; Elliset al.2015). We hypothesize that these increases permit freshwater fish to eat larger prey items via a larger pharyngeal cavity and greater chewing capacity. The first epibranchial (EB1) bone, a serial homolog of the upper jaw, serves as a critical lever for the mastication motion of the pharyngeal jaw (Wainwright 2006) and is the most propor-tionally elongated branchial bone in freshwater sticklebacks (Ericksonet al.2014). The branchial bones are endochondral bones that form from cartilage templates during late embry-onic development (Haines 1934), much like mammalian long bones (Haines 1942). Changes to both the early patterning of cartilage and the relative growth of bones contribute to stick-leback branchial bone length differences (Erickson et al.
2014) and to skeletal evolution in other systems (Farnum
et al.2008a,b; Sangeret al.2011, 2012).
Previous genetic mapping of evolved stickleback skeletal variation has identified .100 QTL controlling a variety of traits, including pharyngeal tooth number and branchial bone length, in the benthic population from Paxton Lake, British Columbia (PAXB). These trophic traits are highly poly-genic, but the QTL controlling skeletal adaptation are signif-icantly clustered into supergenes on three chromosomes, including chromosome 21 (Miller et al. 2014). Although chromosome 21 contains an inversion that typically differs between marine and freshwater populations (Jones et al.
2012), the PAXB pharyngeal tooth number QTL was fi ne-mapped to a genomic region over 1 Mb outside this inversion, to an intronic enhancer of the geneBone morphogenetic protein 6 (Bmp6) (Cleveset al.2014; P. Cleves, J. Hart, R. Agoglia, M. Jimenez, P. Erickson, L. Gai, and C. Miller, unpublished data 2018). Additional work mapped branchial bone length QTL to peaks nearBmp6on chromosome 21 in both PAXB and a stream population from Fishtrap Creek, Washington (FTC) (Erickson
et al.2014). BMP ligands are critical for both tooth and bone development (Balic and Thesleff 2015; Salazaret al.2016), so
Bmp6is an excellent candidate gene for both the tooth number and branchial bone length QTL. However, a second excellent candidate gene for the branchial bone length QTL,Tfap2a, a known regulator of pharyngeal skeletal development (Schorle
et al.1996; Knightet al.2004; Milunskyet al.2008; Tekinet al.
(3) Does convergent evolution of branchial bone gain in two freshwater populations have a similar genetic basis?
Materials and Methods
Animal statement
All animal work was approved by University of California, Berkeley (animal protocol #R330). Fish were reared as pre-viously described (Ericksonet al.2014).
Recombinant mapping and statistical analysis
Fish segregating for the chromosome 21 EB1 length QTL from the PAXB3Little Campbell Marine (LITC) and FTC3LITC crosses (Erickson et al. 2014) were propagated and geno-typed with markers Stn487 (Cleves et al. 2014), PAE309, PAE323, and/or PAE349 (Table S1) to ensure that marine and freshwater alleles of the QTL interval were passed on to each generation and to look for recombination events within the QTL interval. To test the phenotypic effects of recombi-nant chromosomes, recombirecombi-nantfish were crossed to related fish that were either heterozygous for the QTL or homozy-gous for the marine chromosome within the QTL interval. Offspring were grown to 25–28 days postfertilization (dpf) (10–12 mm, FTC cross) or to roughly 80 dpf (20 mm, PAXB cross). These fish were fixed, stained with Alizarin red, cleared, dissected, and photographed, and EB1 bone length was measured as previously described, using ImageJ (Erickson
et al. 2014; Milleret al. 2014; Ellis and Miller 2016). EB1 length was measured on both the left and right side and aver-aged. Bone length was corrected for fish standard length in each clutch separately and residuals of bone length or back-transformed residuals were used for all analyses. Pharyngeal tooth number was counted as described (Cleveset al.2014).
For recombinantfish crossed to heterozygotes, the R pack-agelmtestwas used to perform a likelihood ratio test (lrtest) to determine whether the recombinant chromosome behaved as marine or freshwater. The recombinant chromosome (R) was coded as either (a) a marine (M) or (b) a freshwater (F) chromosome. For (a), the MR and FR genotypes were replaced with MM and MF, respectively, and for (b), they were replaced with MF and FF. The genotypes were then coded numerically with MM = 0, MF = 1, and FF = 2. The
lrtestfunction was used to compare two nested linear models of bone length: the model (bone lengtha + b) was compared to the model (bone lengtha) and to the model (bone length
b). A significant difference between the model containing both possible genotypes and a model containing one possible genotype indicated that the addition of the second genotype significantly improved thefit of the model, and therefore that the second genotype best represented the effect of the recombinant chromosome. For example, a significantP–value in the likelihood ratio test comparing (bone lengtha + b) to (bone lengtha) would indicate that the addition ofb signif-icantly improved the model and therefore that R behaves as F. For recombinant chromosomes crossed to homozygous
marinefish (MM), at-test was used to determine whether the recombinant chromosome behaved like a freshwater chromo-some (i.e., there was a significant increase in bone length be-tween the MM and MR genotypic classes).
Analysis of chromosome 21 QTL in previously published crosses
Genotype data from Glazeret al.(2015) and Ericksonet al.
(2016b) were used to test for the presence of a bone length QTL at the genotype-by-sequencing (GBS) marker containing
Tfap2a(binned marker 16_9) in the LITC3FTC (a different cross than the FTC cross presented here) and LITC3Enos Benthic (ENOB) crosses. Adult bone lengths were measured for 210fish from the three largest families in the Glazeret al.
(2015) study as described above, and processed to correct for size and sex as described in Ericksonet al.(2016b). Processed adult bone lengths for the ENOB3LITC cross were used as reported in Ericksonet al.(2016b).
Genome resequencing and Tfap2a genotyping
A synonymous polymorphism inTfap2awas initially identi-fied by examining the genome sequences of the grandparents of a previously studied LITC3FTC cross (a different cross than the one studied here; Glazeret al.2015) and a PAXB3 LITC cross (the same cross as the one studied here; P. Cleves, J. Hart, R. Agoglia, M. Jimenez, P. Erickson, L. Gai, and C. Miller, unpublished data). This mutation (see Figure S2 for location) disrupts anAvaI cut site and was genotyped by amplifying with PAE414/416 (Table S1) and digesting the PCR product withAvaI; presence of an uncut band indicated presence of the freshwater alternate allele.
Allele-specific expression assay for Tfap2a
We modified a GBS protocol (Elshireet al.2011; Glazeret al.
To prepare cDNA, 4.5 ml RNA was treated with 0.5 ml amplification grade DNase I (Invitrogen, Carlsbad, CA) accord-ing to the manufacturer’s protocol. cDNA was synthesized with Superscript III (Invitrogen), using random hexamers accord-ing to the manufacturer’s protocol but halvaccord-ing all volumes to produce afinal volume of 10ml cDNA. One microliter of cDNA or 50 ng of gDNA from each fish was used as template in separate Phusion PCR reactions with primers PAE414 and PAE416 (Table S1), designed to amplify the synonymous SNP inTfap2aat position chrXXI:4,265,995, which was shared in both the PAXB and FTC cross parents. The 59end of each primer contained anApeKI cut site so that the product could be ligated into the GBS adapters. A titration control was per-formed by mixing marine and freshwater DNA infixed ratios. Technical replicates were performed by (1) amplifying the same gDNA twice, (2) preparing cDNA from the same RNA sample twice, and (3) amplifying from the same cDNA sample twice. All PCR products were purified in a 96-well format by the University of California, Berkeley DNA Sequencing Facility and quantified using a PicoGreen assay (ThermoFisher) on a BioTek Flx800 plate reader.
Up to 25 ng of each purified PCR product was used in the GBS library preparation as previously described (Elshireet al.
2011; Glazer et al. 2015). Briefly, the PCR products were combined with 1.8 ng of barcoded adapters and digested withApeKI (New England BioLabs, Ipswich, MA) for 2 hr at 75°. The adapters were ligated to the PCR products with T4 DNA Ligase (New England BioLabs) for 1 hr at 22°. Then, 5ml of each ligation product was pooled for a PCR purification (Qiagen, Valencia, CA). Sequencing adapters were added with 10 cycles of PCR using Taq 23master mix (New Eng-land BioLabs). The PCR product was cleaned up and size-selected twice with 1.5 vol of Sera-Mag beads prepared as previously described (Rohland and Reich 2012). Six libraries were pooled equally into one Illumina HiSequation 2000 lane and sequenced on 50 bp single-end rapid run mode at the University of California, Berkeley Vincent J. Coates Genomic Sequencing Laboratory. Indexed and barcoded sequences were demultiplexed and aligned to the expected PCR prod-uct sequence to count marine and freshwater alleles at the polymorphic site with the custom script nuc_by_pos.py
(available athttps://github.com/trahsemaj/TFAP2). Sam-ples receiving,300 aligned reads were removed from the analysis (n= 4), as preliminary experiments suggested that at least 300 reads would be required to obtain reliable 1:1 allelic ratios for gDNA PCR products. Outliers.3 SD from the mean were also removed (n= 2). The gDNA and cDNA freshwater/marine ratios were compared at each time point to test for ASE with a Mann–WhitneyU-test using thewilcox. testfunction in R.
Genome editing of Tfap2a
TALENs were generated to target the second exon ofTfap2a
(see Table S2 for RVD design and Figure S2 for binding sites) following established protocols (Cermak et al. 2011; Doyle
et al.2012) and injected into one-cell FTC and LITC stickleback
embryos as previously described (Ericksonet al.2015, 2016a). A subset of injected embryos (n= 10–12) were screened for mutations by amplifying with primers PAE379 and PAE381 (Table S1) in a standard Phusion (New England BioLabs) re-action, digesting the PCR product withPvuII, and running the digested product on a 1% agarose gel. Undigested product of 297 bp indicated molecular lesions that disrupted a PvuII sequence at the expected DNA cleavage site. Clutches carrying lesions were raised to adulthood and outcrossed to wild-type fish. Lesions were sequenced by extracting the undigested PCR band from an agarose gel followed by Sanger sequencing (see Table S3 for lesions studied). F1 fish carrying lesions were propagated for further analysis.
TALEN phenotyping
Tfap2a+/2 heterozygotes were intercrossed to produce
clutches containing homozygous mutants. These larvalfish were euthanized immediately after hatching (9–10 dpf), fixed overnight in 4% paraformaldehyde in 13PBS, stained with Alcian blue, digested with trypsin, mounted in glycerol (Kimmelet al.1998), and imaged on a Leica DM2500 com-pound microscope. For bone length phenotyping, heterozy-gous fish were outcrossed to wild-type laboratory-reared individuals. In the FTC background, a total of 144fish were studied from three families carrying a 16 bp insertion, an 8 bp deletion, and a 10 bp deletion. In LITC, two families totaling 96 fish carrying a 13 bp deletion were studied. Fish were raised to 25–28 dpf and genotyped and phenotyped as de-scribed above. Bone lengths were not back-transformed in this analysis due to different standard length ranges and dif-ferenty-intercepts of the bone lengthstandard length re-gression forfish in different families.
In situ hybridization
In situhybridization forTfap2awas performed on whole em-bryos as previously described (Cleveset al.2014).
Data and reagent availability
Raw data used in this study including genotypes, phenotypes, and ASE counts are available in File S1. Supplemental mate-rial is available at Figshare: https://doi.org/10.25386/ genetics.6024338. All reagents used are available upon re-quest. Custom Python script used for ASE is available at https://github.com/trahsemaj/TFAP2.
Results
Fine mapping the chromosome 21 bone length QTL
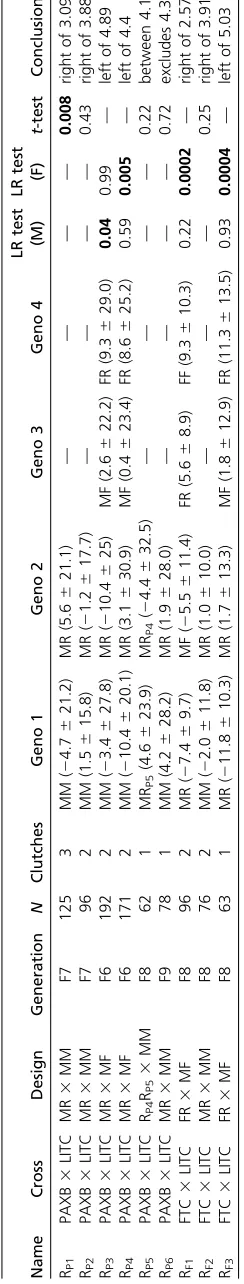
ask whether the recombinant chromosome produced a phenotypic effect significantly more similar to a marine or freshwater chromosome. If the chromosome behaved like a freshwater chromosome (significantly increased branchial bone length relative to a marine chromosome or did not differ from a freshwater chromosome), we con-cluded that the QTL was contained within the freshwater portion of the recombinant chromosome (blue in Figure 1). If the chromosome behaved like a marine chromosome (did not increase branchial bone length relative to a ma-rine chromosome or caused significantly shorter bone length when compared to a freshwater chromosome), we concluded that the QTL was contained within the ma-rine portion (red in Figure 1).
Using this approach, we identified recombinant chromo-somes in each cross with recombination events located within 2 Mb of Bmp6. In the PAXB cross, we identified one recombinant chromosome that separated theBmp6 lo-cus from the region controlling bone length (Figure 1, chro-mosome RP2). This particular recombinant chromosome
significantly increases pharyngeal tooth number (P. Cleves, J. Hart, R. Agoglia, M. Jimenez, P. Erickson, L. Gai, and C. Miller, unpublished data), but did not significantly affect the length of the EB1 bone (Table 1). Therefore, bone length and tooth number are controlled by different genetic loci on chromosome 21 in the PAXB3LITC cross. In the FTC cross, we also found a chromosome that carried a freshwater allele of Bmp6 but did not affect bone length (Figure 1, chromosome RF2and Table 1). We found that this
recombi-nant chromosome increased pharyngeal tooth number rel-ative to a marine chromosome (Figure S3), suggesting that the FTC population also harbors a tooth QTL in a portion of the chromosome containing Bmp6, and like in the PAXB population, the regions controlling tooth number and bone length are genetically separable. The coding sequence of
Bmp6is excluded from the bone length QTL interval in both crosses.
With subsequent fine mapping, we narrowed the QTL interval in the PAXB cross (Figure 1 and Table 1). Notably, a double recombinant chromosome in the PAXB cross (chro-mosome RP5) shows no phenotypic difference from the
orig-inal recombinant chromosome (RP4), which had a strong
effect on bone length (Table 1), suggesting that the fresh-water alleles within the double recombinant region are suf-ficient to increase bone length. A second double recombinant sharing the same 39 breakpoint (recombinant RP6) did not
differ from a marine chromosome, suggesting that this smaller freshwater portion of the chromosome does not carry the bone length QTL. Combined, these two results map the bone length QTL to a 155 kb region (chrXXI:4,200,364–4,355,895) in the PAXB cross, containing eight Ensembl-predicted genes (Tfap2a,Tmem14b,Mak,Plcxd2,Phldb2,Tmem56, ENS-GACG00000002373, and Bco1; Jones et al. 2012. Seven of these eight genes have no described roles in mouse skeletal development (Smithet al.2014). However, one gene, Tran-scription Factor Activating Protein 2 alpha (Tfap2a), is an outstanding candidate for craniofacial evolution because it has roles in patterning the craniofacial skeleton in hu-mans, mice, and zebrafish (Schorleet al.1996; Knightet al.
2004; Milunskyet al.2008), and in regulating the growth and maturation of mammalian chondrocytes (Wenke and Bosserhoff 2010).
Fine mapping the bone length QTL in the FTC cross sup-ported a larger1.1 Mb genomic interval (chrXXI: 3,906,104– 5,003,790 bp; Figure 1 and Table 1), also containingTfap2a. The entire PAXBfine-mapped interval is contained within the FTCfine-mapped interval. Therefore, together these data sup-port a model of a shared genomic basis for branchial bone length gain in these two independently derived freshwater populations.
Fractionation of the QTL in the FTC cross
For one FTC recombinant chromosome, we found evidence of fractionation of the bone length QTL. The breakpoint of this recombinant was within a large (200 kb) gene desert be-tweenBmp6andTfap2a(Figure 2A). We compared the effect of this recombinant chromosome to both marine and fresh-water chromosomes that were nonrecombinant within the QTL region. We found that this recombinant chromosome produced significantly longer bones than a marine chromo-some (Figure 2B); however, it also produced significantly shorter bones than a freshwater chromosome (Figure 2C). These data suggest the recombinant chromosome has effects intermediate between fully marine and freshwater alleles, and the freshwater portion of this chromosome does not re-capitulate the full QTL effect.
Variable presence of the chromosome 21 bone length QTL in freshwater populations
We previously reported a relatively weak EB1 bone length QTL at the far end of chromosome 21 (41.7 cM away fromTfap2a) in a LITC3ENOB cross (Ericksonet al.2016b), but in this cross there is no association between Tfap2a genotype and EB1 length (Figure S4A). Additionally, a LITC3FTC cross with different grandparents than those used in the present study (Glazeret al.2014, 2015) also shows no evidence for a bone length QTL near Tfap2a(Figure S4B). Therefore, while this bone length QTL was identified in two populations, it appears to not be present in all freshwater populations norfixed in the FTC population. These cases where this bone length QTL was not detected could reflect differences in genetic background that mask the penetrance of the QTL, or alternatively, a true absence of the mutation(s) underlying the QTL.
The chromosome 21 QTL affects bone length at stages soon after ossification
Our previousfindings that cartilage template size was larger and bone growth rate was accelerated in the FTC population (Erickson et al. 2014) raised the question of whether the chromosome 21 QTL controlled cartilage development, bone development, or both. To address this question, we raised F5 fish from the FTC3LITC cross to 13 days dpf (a stage when the EB1 cartilage template has formed but not ossi-fied) and 20 dpf (a stage soon after EB1 ossification) to test for an effect of the chromosome 21 QTL on cartilage and bone length. The QTL did not have a significant effect on EB1 cartilage length in a heterozygous3marine backcross at 13 dpf, but had a strong effect on bone length by 20 dpf (Figure S5). Therefore, the chromosome 21 QTL likely has an effect on either initial bone ossification or bone elonga-tion, but does not appear to have a substantial effect on EB1 cartilage template length.
Expression of Tfap2a in developing branchial skeletons
We previously showed thatTfap2ais expressed in undiffer-entiated mesenchymal cells in the dorsal branchial skeletal
primordia prior to epibranchial chondrification, but not in developing teeth (Cleveset al.2014). To further characterize the temporal emergence of this dorsal branchial expression domain, we assayed Tfap2aexpression at earlier stages in development. At 4 dpf,Tfap2awas broadly expressed in post-migratory cranial neural crest in the posterior pharyngeal arches (Figure 3, A and B). By 5 dpf, expression was detected in postmigratory cranial neural crest in the dorsal pharyngeal arches (Figure 3C). At 7 dpf, as previously reported, expres-sion was detected in undifferentiated mesenchymal cells in the dorsal branchial arches, in precisely the future locations of the epibranchial cartilages (Figure 3, D–F). Thus,Tfap2a
expression during craniofacial development is found in the right place and right time to regulate branchial bone development, further supporting Tfap2a as contributing to the branchial bone length QTL. We detected no obvious qualitative differences in expression patterns or levels be-tween marine and freshwater embryos.
Evolved changes in the cis-regulation of Tfap2a
We first tested for coding changes in Tfap2awith genome resequencing data of a FTC grandparent from a previous study (Glazeret al.2015) and the PAXB grandparent used in this study (P. Cleves, J. Hart, R. Agoglia, M. Jimenez, P. Erickson, L. Gai, and C. Miller, unpublished data). We identified a silent mutation shared between PAXB and FTC and an additional silent mutation in PAXB, but no nonsynon-ymous changes. Since no predicted protein coding changes exist in either freshwater population, we next tested forcis -regulatory differences inTfap2a.
We compared the ratios of expressed marine (LITC) and freshwater (PAXB) alleles ofTfap2ain developing branchial skeletal tissue of marine3freshwater hybridfish to look for allele-specific expression (ASE) (Cowleset al.2002; Yanet al.
2002; Wittkopp et al. 2004). We adapted a barcoded
next-generation sequencing assay originally developed for GBS (Elshireet al.2011; Glazeret al.2015) and verified that this assay is capable of detecting a range of allelic ratios de-spite some inherent variability (Figure S6). We tested a series of developmental stages of PAXB3LITC F9 hybrids for ASE ofTfap2a. The earliest stage collected for ASE was hatching (9 dpf), when the branchial skeleton could be accurately dissected. We collected additional time points at 13 and 17 dpf (immediately before ossification of EB1), 22 dpf (im-mediately following ossification of EB1), and 35 dpf (during growth of EB1). We compared the freshwater/marine allelic ratio of RT-PCR products amplified from cDNA to that of PCR products amplified from gDNA controls (which should have a ratio of 1:1 in heterozygousfish). While the observed allelic ratios have a high variance and only one developmental stage showed a significant difference between the gDNA ratio and the cDNA ratio, at every stage the median expression of the freshwater allele was lower than the marine allele (Figure 4). When the data from allfive stages were pooled, the measured freshwater/marine allelic ratio was significantly reduced in cDNA samples relative to gDNA controls (P= 0.001, Mann– Whitney U, Figure 4). Thesefindings reveal thatTfap2ahas evolved cis-regulatory changes and further suggest that
Tfap2amight have an inhibitory role in bone development, as reduction of expression of the freshwater allele ofTfap2ais associated with longer bones.
Tfap2a dosage affects branchial bone length and craniofacial development
Based on the results of thefine mapping and ASE assays, we hypothesized that manipulation ofTfap2alevels could affect branchial bone length. We used TALENs to induce predicted loss-of-function mutations (see Table S3) in Tfap2a in the FTC and LITC genetic backgrounds. We intercrossed stable heterozygous mutants to produce trans-heterozygotes. As
expected based upon the zebrafishTfap2amutant phenotype (Holzschuh et al. 2003; Knight et al. 2003), homozygous mutants with a severe lethal craniofacial phenotype (Figure 5, A and B) were obtained at the expected 25% proportion in each of nine crosses carrying various combinations of the alleles in Table S3. Presence of this phenotype was perfectly concordant with homozygous lesions indicated by loss of a
PvuII cut site (seeMaterials and Methods). Homozygous mu-tantfish were almost entirely lacking a pharyngeal skeleton, while in contrast, the mesodermally derived posterior neuro-cranium was present and well-formed (Figure 5, C and D). The remnants of the pharyngeal skeletal elements were se-verely malformed, often asymmetric, and not identifiable (Figure 5, E and F). The branchial skeleton was particularly hypoplastic, and no identifiable ceratobranchial or epibran-chial cartilages were present. The craniofacial defects were seen in homozygous mutants in both FTC and LITC genetic backgrounds. Consistent with the known roles of Tfap2ain controlling neural crest development and migration (Knight
et al. 2003, 2004), we also observed severe pigmentation defects in homozygous mutants, including reduced melano-phore numbers (Figure 5, G and H). Like the zebrafish lock-jaw mutant (Knight et al. 2004), xanthophores appeared unaffected and iridophores were reduced in homozygous mutantfish (Figure S7).
Because we could not study branchial bone length in homozygous mutants, we outcrossed heterozygotes to wild-typefish to compare bone length in wild-type and heterozy-gous siblings. We grew fish to 4 weeks postfertilization (10 mm standard length, a stage just after the effect of the chromosome 21 branchial bone length QTL could first be detected in the FTC 3 LITC cross) (Erickson et al.
2014). For the Tfap2amutations in the FTC background, we found that EB1 length was slightly but significantly de-creased in heterozygous fish (Figure 6A), while surpris-ingly, the third, fourth, and fifth ceratobranchials (CB3, CB4, and CB5) were slightly but significantly increased (Figure S8). However, in the LITC background, none of the branchial bones measured (CB1–5 and EB1) were sig-nificantly different between wild-type and heterozygous fish (Figure 6B and Figure S8). Although our allele specific expression data predict that reducing Tfap2a function might lead to an increase in branchial bone length, our functional data suggest that halving the dosage ofTfap2a
on a freshwater genetic background can both increase (for ventral posterior ceratobranchials) and decrease (for dorsal EB1) branchial bone length.
Discussion
Genetic dissection of a supergene involved in parallel evolution
Many putatively pleiotropic QTL affecting traits of evolution-ary, economic, and biomedical interest have been discovered (Feitosa et al.2006; Hall et al.2006; Ookawa et al.2010; Stearns 2010; Saatchiet al.2014), but determining whether the underlying causative loci are the same or different re-mains a challenge (Wagner and Zhang 2011; Paaby and Rockman 2013). Using recombinant mapping in two genetic crosses, we show that two separate but tightly linked genes,
Bmp6andTfap2a, form a supergene that increases both the length of bones and the number of teeth in the stickleback branchial skeleton in two freshwater populations. Clustering
of adaptive loci is predicted by population genetic theory when migration occurs between differentially adapted pop-ulations (Yeaman 2013), such as occurs between marine and freshwater adapted sticklebacks (Schluter and Conte 2009; Bell and Aguirre 2013). Migration could maintain close ge-netic linkage of two alleles affecting trophic morphology, which in turn could facilitate rapid adaptation to freshwater diets upon colonization of new habitats. After the causative mutation(s) for both QTL have been determined, testing for linkage disequilibrium of these alleles in wild marine and estuarine populations could test this hypothesis.
While no study has directly tested whether tooth number or bone length are under selection in freshwater stickleback populations, the causative mutations (once found) could be tested for genomic signatures of selection. It is possible that the mutations underlying only one or neither of these phenotypes are under selection, and that they are instead hitchhiking with other adaptive mutations. The bone length QTL is either not fixed in the FTC population or is dependent upon interactions at other loci, and the ENOB population has a tooth number QTL on chromosome 21 (Ericksonet al.2016b) but not a bone length QTL, suggesting that the two elements of this supergene are genetically separable and do not always covary in the wild. The alleles may be maintained at low frequency in marine populations, allowing for repeatable genetic evolution upon
freshwater colonization. Alternatively, genetic and develop-mental constraints may have led to the independent evolution of these craniofacial QTL in multiple populations. The pres-ence and abspres-ence of this bone length QTL could be leveraged in future studies to identify polymorphisms associated with the QTL.
In addition to separating the loci controlling bone length and tooth number, we also separated the bone length QTL into at least two loci in the FTC freshwater population by identifying a single recombinant chromosome with effects that are signifi -cantly different from both marine and freshwater alleles. These data suggest that a portion of the phenotypic effect maps nearer to the coding sequence ofTfap2a, and a portion of the pheno-typic effect is attributable to a large non-coding region be-tween Tfap2a and Bmp6. QTL fractionation has also been observed in a variety of other animal and plant systems (Mackay 2004; Yalcin et al. 2004; Willis-Owen and Flint 2006; Studer and Doebley 2011; Johnson et al. 2012; Linnenet al.2013), suggesting QTL for complex traits might often represent multiple mutations, especially when the un-derlying gene has many roles in development, such asTfap2a.
Tfap2a as a candidate gene for craniofacial evolution
Ourfine mapping and functional results supportTfap2aas a candidate for contributing to craniofacial evolution in sticklebacks.Tfap2awas initially identified as an activating protein that binds the SV40 viral enhancer to promote tran-scription (Williamset al.1988) and has roles in both activat-ing and inhibitactivat-ing gene expression (Mitchell et al. 1987; Williams and Tjian 1991; Gaubatz et al. 1995; Pfisterer
et al.2002; Eckert et al.2005). During vertebrate embryo-genesis, Tfap2a is expressed in a variety of tissues in both mice and zebrafish (Mitchell et al. 1991; Thisse et al.
2001), including the neural crest, an embryonic migratory cell population that gives rise to a variety of tissues, including the pharyngeal skeleton and pigment cells (Bronner and LeDouarin 2012; Mayor and Theveneau 2013). Further stud-ies found a critical role for Tfap2aas a master regulator of neural crest development (de Crozéet al.2011; Rada-Iglesias
et al.2012). Mice and zebrafish with loss-of-function muta-tions have severe craniofacial defects (Schorle et al.1996; Zhang et al. 1996; Holzschuh et al. 2003; Knight et al.
2003, 2004) likely due to Tfap2a’s role in the pharyngeal
ectoderm (Knight et al. 2005). Conditional knockout of
Tfap2a in the frontonasal prominence of mice results in a failure of craniofacial outgrowth during postnatal develop-ment (Nelson and Williams 2004), while conditional knock-out ofTfap2a/bin cranial neural crest cells results in a loss of the jaw hinge and other craniofacial phenotypes (Van Otterloo
et al. 2018). In humans, familial mutations inTfap2a cause branchio-oculo-facial syndrome (Milunsky et al. 2008; Stoetzel et al.2009; Tekinet al.2009). Thus,Tfap2aplays complex roles at multiple stages of craniofacial development in vertebrates, consistent with the possibility ofcis-regulatory changes contributing to evolved branchial bone length differ-ences in freshwater sticklebacks.
Evolved differences in neural crest cell regulation and patterning are hypothesized to underlie craniofacial evolution in primates, birds, and cichlids, as well as the domestication of a variety of mammals (Fishet al.2014; Powderet al.2014; Wilkinset al.2014; Prescottet al.2015). Therefore,Tfap2a
might affect stickleback branchial bone length by altering the early specification and patterning of cranial neural crest cells that eventually form the pharyngeal skeleton. Consistent with this possibility, we observed tissue-restricted expression ofTfap2ain dorsal postmigratory cranial neural crest in de-veloping pharyngeal arches, as well as later in development in the primordia of stickleback branchial bones.Tfap2amight regulate dorsal branchial skeleton morphology by modifying the dorsal–ventral partitioning of cells within the pharyngeal arches. The cis-regulatory differences in freshwater Tfap2a
expression might reflect spatial and/or quantitative changes in Tfap2a expression, which could be tested once Tfap2a
enhancers of craniofacial expression are determined. While conserved regulatory elements of Tfap2a have been de-scribed in mice (Zhang and Williams 2003; Donner and Williams 2006; Feng et al. 2008), an enhancer driving pharyngeal arch neural crest has not been reported. Future genomic sequence comparisons and transgenic assays could identify additional enhancers driving expression in pharyn-geal arch neural crest (including the precursors of the EB1 studied here). In addition to possible changes in pharyngeal arch neural crest regulatory elements, it is also possible that the synonymous change identified here contributes to or even fully explains the observed allelic expression differences through differences in mRNA processing or stability, both of which could also contribute to the observed allele-specific difference in transcript abundance.
In addition to its roles in craniofacial development,Tfap2a
also regulates the differentiation and maintenance of cell types important for skeletal development. Tfap2a mutant mice and chimeric mice have partially penetrant absence of zeugopods and polydactyly (Schorleet al.1996; Zhanget al.
1996; Nottoliet al.1998). During mammalian long bone de-velopment, analogous to fish branchial bone development (Haines 1942), an initial cartilage template for the bone is formed. Osteoblasts then secrete bone matrix surrounding this template, but a region of cartilage cells (chondrocytes) is left behind at either end as a growth plate for further bone elongation (Kronenberg 2003; Hall 2005; Karsenty et al.
2009). TFAP2A protein is expressed in the growth plate of mouse long bones (Davieset al.2002), is thought to regulate a variety of genes related to chondrocyte development (Xie
et al.1998; Tuliet al.2002), and is a negative regulator of chondrocyte differentiation in vitro (Huang et al. 2004).
Figure 6 Heterozygous loss ofTfap2aproduces slightly but significantly shorter EB1 bone length in freshwater, but not marine fish. (A) FTC freshwaterfish (25–28 dpf) heterozygous for predictedTfap2a loss-of-function mutations have significantly shorter first epibranchial (EB1) length relative to wild-type siblings (t-test: t = 1.99, d.f. = 87.1,P = 0.049, asterisk). (B) LITC marine heterozygousTfap2amutantfish have no significant difference in EB1 length compared to wild-type siblings. Additional bone length phenotypes are shown in Figure S8. There was no difference in standard length between +/+ and +/2fish in either popu-lation (P.0.5). EB1 length is size-corrected for standard length; residuals are shown.
Therefore, a downregulation or reduced function ofTfap2ain freshwaterfish might cause an increase in chondrocyte dif-ferentiation, resulting in greater long bone growth. The allele specific expression ofTfap2aseen during early bone devel-opment, combined with the manifestation of the bone length QTL observed in juveniles, suggests that some combination of
Tfap2a’s roles in neural crest development as well as
chon-drocyte differentiation might underlie the evolved increases in bone length. Furthermore, the fractionation of the QTL in the FTC cross suggests that at least two regions surrounding
Tfap2a, and possibly two developmental functions, contrib-ute to the evolved phenotypes.
Surprisingly, the effect ofTfap2amutation was more se-vere in sticklebacks than in zebrafish. While zebrafishlockjaw
mutants still have identifiable pharyngeal cartilage elements in the jaw and branchial skeleton (Knightet al.2003), stick-leback larvae homozygous for Tfap2amutations had only a few severely hypoplastic and unidentifiable pharyngeal skel-etal elements, as well as defects in the anterior neurocra-nium. The remaining chondrocytes appear to be well developed in mutantfish, so the primary craniofacial defect appears to be pharyngeal arch patterning, not cartilage dif-ferentiation. Therefore, compared to zebrafish, sticklebacks may have fewer redundant functions of other genes with
Tfap2aduring craniofacial development.
We found that while induced mutations inTfap2acaused lethal craniofacial defects, heterozygous loss of Tfap2awas sufficient to alter branchial bone length in the FTC freshwater background. Based on our ASE data, we predict that fresh-waterfish likely have lower levels ofTfap2a, so they may be more sensitive to reductions inTfap2afunction than marine fish. FTC fish heterozygous for mutations in Tfap2a had slightly but significantly shorter dorsal (EB1) bones, but sig-nificantly longer ventral (CB5) bones. These opposite results suggest thatTfap2acould play some role in allocating cells to dorsal and ventral pharyngeal elements, but also suggest that branchial skeleton morphology can be sensitive to Tfap2a
dosage in a genetic background-specific manner, perhaps similar to the quantitative craniofacial phenotypes reported in heterozygousTfap2amutant mice (Greenet al.2015). The predicted strong loss-of-function mutations generated by TALENs likely do not fully recapitulatecis-regulatory muta-tions in Tfap2athat occur in nature, which may affect the timing, location, and/or level of gene expression.
Cis-regulatory changes and morphological evolution
Evolution ofcis-regulatory modules is thought to be an impor-tant general feature of morphological evolution (Stern 2000; Carroll 2008). Because developmental regulatory genes are often expressed and required in a wide variety of tissues at time points throughout development, changes to their regula-tion, rather than changes to their coding sequences, may pre-vent deleterious pleiotropic effects. BothTfap2aandBmp6are expressed dynamically in multiple tissues during development (Cleveset al.2014; Ericksonet al.2015 and this study) and can have deleterious and lethal loss-of-function phenotypes
(P. Cleves, J. Hart, R. Agoglia, M. Jimenez, P. Erickson, L. Gai, and C. Miller, unpublished data, and this study). Here, we provide evidence that a subtle regulatory difference in
Tfap2ais associated with evolved skeletal changes related to dietary adaptation, but we cannot exclude the possibility that a long distance regulatory element of another gene outside the eight-gene interval (includingBmp6) could underlie at least part of the QTL effect (Montavon et al.2011; Marini´cet al.
2013; Smallwood and Ren 2013; Anderson and Hill 2014). However, the paralogous tightly linkedTfap2candBmp7genes in mice have been found to be in distinct topologically associ-ating domains, suggesting that their regulatory elements are largely distinct (Tsujimuraet al.2015).
In the stickleback genome (Joneset al.2012; Glazeret al.
2015),Tfap2aandBmp6are separated by a large gene desert that is replete with conserved noncoding sequence. These many putative regulatory elements might provide fodder for
cis-regulatory changes controlling evolved morphological dif-ferences. Regulatory changes to other developmental signaling molecules have also been implicated in stickleback evolution (Colosimo et al. 2005; Miller et al. 2007; Chan et al. 2010; Indjeian et al. 2016; Ishikawa et al. 2017), suggesting that changes to gene regulation may be used tofine-tune develop-mental processes to produce novel and ecologically beneficial phenotypes. Interestingly, our studies indicate evolved increases in both branchial bone length and pharyngeal tooth number in freshwater stickleback are associated withcis-regulatory reduc-tions in expression (Cleveset al.2014). Combined, thesefi nd-ings suggest that evolved gain traits may make“more from less”: constructive morphological phenotypes may commonly evolve from mutations that reduce function and/or expression of genes that repress tissue growth (e.g., inhibit tooth replacement or repress chondrocyte differentiation).
Acknowledgments
We thank Monica Jimenez for assistance in designing the
Tfap2aTALENs, Alyson Smith for assistance in cartilage phe-notyping, and Andrew Glazer for identifying polymorphic indels and for helpful discussions on the ASE assay develop-ment. This work was funded in part by National Institutes of Health (NIH) grant R01 #DE021475 (C.T.M.), NIH pre-doctoral training grants #5T32GM007127 (P.A.E.) and # 5T32HG000047-15 (J.C.H.), and the National Science Foun-dation Graduate Research Fellowship (P.A.C.). Experiments in this study used the Vincent J. Coates Genomics Sequencing Lab-oratory at University of California, Berkeley, supported by NIH S10 instrumentation grants S10RR029668 and S10RR027303.
Literature Cited
Anderson, E., and R. E. Hill, 2014 Long range regulation of the
sonic hedgehoggene. Curr. Opin. Genet. Dev. 27: 54–59.https:// doi.org/10.1016/j.gde.2014.03.011
Balic, A., and I. Thesleff, 2015 Tissue interactions regulating tooth development and renewal, pp. 157–186 inCurrent Topics in Developmental Biology, Craniofacial Development, edited by Y. Chai. Academic Press, New York. https://doi.org/10.1016/ bs.ctdb.2015.07.006
Bell, M. A., and W. E. Aguirre, 2013 Contemporary evolution, allelic recycling, and adaptive radiation of the threespine stick-leback. Evol. Ecol. Res. 15: 377–411.
Bell, M. A., and S. A. Foster, 1994 The Evolutionary Biology of the Threespine Stickleback. Oxford University Press, Oxford, UK.
Bronner, M. E., and N. M. LeDouarin, 2012 Development and
evolution of the neural crest: an overview. Dev. Biol. 366: 2–9.
https://doi.org/10.1016/j.ydbio.2011.12.042
Carroll, S. B., 2008 Evo-eevo and an expanding evolutionary syn-thesis: a genetic theory of morphological evolution. Cell 134:
25–36.https://doi.org/10.1016/j.cell.2008.06.030
Cermak, T., E. L. Doyle, M. Christian, L. Wang, Y. Zhang et al.,
2011 Efficient design and assembly of custom TALEN and
other TAL effector-based constructs for DNA targeting. Nucleic Acids Res. 39: e82.https://doi.org/10.1093/nar/gkr218
Chan, Y. F., M. E. Marks, F. C. Jones, G. Villarreal, M. D. Shapiro
et al., 2010 Adaptive evolution of pelvic reduction in stickle-backs by recurrent deletion of a Pitx1 enhancer. Science 327:
302–305.https://doi.org/10.1126/science.1182213
Cleves, P. A., N. A. Ellis, M. T. Jimenez, S. M. Nunez, D. Schluter
et al., 2014 Evolved tooth gain in sticklebacks is associated with a cis-regulatory allele ofBmp6. Proc. Natl. Acad. Sci. USA 111: 13912–13917.https://doi.org/10.1073/pnas.1407567111
Colosimo, P. F., K. E. Hosemann, S. Balabhadra, G. Villarreal, M. Dickson et al., 2005 Widespread parallel evolution in sticklebacks by repeatedfixation ofEctodysplasinalleles. Science 307: 1928–1933.https://doi.org/10.1126/science.1107239
Conte, G. L., M. E. Arnegard, C. L. Peichel, and D. Schluter, 2012 The probability of genetic parallelism and convergence in natural populations. Proc. R. Soc. Lond. B Biol. Sci. 279: 5039–5047.https://doi.org/10.1098/rspb.2012.2146
Cowles, C. R., J. N. Hirschhorn, D. Altshuler, and E. S. Lander, 2002 Detection of regulatory variation in mouse genes. Nat. Genet. 32: 432–437.https://doi.org/10.1038/ng992
Davies, S. R., S. Sakano, Y. Zhu, and L. J. Sandell, 2002 Distribution of the transcription factors Sox9, AP-2, and [delta]EF1 in adult murine articular and meniscal cartilage and growth plate. J. Histochem. Cytochem. 50: 1059–1065. https://doi.org/ 10.1177/002215540205000808
de Crozé, N., F. Maczkowiak, and A. H. Monsoro-Burq, 2011 Reiterative AP2a activity controls sequential steps in the neural crest gene regulatory network. Proc. Natl. Acad. Sci. USA 108: 155–160.https://doi.org/10.1073/pnas.1010740107
Donner, A. L., and T. Williams, 2006 Frontal nasal prominence expression driven byTcfap2arelies on a conserved binding site for STAT proteins. Dev. Dyn. 235: 1358–1370.https://doi.org/ 10.1002/dvdy.20722
Doyle, E. L., N. J. Booher, D. S. Standage, D. F. Voytas, V. P. Brendel
et al., 2012 TAL effector-nucleotide targeter (TALE-NT) 2.0: tools for TAL effector design and target prediction. Nucleic Acids Res. 40: W117–W122.https://doi.org/10.1093/nar/gks608
Eckert, D., S. Buhl, S. Weber, R. Jäger, and H. Schorle, 2005 The AP-2 family of transcription factors. Genome Biol. 6: 246.
https://doi.org/10.1186/gb-2005-6-13-246
Ellis, N. A., and C. T. Miller, 2016 Dissection andflat-mounting of the threespine stickleback branchial skeleton. J. Vis. Exp. (111): e54056. Ellis, N. A., A. M. Glazer, N. N. Donde, P. A. Cleves, R. M. Agoglia
et al., 2015 Distinct developmental and genetic mechanisms underlie convergently evolved tooth gain in sticklebacks. Devel-opment 142: 2442–2451.https://doi.org/10.1242/dev.124248
Elshire, R. J., J. C. Glaubitz, Q. Sun, J. A. Poland, K. Kawamoto
et al., 2011 A robust, simple genotyping-by-sequencing (GBS)
approach for high diversity species. PLoS One 6: e19379.
https://doi.org/10.1371/journal.pone.0019379
Erickson, P. A., A. M. Glazer, P. A. Cleves, A. S. Smith, and C. T. Miller, 2014 Two developmentally temporal quantitative trait loci underlie convergent evolution of increased branchial bone length in sticklebacks. Proc. R. Soc. Lond. B Biol. Sci. 281: 20140822.https://doi.org/10.1098/rspb.2014.0822
Erickson, P. A., P. A. Cleves, N. A. Ellis, K. T. Schwalbach, J. C. Hart
et al., 2015 A 190 base pair, TGF-bresponsive tooth andfin enhancer is required for sticklebackBmp6expression. Dev. Biol. 401: 310–323.https://doi.org/10.1016/j.ydbio.2015.02.006
Erickson, P. A., N. A. Ellis, and C. T. Miller, 2016a Microinjection for transgenesis and genome editing in threespine sticklebacks. J. Vis. Exp. (111): e54055.
Erickson, P. A., A. M. Glazer, E. E. Killingbeck, R. M. Agoglia, J. Baeket al., 2016b Partially repeatable genetic basis of benthic adaptation in threespine sticklebacks. Evolution 70: 887–902.
https://doi.org/10.1111/evo.12897
Farnum, C. E., M. Tinsley, and J. W. Hermanson, 2008a Postnatal bone elongation of the manusvs.pes: analysis of the chondrocytic differentiation cascade inMus musculusandEptesicus fuscus. Cells Tissues Organs 187: 48–58.https://doi.org/10.1159/000109963
Farnum, C. E., M. Tinsley, and J. W. Hermanson, 2008b Forelimb
vs.hindlimb skeletal development in the big brown bat, Eptesi-cus fusEptesi-cus: functional divergence is reflected in chondrocytic performance in autopodial growth plates. Cells Tissues Organs 187: 35–47.https://doi.org/10.1159/000109962
Feitosa, M. F., T. Rice, K. E. North, A. Kraja, T. Rankinen et al., 2006 Pleiotropic QTL on chromosome 19q13 for triglycerides and adiposity: the HERITAGE family study. Atherosclerosis 185:
426–432.https://doi.org/10.1016/j.atherosclerosis.2005.06.023
Feng, W., J. Huang, J. Zhang, and T. Williams, 2008 Identification and analysis of a conservedTcfap2a intronic enhancer element required for expression in facial and limb bud mesenchyme. Mol. Cell. Biol. 28: 315–325.https://doi.org/10.1128/MCB.01168-07
Fish, J. L., R. S. Sklar, K. C. Woronowicz, and R. A. Schneider,
2014 Multiple developmental mechanisms regulate
species-specific jaw size. Development 141: 674–684.https://doi.org/ 10.1242/dev.100107
Frankel, N., D. F. Erezyilmaz, A. P. McGregor, S. Wang, F. Payre
et al., 2011 Morphological evolution caused by many subtle-effect substitutions in regulatory DNA. Nature 474: 598–603.
https://doi.org/10.1038/nature10200
Gaubatz, S., A. Imhof, R. Dosch, O. Werner, P. Mitchell et al., 1995 Transcriptional activation by Myc is under negative con-trol by the transcription factor AP-2. EMBO J. 14: 1508–1519. Glazer, A. M., P. A. Cleves, P. A. Erickson, A. Y. Lam, and C. T.
Miller, 2014 Parallel developmental genetic features underlie stickleback gill raker evolution. Evodevo 5: 19.https://doi.org/ 10.1186/2041-9139-5-19
Glazer, A. M., E. E. Killingbeck, T. Mitros, D. S. Rokhsar, and C. T.
Miller, 2015 Genome assembly improvement and mapping
convergently evolved skeletal traits in sticklebacks with geno-typing-by-sequencing. G3 5: 1463–1472. https://doi.org/ 10.1534/g3.115.017905
Green, M. R., and J. Sambrook, 2012 Molecular Cloning : A Laboratory Manual. Cold Spring Harbor Laboratory Press, Cold Spring Harbor, NY.
Green, R. M., W. Feng, T. Phang, J. L. Fish, H. Li et al.,
2015 Tfap2a-dependent changes in mouse facial morphology result in clefting that can be ameliorated by a reduction inFgf8
gene dosage. Dis. Model. Mech. 8: 31–43. https://doi.org/ 10.1242/dmm.017616
Haines, R. W., 1934 Epiphyseal growth in the branchial skeleton offishes. Q. J. Microsc. Sci. 77: 77–97.
Haines, R. W., 1942 The evolution of epiphyses and of endochon-dral bone. Biol. Rev. Camb. Philos. Soc. 17: 267–292.https:// doi.org/10.1111/j.1469-185X.1942.tb00440.x
Hall, B. K., 2005 Bones and Cartilage: Developmental and Evolu-tionary Skeletal Biology. Academic Press, London.
Hall, M. C., C. J. Basten, and J. H. Willis, 2006 Pleiotropic quan-titative trait loci contribute to population divergence in traits as-sociated with life-history variation inMimulus guttatus. Genetics 172: 1829–1844.https://doi.org/10.1534/genetics.105.051227
Hermann, K., U. Klahre, M. Moser, H. Sheehan, T. Mandel et al., 2013 Tight genetic linkage of prezygotic barrier loci creates a multifunctional speciation island inPetunia. Curr. Biol. 23: 873–
877.https://doi.org/10.1016/j.cub.2013.03.069
Holzschuh, J., A. Barrallo-Gimeno, A.-K. Ettl, K. Durr, E. W. Knapik
et al., 2003 Noradrenergic neurons in the zebrafish hindbrain are induced by retinoic acid and requiretfap2afor expression of
the neurotransmitter phenotype. Development 130: 5741–
5754.https://doi.org/10.1242/dev.00816
Huang, Z., H. Xu, and L. Sandell, 2004 Negative regulation of chondrocyte differentiation by transcription factor AP-2alpha. J. Bone Miner. Res. 19: 245–255. https://doi.org/10.1359/ jbmr.2004.19.2.245
Hung, H.-Y., L. M. Shannon, F. Tian, P. J. Bradbury, C. Chenet al., 2012 ZmCCTand the genetic basis of day-length adaptation underlying the postdomestication spread of maize. Proc. Natl. Acad. Sci. USA 109: E1913–E1921. https://doi.org/10.1073/ pnas.1203189109
Indjeian, V. B., G. A. Kingman, F. C. Jones, C. A. Guenther, J. Grimwood
et al., 2016 Evolving new skeletal traits bycis-regulatory changes in Bone Morphogenetic Proteins. Cell 164: 45–56.https://doi.org/ 10.1016/j.cell.2015.12.007
Ishikawa, A., M. Kusakabe, K. Yoshida, M. Ravinet, T. Makinoet al., 2017 Different contributions of local- and distant-regulatory changes to transcriptome divergence between stickleback eco-types. Evolution 71: 565–581. https://doi.org/10.1111/evo. 13175
Jeong, S., M. Rebeiz, P. Andolfatto, T. Werner, J. True et al., 2008 The evolution of gene regulation underlies a morpholog-ical difference between twoDrosophilasister species. Cell 132:
783–793.https://doi.org/10.1016/j.cell.2008.01.014
Johnson, E. B., J. E. Haggard, and D. A. St.Clair, 2012 Fractionation, stability, and isolate-specificity of QTL for resistance to Phytoph-thora infestansin cultivated tomato (Solanum lycopersicum). G3 2: 1145–1159.https://doi.org/10.1534/g3.112.003459
Jones, F. C., M. G. Grabherr, Y. F. Chan, P. Russell, E. Mauceliet al., 2012 The genomic basis of adaptive evolution in threespine sticklebacks. Nature 484: 55–61. https://doi.org/10.1038/na-ture10944
Joron, M., R. Papa, M. Beltrán, N. Chamberlain, J. Mavárezet al., 2006 A conserved supergene locus controls colour pattern di-versity inHeliconiusbutterflies. PLoS Biol. 4: e303.https://doi. org/10.1371/journal.pbio.0040303
Joron, M., L. Frezal, R. T. Jones, N. L. Chamberlain, S. F. Leeet al.,
2011 Chromosomal rearrangements maintain a polymorphic
supergene controlling butterfly mimicry. Nature 477: 203–206.
https://doi.org/10.1038/nature10341
Karsenty, G., H. M. Kronenberg, and C. Settembre, 2009 Genetic control of bone formation. Annu. Rev. Cell Dev. Biol. 25: 629–
648.https://doi.org/10.1146/annurev.cellbio.042308.113308
Kim, K.-W., C. Bennison, N. Hemmings, L. Brookes, L. L. Hurley
et al., 2017 A sex-linked supergene controls sperm morphol-ogy and swimming speed in a songbird. Nat. Ecol. Evol. 1: 1168–1176.https://doi.org/10.1038/s41559-017-0235-2
Kimmel, C. B., C. T. Miller, G. Kruze, B. Ullmann, R. A. BreMiller
et al., 1998 The shaping of pharyngeal cartilages during early
development of the zebrafish. Dev. Biol. 203: 245–263.https:// doi.org/10.1006/dbio.1998.9016
Kislalioglu, M., and R. N. Gibson, 1977 The feeding relationship of shallow waterfishes in a Scottish sea loch. J. Fish Biol. 11: 257–
266.https://doi.org/10.1111/j.1095-8649.1977.tb04118.x
Knight, R. D., S. Nair, S. S. Nelson, A. Afshar, Y. Javidan et al., 2003 lockjaw encodes a zebrafish tfap2a required for early
neural crest development. Development 130: 5755–5768.
https://doi.org/10.1242/dev.00575
Knight, R. D., Y. Javidan, S. Nelson, T. Zhang, and T. Schilling, 2004 Skeletal and pigment cell defects in thelockjawmutant reveal multiple roles for zebrafishtfap2ain neural crest develop-ment. Dev. Dyn. 229: 87–98.https://doi.org/10.1002/dvdy.10494
Knight, R. D., Y. Javidan, T. Zhang, S. Nelson, and T. F. Schilling, 2005 AP2-dependent signals from the ectoderm regulate cra-niofacial development in the zebrafish embryo. Development 132: 3127–3138.https://doi.org/10.1242/dev.01879
Kronenberg, H. M., 2003 Developmental regulation of the growth
plate. Nature 423: 332–336. https://doi.org/10.1038/
nature01657
Kunte, K., W. Zhang, A. Tenger-Trolander, D. H. Palmer, A. Martin
et al., 2014 Doublesex is a mimicry supergene. Nature 507:
229–232.https://doi.org/10.1038/nature13112
Küpper, C., M. Stocks, J. E. Risse, N. dos Remedios, L. L. Farrell
et al., 2016 A supergene determines highly divergent male reproductive morphs in the ruff. Nat. Genet. 48: 79–83.
https://doi.org/10.1038/ng.3443
Lamichhaney, S., G. Fan, F. Widemo, U. Gunnarsson, D. S. Thalmann
et al., 2016 Structural genomic changes underlie alternative reproductive strategies in the ruff (Philomachus pugnax). Nat. Genet. 48: 84–88.https://doi.org/10.1038/ng.3430
Lemmon, Z. H., and J. F. Doebley, 2014 Genetic dissection of a genomic region with pleiotropic effects on domestication traits in maize reveals multiple linked QTL. Genetics 198: 345–353.
https://doi.org/10.1534/genetics.114.165845
Linnen, C. R., Y.-P. Poh, B. K. Peterson, R. D. H. Barrett, J. G. Larson
et al., 2013 Adaptive evolution of multiple traits through mul-tiple mutations at a single gene. Science 339: 1312–1316.
https://doi.org/10.1126/science.1233213
Lowry, D. B., and J. H. Willis, 2010 A widespread chromosomal inversion polymorphism contributes to a major life-history tran-sition, local adaptation, and reproductive isolation. PLoS Biol. 8: e1000500 (erratum: PLoS Biol. 10 (2012)). https://doi.org/ 10.1371/journal.pbio.1000500
Mackay, T. F., 2004 The genetic architecture of quantitative traits: lessons fromDrosophila. Curr. Opin. Genet. Dev. 14: 253–257.
https://doi.org/10.1016/j.gde.2004.04.003
Marini´c, M., T. Aktas, S. Ruf, and F. Spitz, 2013 An integrated holo-enhancer unit defines tissue and gene specificity of theFgf8
regulatory landscape. Dev. Cell 24: 530–542.https://doi.org/ 10.1016/j.devcel.2013.01.025
Mather, K., 1950 The genetical architecture of heterostyly in
Primula sinensis. Evolution 4: 340–352. https://doi.org/ 10.1111/j.1558-5646.1950.tb01404.x
Mayor, R., and E. Theveneau, 2013 The neural crest. Develop-ment 140: 2247–2251.https://doi.org/10.1242/dev.091751
McGee, M. D., and P. C. Wainwright, 2013 Convergent evolution as a generator of phenotypic diversity in threespine stickleback. Evolution 67: 1204–1208. https://doi.org/10.1111/j.1558-5646.2012.01839.x
McGee, M. D., D. Schluter, and P. C. Wainwright, 2013 Functional basis of ecological divergence in sympatric stickleback. BMC Evol. Biol. 13: 277.https://doi.org/10.1186/1471-2148-13-277
McGregor, A. P., V. Orgogozo, I. Delon, J. Zanet, D. G. Srinivasan
et al., 2007 Morphological evolution through multiple cis -regulatory mutations at a single gene. Nature 448: 587–590.
Miller, C. T., S. Beleza, A. A. Pollen, D. Schluter, R. A. Kittleset al., 2007 cis-regulatory changes inKit ligandexpression and par-allel evolution of pigmentation in sticklebacks and humans. Cell 131: 1179–1189.https://doi.org/10.1016/j.cell.2007.10.055
Miller, C. T., A. M. Glazer, B. R. Summers, B. K. Blackman, A. R. Normanet al., 2014 Modular skeletal evolution in sticklebacks is controlled by additive and clustered quantitative trait loci. Genet-ics 197: 405–420.https://doi.org/10.1534/genetics.114.162420
Milunsky, J. M., T. A. Maher, G. Zhao, A. E. Roberts, H. J. Stalker
et al., 2008 TFAP2Amutations result in branchio-oculo-facial syndrome. Am. J. Hum. Genet. 82: 1171–1177.https://doi.org/ 10.1016/j.ajhg.2008.03.005
Mitchell, P. J., C. Wang, and R. Tjian, 1987 Positive and negative regulation of transcription in vitro: enhancer-binding protein
AP-2 is inhibited by SV40 T antigen. Cell 50: 847–861.
https://doi.org/10.1016/0092-8674(87)90512-5
Mitchell, P. J., P. M. Timmons, J. M. Hébert, P. W. Rigby, and
R. Tjian, 1991 Transcription factor AP-2 is expressed in
neural crest cell lineages during mouse embryogenesis. Genes Dev. 5: 105–119.https://doi.org/10.1101/gad.5.1.105
Montavon, T., N. Soshnikova, B. Mascrez, E. Joye, L. Thevenet
et al., 2011 A regulatory archipelago controlsHoxgenes tran-scription in digits. Cell 147: 1132–1145. https://doi.org/ 10.1016/j.cell.2011.10.023
Murray, J., and B. Clarke, 1976a Supergenes in polymorphic land snails. II.Partula suturalis. Heredity 37: 271–282. https://doi. org/10.1038/hdy.1976.87
Murray, J., and B. Clarke, 1976b Supergenes in polymorphic land snails. I. Partula taeniata. Heredity 37: 253–269. https://doi. org/10.1038/hdy.1976.86
Nabours, R. K., 1933 Inheritance of color patterns in the grouse locust
Acrydium arenosumburmeister (Tettigidae). Genetics 18: 159–171. Nadeau, N. J., C. Pardo-Diaz, A. Whibley, M. A. Supple, S. V. Saenkoet al., 2016 The genecortexcontrols mimicry and cryp-sis in butterflies and moths. Nature 534: 106–110.https://doi. org/10.1038/nature17961
Nelson, D. K., and T. Williams, 2004 Frontonasal process-specific disruption ofAP-2alpharesults in postnatal midfacial hypopla-sia, vascular anomalies, and nasal cavity defects. Dev. Biol. 267:
72–92.https://doi.org/10.1016/j.ydbio.2003.10.033
Nottoli, T., S. Hagopian-Donaldson, J. Zhang, A. Perkins, and T. Williams, 1998 AP-2-null cells disrupt morphogenesis of the eye, face, and limbs in chimeric mice. Proc. Natl. Acad. Sci. USA 95: 13714–13719.https://doi.org/10.1073/pnas.95.23.13714
Ookawa, T., T. Hobo, M. Yano, K. Murata, T. Ando et al.,
2010 New approach for rice improvement using a pleiotropic QTL gene for lodging resistance and yield. Nat. Commun. 1:
132.https://doi.org/10.1038/ncomms1132
Orr, H. A., 2005 The probability of parallel evolution. Evolution 59:
216–220.https://doi.org/10.1111/j.0014-3820.2005.tb00907.x
Paaby, A. B., and M. V. Rockman, 2013 The many faces of pleiot-ropy. Trends Genet. 29: 66–73. https://doi.org/10.1016/j. tig.2012.10.010
Peichel, C. L., and D. A. Marques, 2017 The genetic and molecu-lar architecture of phenotypic diversity in sticklebacks. Philos. Trans. R. Soc. Lond. B Biol. Sci. 372: 20150486.
Peichel, C. L., K. S. Nereng, K. A. Ohgi, B. L. E. Cole, P. F. Colosimo
et al., 2001 The genetic architecture of divergence between threespine stickleback species. Nature 414: 901–905. https:// doi.org/10.1038/414901a
Pfisterer, P., J. Ehlermann, M. Hegen, and H. Schorle, 2002 A subtractive gene expression screen suggests a role of transcrip-tion factor AP-2ain control of proliferation and differentiation. J. Biol. Chem. 277: 6637–6644. https://doi.org/10.1074/jbc. M108578200
Powder, K. E., H. Cousin, G. P. McLinden, and R. C. Albertson, 2014 A nonsynonymous mutation in the transcriptional
regu-latorlbhis associated with cichlid craniofacial adaptation and neural crest cell development. Mol. Biol. Evol. 31: 3113–3124.
https://doi.org/10.1093/molbev/msu267
Pracana, R., A. Priyam, I. Levantis, R. A. Nichols, and Y. Wurm,
2017 The fire ant social chromosome supergene variant Sb
shows low diversity but high divergence from SB. Mol. Ecol. 26: 2864–2879.https://doi.org/10.1111/mec.14054
Prescott, S. L., R. Srinivasan, M. C. Marchetto, I. Grishina, I. Nar-vaizaet al., 2015 Enhancer divergence andcis-regulatory evo-lution in the human and chimp neural crest. Cell 163: 68–83.
https://doi.org/10.1016/j.cell.2015.08.036
Rada-Iglesias, A., R. Bajpai, S. Prescott, S. A. Brugmann, T. Swigut
et al., 2012 Epigenomic annotation of enhancers predicts tran-scriptional regulators of human neural crest. Cell Stem Cell 11:
633–648.https://doi.org/10.1016/j.stem.2012.07.006
Rebeiz, M., J. E. Pool, V. A. Kassner, C. F. Aquadro, and S. B. Carroll, 2009 Stepwise modification of a modular enhancer underlies adaptation in aDrosophilapopulation. Science 326: 1663–1667.
https://doi.org/10.1126/science.1178357
Rohland, N., and D. Reich, 2012 Cost-effective, high-throughput DNA sequencing libraries for multiplexed target capture. Genome Res. 22: 939–946.https://doi.org/10.1101/gr.128124.111
Rosenblum, E. B., C. E. Parent, and E. E. Brandt, 2014 The molecular basis of phenotypic convergence. Annu. Rev. Ecol. Evol. Syst. 45:
203–226.https://doi.org/10.1146/annurev-ecolsys-120213-091851
Saatchi, M., R. D. Schnabel, J. F. Taylor, and D. J. Garrick, 2014 Large-effect pleiotropic or closely linked QTL segregate within and across ten US cattle breeds. BMC Genomics 15: 442.
https://doi.org/10.1186/1471-2164-15-442
Salazar, V. S., L. W. Gamer, and V. Rosen, 2016 BMP signalling in skeletal development, disease and repair. Nat. Rev. Endocrinol. 12: 203–221.https://doi.org/10.1038/nrendo.2016.12
Sanger, T. J., E. A. Norgard, L. S. Pletscher, M. Bevilacqua, V. R. Brookset al., 2011 Developmental and genetic origins of mu-rine long bone length variation. J. Exp. Zoolog. B Mol. Dev. Evol. 316B: 146–161.https://doi.org/10.1002/jez.b.21388
Sanger, T. J., L. J. Revell, J. J. Gibson-Brown, and J. B. Losos, 2012 Repeated modification of early limb morphogenesis pro-grammes underlies the convergence of relative limb length in
Anolis lizards. Proc. Biol. Sci. 279: 739–748. https://doi.org/ 10.1098/rspb.2011.0840
Schluter, D., and G. L. Conte, 2009 Genetics and ecological spe-ciation. Proc. Natl. Acad. Sci. USA 106(Suppl. 1): 9955–9962.
https://doi.org/10.1073/pnas.0901264106
Schorle, H., P. Meier, M. Buchert, R. Jaenisch, and P. J. Mitchell, 1996 Transcription factor AP-2 essential for cranial closure and craniofacial development. Nature 381: 235–238. https:// doi.org/10.1038/381235a0
Schwander, T., R. Libbrecht, and L. Keller, 2014 Supergenes and complex phenotypes. Curr. Biol. 24: R288–R294. https://doi. org/10.1016/j.cub.2014.01.056
Smallwood, A., and B. Ren, 2013 Genome organization and long-range regulation of gene expression by enhancers. Curr. Opin. Cell Biol. 25: 387–394.https://doi.org/10.1016/j.ceb.2013.02.005
Smith, C. M., J. H. Finger, T. F. Hayamizu, I. J. McCright, J. Xu
et al., 2014 The mouse Gene Expression Database (GXD): 2014 update. Nucleic Acids Res. 42: D818–D824.
Stearns, F. W., 2010 One hundred years of pleiotropy: a retro-spective. Genetics 186: 767–773. https://doi.org/10.1534/ genetics.110.122549
Steiner, C. C., J. N. Weber, and H. E. Hoekstra, 2007 Adaptive variation in beach mice produced by two interacting pigmenta-tion genes. PLoS Biol. 5: e219 (erratum: PLoS Biol. 6: e36).
https://doi.org/10.1371/journal.pbio.0050219
Stern, D. L., 2000 Perspective: evolutionary developmental biol-ogy and the problem of variation. Evolution 54: 1079–1091.