ABSTRACT
POP, CRISTINA. The influence of dimer interface mutations upon the folding and activity of procaspase-3. (Under the direction of Dr. A. Clay Clark)
Procaspase-3 is the dimeric precursor of the apoptosis-executioner caspase-3 that displays little activity in vitro. The interface of the procaspase-3 dimer plays a critical role in zymogen maturation, although the active sites are not located at the dimer interface. We show that replacement of valine 266, the residue at the center of the procaspase-3 dimer interface, with arginine or glutamate results in an increase in enzyme activity of about 25-60-fold,
show that the V266E mutant is a kinetic trap of procaspase-3, while the V266H mutant is remarkably more resistant to chemical denaturation than procaspase-3.
THE INFLUENCE OF DIMER INTERFACE MUTATIONS UPON THE FOLDING AND ACTIVITY OF PROCASPASE-3
A Dissertation
by
Cristina Pop
Submitted to the Graduate Faculty of North Carolina State University in partial
fulfillment of the requirements for the Degree of Doctor of Philosophy
March 2004
Major subject: Biochemistry
APPROVED BY
__________________________ _________________________
Dr. A. Clay Clark Dr. Carla Mattos
(CHAIR OF ADVISORY COMMITTEE)
__________________________ __________________________
DEDICATION
BIOGRAPHY
Cristina Pop grew up in Hateg, Romania, in a small town surrounded by beautiful
mountains. She attended University of Bucharest, Romania, in 1992. She
graduated from Faculty of Biology in 1997 with a degree in Biochemistry. In 1998
she received a Masters of Science degree from the University of Bucharest in
Molecular Biology. In 1999 she moved to Belgium, where she received training in
Biochemistry at Katholieke Universiteit Leuven. In August 1999, she joined the
PhD program in Molecular and Structural Biochemistry at North Carolina State
University, working under Dr. A. Clay Clark’s supervision. Her work was focused
on the influence of the dimer interface mutations upon the folding and activity of
procaspase-3. Starting June 1st 2004, she will join Dr. Guy Salvesen’s laboratory at the Burhnam Institute, San Diego, CA. She is interested in pursuing a career in
ACKNOWLEDGEMENTS
I would like to thank Dr. A. Clay Clark, my adviser, for teaching me
structural biochemistry and protein folding. I appreciate his excellent guidance
and supervision during my doctorate studies, as well as his generosity, kindness,
friendship and understanding shown during the years.
I also thank my committee members: Dr. Linda Hanley-Bowdoin, for the
flawless scientific suggestions, constructive criticism, and professional advices;
Dr. Carla Mattos, for the scientific enthusiasm, friendship, passion for career
advancement, and the collaboration work on caspase structure; Dr. Robert Kelly,
for the promptness in suggesting ideas, and excellent teaching skills.
I owe my accomplishments in laboratory to Brett Feneey, lab manager and
best friend, who carried out the molecular cloning, size exclusion
chromatography, and fluorescence experiments, and helped with protein
purification. I am thankful for the altruistic companionship, exceptional
enthusiasm, creative ideas and persistence in completing the hardest projects
shown during the year.
I thank Dr. Ashutosh Tripathy from UNC, Chapel Hill, for help with
analytical centrifugation experiments, Dr. Raquel Hernandez for help with cell
cultures and numerous suggestions, and Dr. Dennis T. Brown for his constant
generosity.
Thanks Erin Shiver, Thora McLean and Randy Durren for the help with
I acknowledge my friends Justin Stern, Sara Milam, Sean Casey, Vesna
de Serrano, Ruby Chen, and Kakoli Bose for the good time and the interesting
discussions in the lab.
I would also like to thank Ela Dragomir. She was my first Inorganic
Chemistry teacher who inspired my original passion for Chemistry and heartily
TABLE OF CONTENTS
Page
1. LIST OF TABLES………..……....xii
2. LIST OF FIGURES…..………...xiii
3. INTRODUCTION……….…1
• Apoptotic pathways……….…1
• Caspases in apoptosis………...4
• Caspase structure and organization………7
• Caspase-3 activation……….10
• Dimeric interface of caspase-3………....18
• Protein oligomerization and caspase folding……….20
4. MATERIALS AND METHODS……….24
• Chemicals………....24
• Stock solutions………24
o Calculation of molarity of urea by weight measurement…..25
o Calculation of molarity of urea by weight measurement…..25
• Plasmid construction……….26
• Protein purification……….29
• Peptide synthesis………...32
• Analytical ultracentrifugation……….32
Page
• Fluorescence and circular dichroism spectroscopy……….34
• Pro-peptide labeling with dansyl chloride………..34
• Fluorescence anisotropy………..35
• Enzymatic activity………..35
• Activation of the V266H mutant at low Ph……….36
• Granzyme B digestion………..37
• Limited proteolysis with trypsin………37
• Limited proteolysis with V8 protease………..38
• Immunobloting………38
• DMS cross-linking……….39
• Native PAGE………..39
• Quenching of tryptophan fluorescence emission with acrylamide or iodide………..40
• Unfolding kinetic studies………..40
• Equilibrium unfolding studies………..41
• Data analysis……….42
o Analytical ultracentrifugation……….42
o Fluorescence anisotropy………43
o Enzymatic activity………43
o Fluorescence quenching………43
Page
o Equilibrium unfolding studies……….45
5. RESULTS I. Oligomeric properties of procaspase-3 and role of the pro-domain…53 • Recombinant procaspase-3 mutants………53
• Size exclusion chromatography……….54
• Chemical cross-linking using dimethyl suberimidate…………..56
• Sedimentation equilibrium experiments………56
• Circular dichroism experiments………..60
• Fluorescence anisotropy experiments………..63
• Procaspase-3 activity in absence of the pro-domain…………..65
II. Dimer interface substitutions in (pro)caspase-3 ……….69
• Designing dimer interface mutants………69
• Oligomeric properties of the interface mutants………....71
• Catalytic properties of the interface mutants………...78
• Characterization of V266E and V266H interface mutants…… 83
• Oligomerization state of the interface mutants in nanomolar range………..86
• Limited proteolysis with trypsin ………..……….…..89
• Limited proteolysis with V8 protease..………..99
Page
• Circular dichroism studies……….109
• Models for the structural changes in the interface mutations 113 ………..110
III. Testing the models proposed for the interface mutants ………..120
A. Tyr197 designed mutants……….……120
• Catalytic parameters for (V266H,Y197A/C) caspase mutants…..121
• Catalytic parameters for (V266H,Y197A/C) procaspase mutants………..126
• Limited proteolysis with trypsin………...128
• Limited proteolysis with V8 protease……….134
B. V266R designed mutants……….135
• Catalytic parameters for V266R interface mutants…………...…..136
• Oligomeric properties at high concentration………....140
• Oligomeric properties at low concentrations………....143
• Limited proteolysis with trypsin and V8 protease………145
• Circular dichroism and quenching studies………147
IV. Folding and stability of procaspase-3(C163S,V266H)...………..152
• Kinetics of unfolding of procaspase-3(C163S,V266H) in urea….152 • Kinetics of refolding of procaspase-3(C163S,V266H) in urea…..157
Page
• Conformational changes of procaspase-3(C163S,V266H) versus
pH and activation of procaspase-3(D3A,V266H)..………..185
6. DISCUSSION………...195
Oligomerization properties of procaspase-3 and role of the pro-domain………..…...195
Interface mutations in the (pro)caspase-3………..197
Unfolding of procaspase3(C163S,V266H) in urea and pH -dependent conformational changes………...200
Physiological significance……….203
7. CONCLUSIONS……….……….208
8. FUTURE STUDIES……….…209
LIST OF TABLES
Page
Table I. Buffers used in the experiments………30
Table II. Calculated and experimental molecular masses for (pro)caspase-3 interface mutants………75
Table III. Catalytic properties of the (pro)caspase-3 interface mutants…………82
Table IV. Catalytic parameters for the caspases harboring V266H and/or
Y197A/C mutations………..125
Table V. Catalytic parameters for the procaspases harboring V266H and/or Y197A mutations………...127
Table VI. Catalytic parameters of the V266R mutants………..139
LIST OF FIGURES
Page
Figure 1. Apoptotic pathways………3
Figure 2. Caspase classification………...6
Figure 3. Procaspases activate via two distinct mechanisms………..8
Figure 4. Caspase-3 crystal structure………....11
Figure 5. Panel A. Procaspase-3 organization……….12
Panel B. Pro-less variant organization……….……….………12
Panel C. Models for procaspase-3 assembly and maturation………..13
Figure 6.Panel A. Catalytic loops of caspase-3 and dimer interface...16
Panel B. Caspase interface alignment……….17
Figure 7. Panel A. Procedure file for two-state monomer model of procaspase-3(C163S,V266H)………..51
Panel B. Procedure file for three-state monomer model of procaspase 3(C163S,V266H)………..52
Figure 8. Gel filtration analysis………..55
Panel A. Elution profiles forprocaspase-3(C163S) and pro-less variant………..………….…..55
Panel B. Calibration curve of the sizing column………55
Page
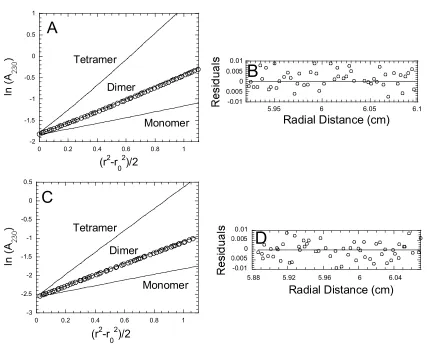
Figure 10. Analytical ultracentrifugation of procaspase-3(C163S) and pro-less
variant(C163S)……….…59
Figure 11. Circular dichroism spectra of procaspase-3(C163S), pro-less variant, and pro-peptide………..61
Figure 12. Fluorescence anisotropy of pro-peptide in the presence of pro-less variant………...64
Figure 13. Pro-domain influence upon the activity of procaspase-3………….67
Panel A. Michelis-Menten plots for procaspase-3(D3A) and pro-less procaspase(D175A)………67
Panel B. The initial velocity of pro-less procaspase(D175A) in presence of the pro-domain………..….67
Figure 14. Designing dimer interface mutants………..…….70
Figure 15. Sedimentation equilibrium analysis of the interface mutants….72-73 Panels A-B. Procaspase-3(C163S,V266E)………..72
Panels C-D. Caspase-3(V266E)………..…..72
Panels E-F. Procaspase-3(C163S,V266H)……….…….72
Panels G-H. Insoluble procaspase-3(C163S,V266E)...………..73
Panel I. Fluorescence emission spectra of monomer procaspase-3(C163S,V266E)……….74
Page
Figure 16. Catalytic parameters for the interface mutants………..79-80 Panel A. Michelis-Menten analysis……….…..79 Panel B. Effect of pH on the initial velocity ……….….79
………Panel C. Activation of the V266H mutant………..…...80
Figure 17. Characterization of the interface mutants………...84-85 Panel A. Digestion of the procaspase-3 with caspase-3………...84 Panel B. Western blot against the large subunit of caspase-3……..85
Figure 18. Oligomerization of interface mutants at low concentrations…...86-87
Panel A. Initial velocity dependence on the enzyme concentration
………...86
Panel B. Native gel Western-blotting of procaspase-3(C163S,V266H)
………..…87
Figure 19. Limited proteolysis of the interface mutants………90-97
Panel A. Trypsin digestion of procaspase-3(C163S,V266H)………...90 Panel B. Trypsin digestion of procaspase-3(C163S,V266E)………...91 Panel C. Trypsin digestion of caspase-3(V266H)………..92 Panel D. Trypsin digestion of caspase-3(V266E)……….….…93 PanelE. V8 protease digestion of procaspase-3(C163S,V266H)
……….….94
Panel F. V8 protease digestion of the procaspase-3(C163S,V266E)
Page
Panel G. Mapping the proteolysis cleavage sites……….96 Panel H. Summary of trypsin cleavage……….97 Panel I. Summary of V8 protease cleavage……….97
Figure 20. Fluorescence studies of the interface mutants………….….….103-105 Panel A. Iodide quenching of the caspase mutants ...…..103
Panel B. Iodide quenching of the procaspase mutants………..…...103 Panel C. Acrylamide quenching at pH 7.2………...104 Panel D. Average emission wavelength versus pH………..…..105
Figure 21. Circular dichroismspectra of the interface mutants………110-111 Panel A. Far-UV spectra of the procaspase mutants………...110 Panel B. Near-UV spectra of the procaspase mutants………….….110 Panel C. Far-UV spectra of the caspase mutants………..111 Panel D. Near-UV spectra of the caspase mutants………....111
Figure 22. Panel A. Caspase-3 residue interaction network ………...115 Panel B. Schematic representation of caspase-3 dimer…………....116 Panel C. Model for procaspase-3(V266E) pseudo-activation……...117 Panel D. Model for procaspase-3(V266H) inactivation……...….…..118
Figure 23. SDS-PAGE gels for Y197A and Y197C mutants………...….122
Page
Panel C. Procaspase Y197A/C mutants……….124
Figure 25. Limited proteolysis of the procaspase Y197 mutants…………129-132
Panel A. Procaspase-3(D3A,V266H,Y197A) plus trypsin…………..129 Panel B. Procaspase3-(D3A,V266H,Y197C) plus trypsin …………..129 Panel C. Procaspase-3(D3A,Y197C) plus trypsin …….…………...130 Panel D. Procaspase-3(D3A,Y197A) plus trypsin……….…………...130 Panel E. Procaspase-3(D3A,V266H,Y197A) plus V8 protease..…...131 Panel F. Procaspase-3(D3A,Y197C) plus V8 protease ...………...132 Panel G. Procaspase-3(D3A,Y197A) plus V8 protease ……….132 Figure 26. Catalytic properties of the V266R mutants……...………….…137-138 Panel A. Michelis-Menten analysis ……….….…...137
Panel B. Initial velocity dependence versus pH……….……138
Figure 27.Panels A-B. Cross-linking experiments of
procaspase-3(C163S,V266R)………....141
Panel C. Initial velocity dependence on the enzyme concentration for V266R mutants……….…..142
Figure 28. Limited proteolysis ofprocaspase-3(C163S,V266R)………...146
. ………… Panel A. Limited proteolysis with trypsin……….…146
Panel B. Limited proteolysis with V8 protease ………….…………..146
Page
Panel C. Iodide quenching versus pH……….…...…..149
Figure 30. Kinetics of unfolding of procaspase-3(C163S,V266H)………...154-155 Panel A. Kinetics at pH 8.0……….……154
Panel B. Kinetics at pH 7.2……….…154
Panel C. Kinetics at pH 6.5……….…154
Panel D. Kinetics at pH 4.0……….…155
Panel E. Kinetics at pH 4.25.………..…155
Panel F. Kinetics at pH 4.75………...……155
Panel G. Kinetics at pH 5.0……….……155
Panel H. Kinetics at pH 5.5……….………155
Panel I. Kinetics at pH 6.0……….……….155
Figure 31. Kinetics of refolding of procaspase-3(C163S,V266H)…………...…158
Figure 32. Equilibrium unfolding of procaspase-3(C163S,V266H) at pH 8.0…160 Figure 33. Equilibrium unfolding of procaspase-3(C163S,V266H) at pH 7.2…163 Figure 34. Equilibrium unfolding of procaspase-3(C163S,V266H) at pH 6.5....166
Figure 35. Equilibrium unfolding of procaspase-3(C163S,V266H) at pH 6.0…168 Figure 36. Equilibrium unfolding of procaspase-3(C163S,V266H) at pH 5.5…170 Figure 37. Equilibrium unfolding of procaspase-3(C163S,V266H) at pH 5.0…172 Figure 38. Equilibrium unfolding of procaspase-3(C163S,V266H) at pH 4.75 ………..174
Page
Figure 40. Equilibrium unfolding of procaspase-3(C163S,V266H) at pH 4.0…178
Figure 41. Unfolding procaspase-3(C163S,V266H) at different pH’s………….181
Figure 42. Unfolding procaspase-3(C163S,V266E) in urea at pH 7.2.………..183
Figure 43. Activation of procaspase-3(D3A,V266H) after dialysis at low pH ……….186
Figure 44. Trypsin digestion of procaspase-3(C163S,V266H) …………...188-189 Panel A. Digestion at pH 7.5………..188
Panel B. Digestion at pH 7.5 after exposure at pH 5.0………..188
Panel C. Digestion at pH 5.5………..189
Panel D. Digestion at pH 6.0………..189
Figure 46. V8 protease digestion of procaspase-3(C163S,V266H)………191-192 Panel A. Digestion at pH 6.0………191
Panel B. Digestion at pH 5.5………191
Panel C. Digestion at pH 5.0………...………192
INTRODUCTION
Apoptotic pathways
Caspases are a family of cysteine proteases that have been identified first as
key players in the cellular process termed programmed cell death or apoptosis (1).
During the progression of programmed cell death, a finely organized physiological
mechanism regulates the destruction and tidy disposal of unwanted cells, without
participation of the inflammatory response (2). Although there are many types of
cellular death, nearly all the physiological deaths in eumatozoans proceed by the
process of apoptosis (3). Cell death is mandatory during the development of the
multicellular organisms, participating from the tissue differentiation and harmonious
shaping of the organs to the elimination of the infected cells or the suicide of
cancerous cells (4).
Typical morphological changes in cells distinguish apoptosis from necrosis
(4). These include chromatin condensation, DNA cleavage, cytoplasmic shrinkage,
and plasma membrane blebbing that lead to the organized fragmentation of the cells
into membrane-enclosed particles called ‘apoptotic bodies’ (4). Non-leakage of the
intracellular content avoids the inflammation, while specific structural changes on the
membrane induce the phagocytosis of the apoptotic bodies by the surrounding
macrophages (4). Overall, apoptosis is differentiated from other types of death by
the silent way of cellular debris removal, or “death without corpse” (2).
Abnormalities in apoptosis are the cause of many pathological situations (4).
In humans, excessive cellular death is the base of neurological diseases, while
reasons, the research in the pathology of cellular death received tremendous
attention in the last 20 years.
Although the concept of apoptosis was introduced in 1972 (6), a clear
mechanism of how apoptosis is initiated does not exist. The scientific literature
shows that numerous chemicals can induce cellular death under certain conditions
(4). However, in mammals, some cells die autonomously during development,
meaning that the suicidal signal is intrinsically planned (4).
Two major pathways, conserved in all multicellular organisms, are generally
accepted to be responsible for apoptosis initiation (7): A) Cell surface death receptor
pathway; and B) Mitochondria-mediated pathway (Figure 1). Both pathways
culminate with the activation of the initiator caspases, which in turn activate the
executioner caspases. Minor initiation pathways include activation of the
executioners by other proteases, like Granzyme B, introduced into cells by the
cytotoxic lymphocytes (2).
The extracellular pathway involves ligation of the death receptors (Fas
receptors or the TRAIL receptors) with their specific ligands (7) (Figure 1). The latter
induce the formation of receptor micro-aggregates, followed by the recruitment of the
intracellular adaptor scaffolds, and the initiator caspases. The death domain (DD) of
the Fas receptor interacts with the homologous DD of the adaptor FADD (Fas
associated adapter protein with a death domain). An additional domain of FADD,
DED (death effector domain), interacts with the DED domain of the procaspase-8 or
-10, contributing to their activation and auto-processing. The resulting caspases are
procaspases-3, -6, or -7. The executioners target the proteolysis of numerous
cellular substrates (lamin, DNA repair enzymes, gelsolin, protein kinase C) (9),
ultimately leading to cell dismantling (4).
On the other hand, the intracellular mediated pathway utilizes signals
released by the mitochondria (7) (Figure 1). This pathway is highly ATP dependent,
as the scaffold needed to activate the initiator caspase-9, called apoptosome, is
formed with the participation of seven molecules of dATP per molecule of
apoptosome (10). The main component of this machinery is Apaf-1, a large protein
of 130 kDa, containing a caspase-recruitment domain (CARD) (at the N-terminus), a
nucleotide affinity domain (in the protein core), and 12-13 WD-40 repeats (at the
C-terminus) (7). In the presence of dATP and cytochrome c released by mitochondria,
Apaf-1 forms a 7-unit multimeric structure (apoptosome) able to recruit and activate
procaspase-9, via CARD-CARD interactions (10). Activated (pro)caspase-9
specifically targets procaspase-3 for activation (7).
The mitochondrial-signaling pathway is finely regulated by the proteins from
the Bcl-2, Bcl-x, and Bax families, which control especially the release of cytochrome
c from the intermembrane space (7). In addition, several endogenous inhibitors of
caspases have been identified in mammalian cells, grouped into the family of IAP
proteins or “inhibitors of apoptosis” (11).
Caspases in apoptosis
Caspases are cysteinyl aspartate-specific proteases that recognize a
high degree of specificity is found only in Granzyme B, a serine protease that also
cleaves after aspartic acid and is produced by activated lymphocytes during the
inflammatory response (13). There are 14 known mammalian caspases, most of
them well characterized (14). Although the main cellular role of caspases is in
apoptosis, some caspases are involved in other cellular processes like cytokine
maturation, T-cell proliferation, cell cycle regulation, and cell differentiation (15, 16).
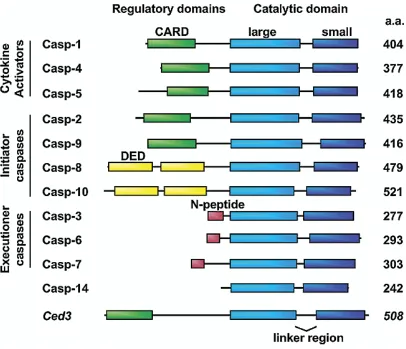
Several ways are used to classify caspases (14, 16) (Figure 2): a) According
to their substrate preferences, caspases-1, -4, -5, and -13 belong to group I
(preference for WEHD motif), caspases-2, -3, and -7 belong to group II (preference
for DEXD), and caspases-6, -8, -9, and -10 belong to group III (preference for
I/V/L/EXD); b) According to their cellular function, caspases are apoptotic
(caspase-3, -6, -7, -8, -9), or non-apoptotic (caspase-1, 4, or 5). The latter participate in the
production of the cellular cytokines, cell division and cellular attachment; c)
According to the their role in apoptosis, caspases are initiators (caspase2, 8, 9,
-10) or executioners (caspase-3, -6, -7); d) According to the length of their
prodomain, caspases are long prodomain caspases (caspase1, 2, 4, 5, 8, 9, and
-10) or short pro-domain caspases (caspase-3, -6, -7, -14).
Caspases exist in cells as dormant zymogens, which await to be activated
following the apoptotic signal (17). It has been determined that the initiator
procaspases are monomers, and their activation takes place only subsequent to
pro-domain mediated dimerization (Figure 3). Cleavage of these procaspases is neither
required nor sufficient for their activation (17). Interestingly, the mature initiator
Figure 2. Caspase classification. Human caspases are classified according to their cellular function (cytokine activators, apoptosis initiators, and apoptosis
executioners), and the length of the pro-domain (long pro-domain containing CARD
or DED motifs, and short domain). Procaspases organization includes: the
INITIATOR EXECUTIONER
P10 P20 Similar organization
Specific cleavage
D D D D
Amplification loop
Amplification loop Substrate
Active site (C163, H121)
Heterodimer Small Large
Active, heterotetramer
C C
C
C
N
N
Large Large
N
Small
N
Heterotetramer, active
Intermolecular cleavage CARD/DED dimerization
Dimer-active
Apoptosis Dimer, dormant
D
Monomer, dormant
Pro Small subunit
Large subunit CARD/DED
Figure 3. Procaspases activate via two distinct mechanisms: 1) Initiator
procaspases are monomers and can be activated via CARD/DED dimerization. The
resulting dimer is able to autoprocess by cleaving at the inter-subunit linker and at
the CARD/DED domain (at ‘D’, shown by the black arrows). The resulting
heterotetramer lacks the pro-domain and has full catalytic activity. 2) Executioner
procaspases are dimers and can be activated via intersubunit cleavage by
up-stream caspases. The resulting heterotetramer has similar organization with the
initiator caspases. Executioner caspases can amplify the caspase cascade by
processing other initiator or executioner procaspases. C and H are the catalytic
pro-enzymes (19). By contrast, the executioner procaspases, which contain a short
pro-domain, are obligatory dimers (Figure 3) (17). Their proteolysis by the up-stream
caspases or other proteases is both required and sufficient for activation (20). Like
the initiators, their own precursors are poor substrates (21); however, they can
amplify the caspase cascade by efficiently cleaving the initiator zymogens or other
effectors (18) (Figure 3). It has recently been determined that caspase-3 is active
only for a short period of time during apoptosis (22). Cells are able to trigger
caspase-3 degradation, a function that is dependent on the activity of caspase-3
itself. Therefore, caspases contribute to the regulation of their own turnover.
Caspase structure and organization
Caspases are organized as pro-enzymes containing a pro-domain, a linker, a
large subunit, an inter-subunit linker, and a small subunit (18) (Figure 3). Cleavage
of the aspartate between the small and the large subunit is responsible for mature
caspase formation (18). In contrast with other protease zymogens, the dormancy of
the precursors is not due to the occupancy of the catalytic site by the pro-domain
(23). Upon maturation and removal of the pro-domain, caspases become organized
as heterotetramers, or dimers of heterodimers of Mr~ 60 kDa (Figure 3) (18).
Crystal structures of caspase-1, -2, -3, -7, -8, and -9 have been solved and
demonstrate the structural homology within the family (24-29). Caspases define a
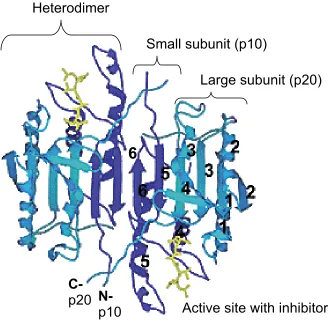
structure. They are globular proteins containing six β-strands and five helices per
heterodimer (Figure 4). The two heterodimers contain one large subunit (α) (~20
kDa, or p20) and one small subunit (β) (~10 kDa, or p10) and are arranged
antiparallel relative to each other, in a αββα configuration (18). The β-structure forms
the core of the protein, extending only one β-sheet between the large and the small
subunits (Figure 4). The helices surround the β-core. The two catalytic sites, situated
opposite to each other, are located between the small and large subunits and are
surrounded by four catalytic loops involved in substrate binding. The catalytic
residues (cysteine and histidine) belong to the large subunit, although both subunits
contribute to the catalytic groove (18).
Excepting procaspase-7 (27, 30), the structure of any other procaspase has
not been solved.
Caspase-3 activation
Caspase-3 (CPP32, apopain, Yama) is the main executioner of the cell death,
cleaving the largest number of apoptotic substrates among all caspases (9).
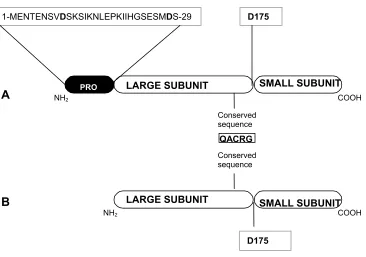
Procaspase-3, the precursor of caspase-3, is a protein of 277 amino acids in total
with a 28 residue pro-domain. Its organization is shown in Figure 5. C163 and H121
are the catalytic residues. The motif containing the active cysteine (QACRG) is
conserved in all caspases (9). Procaspase-3 crystal structure is not available.
One model for formation of active caspase assumes that procaspase
Heterodimer
C-
p20
N-
p10
Active site with inhibitor
Small subunit (p10)
Large subunit (p20)
6
Figure 4. Caspase-3 crystal structure. A contiguous β-sheet provided by both small
and large subunits forms the core of caspase-3 structure. The small subunits (p10)
are colored dark blue and the large subunits (p20) are colored light blue. Helices,
numbered from 1 to 5, surround the β strands, numbered from 1 to 6. In yellow it is
NH2
LARGE SUBUNIT
COOH SMALL SUBUNIT SMALL SUBUNIT
Conserved sequence
B A
D175 QACRG Conserved sequence
COOH LARGE SUBUNIT
D175
NH2
1-MENTENSVDSKSIKNLEPKIIHGSESMDS-29
PRO
Figure 5. Procaspase-3 and pro-less variant. Panel A. Schematic representation of
full-length procaspase-3, showing the pro-domain sequence, the conserved catalytic
motif “QACRG” containing the active site C163, and the cleavage sites, D9, D28 and
D175. Residues D9 and D28 from the pro-domain are shown in bold. Panel B.
Procaspase-3 lacking the 28 amino acid pro-peptide, referred in text as ‘pro-less
C
D28
D28
D9
D9
II.
D175
D175
+
I.
C163
C
pro N
pro
C
N
D28
D28
D9
D9
D175
D175
Procaspase-3 zymogen
Mature caspase-3
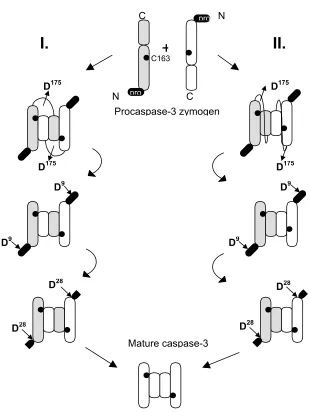
Figure 5. Panel C. Models for procaspase-3 assembly and maturation. Two
molecules of procaspase-3 can form a dimer by interdigitation (A) or association (B),
generating a structure similar to the one of caspase-3 heterotetramer. The dimeric
procaspase is cleaved at D175 to form the maturation intermediate. The pro-domain
is then cleaved rapidly at D9, then more slowly at D28 to give the mature
(Figure 5C). The dimerization can occur either by association (the heterodimer
subunits come from the same precursor) or interdigitation (the subunits come from
two different precursors) (24, 31). Both models have been shown to be true in the
case of procaspase-1 (31). Explicitly, the large subunits of caspase-1, which were
labeled with different epitope tags, could be immunoprecipitated when
co-expressed in cultured cells (31). In addition, catalytically incompetent procaspase-1
due a mutation in p20 could be complemented by another interface mutant in the
p10 subunit (31). Therefore, production of procaspase-1 dimer can occur by either
model I or II of Figure 5C. Generation of mature caspase-1 is the result of
procaspase-1 cleavage in the inter-subunit linker at D297 and D316, followed by
pro-domain cleavage at D103 and D199 (Figure 3) (32).
In the case of procaspase-7, crystal structures (pro) caspase-7 showed that
the subunits of the same heterodimer of mature enzyme originate from the same
molecule of zymogen (30). Due to high similarity between procaspase-7 and
procaspase-3 (9), we assume that this is also true for procaspase-3. Procaspase-3
most probably makes dimers by association, and the activation follows the model II
from Figure 5C. It is assumed that the intersubunit linker of procaspase-3 connects
the subunits from the same heterodimer (Figure 5C), creating the base for
procaspase-3 dormancy. The resulting dimer is cleaved by the initiator caspases at
D175, generating a caspase with full enzymatic activity (23). The slow cleavage of
the pro-domain at D9and D28 usually occurs auto-catalytically (33) (Figure 5C).
Mature caspase-3 subunits are 17 kDa and12 kDa, respectively. Interestingly,
small subunit from the opposite heterodimer (26) (Figure 4). The two protein ends
interact with each other and form the so-called “loop bundle” (further described).
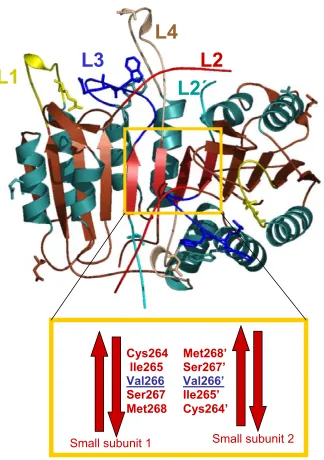
The catalytic loops surrounding the active site are termed L1-L4, and are
illustrated in Figure 6A. The loops include the following sequences (27): L1, residues
42-67 (large subunit), shown in yellow; L2, residues 163-175 (large subunit), shown
in red; L2’, residues 176-193 (small subunit), shown in cyan; L3, residues 198-213
(small subunit), shown in blue; and L4, residues 246-263 (small subunit), shown in
brown (Figure 6A).
In the case of procaspase-7, the data shows that the precursor is not
enzymatically active because loop L3 is unraveled and positioned away from the
active site, andthe catalytic C163 is rotated away from solvent, preventing the attack
of the substrate (27). Cleavage of the inter-subunit linker is critical for allowing
conformational changes in other loops that must occur to remodel the active site.
Removal of the covalent bond between the subunits releases the C-terminus of the
large subunit, or loop L2, which flips 180° toward the N-terminus of the small
subunit, or loop L2’, from the other heterodimer. The interaction between loop L2
and loop L2’ results in formation of the “loop bundle”, and allows the re-positioning of
the catalytic cysteine to more hydrophobic environment. Following maturation, loop
L3 moves over 10 Å toward the protein core to form the substrate-binding pocket.
Loop L4 rotates in opposite direction of L3 by 60o and stabilizes the other side of the
A
L4
L2
L2´
L3
L1
Small subunit 2
Met268’ Ser267’
Val266’
Ile265’ Cys264’
Small subunit 1
Cys264 Ile265
Val266
Ser267 Met268
Figure 6.Panel A. Catalytic loops of caspase-3 (L1-L4), described in text, and the heterodimer-heterodimer interface. V266 is the symmetry axis residue, making Van
der Waals contacts with the counterpart residue from the opposite heterodimer. The
B
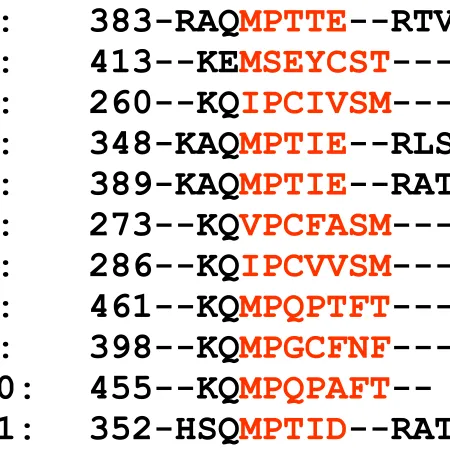
Caspase-1: 383-RAQ
MPTTE
--RTV
Caspase-2: 413--KE
MSEYCST
---
Caspase-3
: 260--KQ
IPCIVSM
---
Caspase-4: 348-KAQ
MPTIE
--RLS
Caspase-5: 389-KAQ
MPTIE
--RAT
Caspase-6
: 273--KQ
VPCFASM
---
Caspase-7
: 286--KQ
IPCVVSM
---
Caspase-8: 461--KQ
MPQPTFT
---
Caspase-9: 398--KQ
MPGCFNF
---
Caspase-10: 455--KQ
MPQPAFT
--
Caspase-11: 352-HSQ
MPTID
--RAT
Figure 6. Panel B. Caspase interface alignment. Caspase-3 family is shown in blue.
Residues that contribute to the formation of β-strand 6 (Figure 4) from caspase small
Formation of the loop bundle between protein termini of two different heterodimers
explains why caspases must occur as heterotetramers (Figure 6A). Stabilization of
loop L2 after maturation would not be possible within the same heterodimer
molecule, as the exposed residues require van der Waals contacts. Interaction of the
residues from loops L2, L2’ and L4 prepare the basis for caspase dimerization.
Dimeric interface of caspase-3
Caspase-3 is an obligatory heterotetramer, and its oligomeric properties are
in direct link with the enzymatic activity (34). Molecular dynamics studies of the
inhibitor-bound caspase-3 revealed that movements of the catalytic loops from
different heterodimers are correlated, and these motions are mediated through the
N-terminal region of the small subunit (35). In addition, structure-based
thermodynamic analysis indicates that residues from the dimer interface of
caspase-3 are critical for stabilizing the active site loops, and that a caspase-caspase-3 heterodimer
could not exist thermodynamically (36).
The heterodimer-heterodimer interface of caspase-3 encloses ~2000 Å2 of
hydrophobic area, mainly contributed by ten residues that belong to the last two beta
strands of the small subunits (26) (Figure 6). The hydrophobic contact between
V266 and V266’ from the opposite heterodimer is at the center of this interface.
Additional interactions include H-bonding between the C-terminus of the large
subunit and the N-terminus of the small subunit, and also salt bridges at the bottom
In the case of caspase-1, activity assays using the enzyme dilution method
showed that caspase-1 is inactive subsequent to dissociation of the heterotetramer
into heterodimers (37). In this method, the catalytic activity is measured following
serial dilutions of the enzymes in assay buffer until the activity disappears. The
recovery in activity is monitored by measuring the activity of the concentrated
enzyme at the initial concentration values (37). In addition, initiator caspase-1, -8,
and -9 can be shifted from the monomeric to the dimeric state following enzyme
incubation with active site inhibitors (19, 29, 38).
The sequences of the residues residing in the dimer interface of various
human caspases are shown in Figure 6B. Interestingly, the interface amino acids are
not uniformly conserved in the caspase family. For example, the hydrophobic
interface of caspase-3 is conserved only in caspase-6 and -7 (Figure 6B). In
contrast, caspase-1 dimerization relies on electrostatic interactions between
hydrophilic residues, which are preserved in caspase-4, -5, and -11. Moreover, the
interfaces of caspase-2 and -9, as well as the interface of caspase-8, which is
conserved in caspase -10, include both hydrophobic and hydrophilic residues
(Figure 6B). In general, long pro-domain caspases contain hydrophilic residues in
the dimer interface, while the short pro-domain caspases utilize hydrophobic-based
interactions for oligomerization.
A distinct mechanism for the interface formation is represented by caspase-2,
an initiator caspase that contains a CARD-domain and is located in the nucleus (16).
In this case, a disulphide bond between C419 and C419’ from the interface (Figure
studies showed that caspase-9 might also use this mechanism for activation during
the oxidative stress induced apoptosis in mitochondria (39).
Proteinoligomerization and caspase folding
Many cellular proteins are homo- or heterooligomers and, in some cases,
their biological activity depends strictly on the quaternary structure (40). Modification
of the interface of oligomeric proteins is a very specific and efficient way of drug
targeting (41). More than 2000 proteins are known to occur as oligomers, and the
atomic resolution structure of most of them has been elucidated (40).
Usually, in the cell, large globular proteins, rather than small proteins,
associate to form soluble and functional complexes. Several evolutionary
advantages can explain this feature: 1) The cooperation between subunits during the
biologic activity (groEL (42) and the proteasome (43)) and during regulation
(hemoglobin (44) and aspartate transcarbamylase (45)); 2) The increase in the
stability due to the buried solvent-exposed surface area (46); 3) The diminution of
degradation by proteases (40); 4) The facilitation of folding of large protein domains
in the presence of protein assemblies (40).
In many cases, oligomerization confers unusual properties to enzymes: it may
determine the direction of a reaction (lactate dehydrogenase), increase its velocity
(trypthophan synthetase), modify enzyme specificity by generating new activity
(lactose synthetase) or be required for substrate binding (tyrosyl tRNA synthetase)
For most of the oligomeric enzymes, the catalytic activity occurs at the
subunit interface. A few examples are: HIV-1 protease (48), glucose-6-phosphate
isomerase (49), inosine monophosphate dehydrogenase (50), malic enzymes (51),
aminoacylase (52), manganese superoxide dismutase (53). Only a few oligomeric
enzymes have their active site away from the interface. However, their activity is still
dependent on dimerization, like in the case of caspases (11), Rac1 GTPase (54),
Cu, Zn superoxide dismutase (55), or triosophosphate isomerase (56). In this case,
an interaction network between the interface and the active site residues is usually
responsible for the need of association. Even fewer enzymes are active as both
monomers and oligomers, as it is the case for carbamoyl-phosphate synthetase
(57).
In some cases, both up-regulation and down-regulation of enzyme activity
can be controlled by making use of homo- and hetero-oligomerization. An interesting
example is the mechanism of caspase-8 (FLICE) activation or inhibition by means of
FLIP (FLICE-like inhibitory protein) (17). FLIP is an inactive version of caspase-8
that lacks the active cysteine. Several studies indicate that FLIP expression in
cultured cells can be both pro-apoptotic and anti-apoptotic (17). At low levels of
expression, FLIP promotes the activation of caspase-8 by forming heterodimers with
procaspase-8 at the death-inducing signaling complex (DISC) (58) (Figure 1). In
contrast, at high levels of expression, FLIP competes with procaspase-8 for the
same binding sites on DISC, preventing the caspase-8 activation via the
The number of genetic diseases generated by mutations in the dimeric
interfaces of some enzymes is overwhelming. A few of these include the
nonspherocytic hemolytic anemia (glucose-6-phosphate dehydrogenase) (60),
hereditary sensory neuropathy type I (serine palmitoyltransferase) (61),
aspartylglucosaminuria (aspartylglucosaminidase) (62), familial amyotrophic lateral
sclerosis (human Cu,Zn superoxide dismutase) (62), andParkinson's disease
(human DJ-protein) (63). Most of the time, these enzyme mutations are associated
with loss in catalytic activity.
Usually, the interaction between the subunits of an enzyme is tight.
Thermodynamically, the association equilibrium can be shifted toward the
dissociation state at low protein concentration. In practice, however, it has rarely
been possible to dissociate oligomeric proteins by simple dilution. Some examples
are pyruvate carboxylase, phosphofructokinase, or GroES (40). The dissociation
constants for most oligomers are usually in the nanomolar range. The bulk of the
conformational stability of the oligomers arises from the inter-subunit interactions
(64). Due to this reason, in most of the cases, the dissociated state of a protein can
only be reached by altering the environmental conditions like a change in
temperature or addition of denaturants (40).
The thermodynamics of procaspase-3 unfolding at different pH values has
been well characterized by our lab (65). Overall, at pH 7.2 and 25 oC, procapsase-3
unfolds via a four-state mechanism. First, the native protein, N2, undergoes
isomerization to a dimeric intermediate species, I2. The latter dissociates to the
The total conformational free energy is 24 kcal/mol, suggesting that procaspase-3 is
a very stable protein. The unfolding is a highly cooperative process. Dimerization of
procaspase-3 occurs as a result of the association of two monomeric folding
intermediates, and is considered a folding event (66). It has been predicted by
theoretical thermodynamic analysis that the stability of the dimer interface of several
caspases accounts for ~30-50 % of the dimer stability (36). Indeed, in our laboratory
it was found that the dimerization contributes with approximately 14 kcal/mol to the
conformational free energy of the protein (66). In addition, the short pro-domain of
the zymogen assists in protein folding (65) as is the case for other cysteine
proteases (67), but does not affect the catalytic activity (68).
Protein folding and unfolding are coupled to a range of biological phenomena,
from the regulation of cellular activity to the onset of neurodegenerative diseases
(69). Engineering the inter-subunit interface of oligomeric enzymes as a tool for
studying protein folding and catalytic activity has been a common practice in the last
twenty years.
Here we characterize in depth the correlation between hydrophobic residues
in the dimer interface and the catalytic function and thermodynamics of unfolding of
MATERIALS AND METHODS
Chemicals
Acrylamide, ampicillin, antifoam-C, bovine serum albumin, carbonic anhydrase,
CHAPS, citric acid, cytochrome c, DEAE-sepharose, dansyl chloride, di-isopropyl
fluorophosphates (DFP), DMF, DMSO, DTT, EDTA, EGTA, glycerol, IPTG,
kanamycin, nickel sulfate, PIPES, PMSF, potassium iodide, monobasic and dibasic
potassium phosphate, sephacryl-S15, sephacryl-S100, sodium bicarbonate, sodium
citrate (dihydrate), TLCK, TPCK were from Sigma. Imidazole and urea were from
ICN. Glycine, sodium chloride, Tris, tryptone, Tween-20 and yeast extract were from
Fisher. His-bind resin was from Novagen. Potassium chloride and sucrose were
from Mallinckrodt. HEPES was from Acros. Granzyme B was from Calbiochem. V8
protease and trypsin were from Roche Biochemicals. Ultrapure urea was purchased
from Nacalai Tesque Inc (Kyoto Japan). Ac-DEVD-AFC, Ac-DEVD-CHO,
Ac-DAVD-CMK and Z-VAD-FMK were purchased from Calbiochem. Polyclonal anti-caspase-3
antibody was from Cell Signaling Technology. HRP-coupled secondary antibody was
from Stressgen. Non-fat dry milk was from Biorad. ECL kit was from Amersham.
X-OMAT-AR film was from Kodak. Restriction enzymes were from New England
Bio-labs. DMS was from Pierce.
Stock solutions
Urea stock solution (10 M) was prepared in 20 mM potassium phosphate
8.0), as previously described (70). All solutions contained 1 mM DTT and were
filtered through 0.45 µm pore size filters prior to the experiment. The molarity of the
urea stocks was calculated using the weight method (A) and refractive index method
(B). The accepted error was ± 0.5%.
A. Calculation of molarity of urea by weight measurement
The specific gravity of a reagent solution is defined as the density relative to
the density of water at the same temperature. At 25oC, the correlation between the
specific gravity of a reagent solution and its weight is described by the following
equation:
d/d0 = 1+0.2658W + 0.0330W2
where, W is the weight fraction denaturant in the solution, d is the density of the
solution and d0 is the density of water . For 10 M urea solution at 25oC, the specific
gravity of the solution, d/d0, was found to be 1.103.
Explicitly, the 10 M urea solution was prepared as follows: the desired amount
of urea was weighed out in a beaker containing a stir bar. Buffer solution was then
added up to a certain weight, which depended of the final volume of the solution (for
example, for 40 ml of 10 M urea solution, the weight of the solution will be 40*1.103).
In this calculation, the density of the buffer was approximated with the density of
water as the difference is less than 0.01 g/cm3.
B. Calculation of molarity of urea by weight measurement
The molarity of urea can be expressed in term of refractive index of urea
solution by the following empirical equation:
where, ∆N is the difference between the refractive index of the urea solution and the
refractive index of the buffer. The refractive index was measured using refractometer
(Fisher Scientific).
Methods
Plasmid construction
The procaspase-3 gene was amplified by PCR from pET21b-CPP32 (71),
kindly provided by Dr. Emad Alnemri (Thomas Jefferson University, Philadelphia)
using the primers HC3P32F (GTCGCGGATCATATGGAGAACACTG) and
HC3P12R (GTGGTGGTGGTGCTCGAGGTG). This introduced an NdeI site at the 5’
end of the gene and an XhoI site at the 3’ end of the gene. The amplified gene
product was inserted into pET21b that had been digested with NdeI and XhoI. This
strategy removed fourteen amino acids at the amino terminus of procaspase-3 that
arise from the vector in pET21b-CPP32. The resulting plasmid, pHC332 produces
procaspase-3 with the correct amino terminus. The active site cysteine (C163) was
mutated to serine using QuickChangeTM site-directed mutagenesis kit (Stratagene),
with the primers HCP3CS1
(5’-CATTATTCAGGCCTCCCGCGGTACAGAACTGGACTGTGG-3’) and HCP3CS2
(5’-CAGTTCTGTACCGCGGGAGGCCTGAATAATGAAAAGTTTGG-3’), and plasmid
pET21b-CPP32. This strategy also introduced a unique SacII site (underlined)
downstream of the C163S mutation (shown in bold). Plasmids were first screened by
The mutated gene was cloned into pET21b, as described above, to produce the
plasmid pHC33201.
Plasmids pHC317 and pHC312, which harbor the genes for the caspase-3
large and small subunits, respectively, were constructed by subcloning the DNA
corresponding to each subunit from pHC332, described above, into pET21b. The
PCR primers for the large subunit were HC3P17F and HC3P17R
(5’-CATCATCAACCTCGAGGTCTGTCTC-3’), whereas those for the small subunit were
HC3P12F (5’-GCATTGAGCATATGAGTGGTGTTGATG-3’) and HC3P12R. In both
cases, NdeI and XhoI sites were introduced at the 5’ and 3’ ends, respectively. All
constructs were sequenced (both strands) in order to confirm the correct sequence.
Plasmid pHC32901 was constructed by subcloning the DNA for the
procaspase-3 large and small subunits from pHC33201. The primers for PCR
amplification were HC3P17F (5’-GCGAATCACATATGTCTGGAATATCCC-3’) and
HC3P12R (5’-GTGGTGGTGGTGCTCGAGGTG-3’), generating NdeI and XhoI sites
at 5’ and 3’ ends, respectively. The ~750 bp fragment was inserted into pET21b
digested with NdeI and XhoI. The resulting proteins have carboxyl termini consisting
of the sequence Leu-Glu-His6 that arise from the vector.
The procaspase-3(D9A,D28A,D175A) mutant was made by a three-step
process from plasmid pHC332, harboring the gene for wild-type human
procaspase-3. First, D175 was mutated to alanine using primer 1
(5’-GTGGCATTGAGACAGCTAGCGGTGTTGATGATG-3’) and primer 2
(5’-CATCATCAACACCGCTAGCTGTCTCAATGCCAC-3’). In the background of
(5’-GGAAGCGAATCAATGGC AC GTGGAATATCCCTG-3’) and primer 4
(5’-CAGGGATATTCCACTGGCCATTGATTCGCTTCC-3’). In the background of
D28A/D175A, D9 was mutated to alanine using primer 5
(5’-GAAAACTCAGTGGCTAGCAAATCCATTAAAAATTTGG-3’) and primer 6
(5’-CCAAATTTTTAATGGATTTGCTAGCCACTGAGTTTTC-3’). The primers
incorporated the following restriction sites for screening mutants. Primers 1 and 2:
NheI; primers 3 and 4: BalI (MscI); primers 5 and 6: NheI. The mutations are shown
in bold and the restriction sites are underlined. All plasmids were sequenced (both
strands) to confirm the mutations. The resulting plasmid is called pHC33209, and we
refer to this mutant as procaspase-3(D3A). Interface mutants were created using the
Quick-Change site directed mutagenesis kit (Stratagene) and the primers described
below. The plasmids used as templates were pHC332, pHC33201, and pHC33209,
which generated the interface mutations in wild-type caspase-3,
procaspase-3(C163S), and procaspase-3(D9A,D28A,D175A), respectively. For V266H mutants,
primers V266Hfwd and V266Hrev were used: V266Hfwd,
5’-CAGATTCCATGTATTCATAGCATGCTCACAAAAGAACTC-3’; V266Hrev,
5’-GAGTTCTTTTGTGAGCATGCTATGAATACATGGAATCTG-3’. For V266E mutants,
primers V266Efwd and V266Erev were used: V266Efwd,
5’-CAGATTCCATGTATTGAGTCCATGCTCACAAAAGAACTC-3’; V266Erev,
GAGTTCTTTTGTGAGCATGGACTCAATACATGGAATCTG. Primers V266Hfwd
and V266Hrev introduced a unique Sph1 site (underlined). The mutated bases are
shown in bold. For V266R mutants, primers V266Rfwd and V266Rrev were used:
V266Rfwd, 5’-GAGTTCTTTTGTGAGCATGCTACGAATACATGGAATCTG-3’. The
introduced unique Sph1 site is underlined. For the Y197A mutants, the following
primers were used: primer Y197Afwd,
5’-GGCCGACTTCTTGTATGGAGCTAGCACAGCACCTGG-3’, and Y197Arev,
5’-CCAGGTGCTGTGCTAGCTGCATACAAGAAGTCGGCC-3’. The mutations (bold)
introduced the unique site NheI (underlined). For the Y197C mutants, the following
primers were used: primer Y197Cfwd,
5’-GGCCGACTTCTTGTATGCATGCAGTACTGCACCTGG-3’, and primer Y197Crev,
5’CCAGGTGCAGTACTGCATGCATACAAGAAGTCGGCC-3’. The mutations (bold)
introduced the unique site SphI (underlined).
The plasmids were sequenced (both strands) to confirm the mutations.
Protein purification
All steps were performed at 4 oC unless otherwise noted. In separate
experiments, human (pro)caspase-3 mutants were purified as C-terminal-(His)6
-tagged proteins from E.coli BL21(DE3)LysS cells harboring the described plasmids.
Cells were grown in Fernbach flasks containing 1 liter of LB media with 50 µg/ml
ampicillin and 0.003% antifoam-C at 37 oC. When the cultures reached an OD600 of
~1.2, protein expression was induced by the addition of IPTG to a final concentration
of 0.5 mM and the temperature was decreased at 25 oC. The cells were harvested
after ~16 hours (procaspase-3 mutants) or ~ 5 hours (caspase-3 mutants) by
centrifugation at 5,000 x g for 15 minutes (GS-3 rotor). The bacterial pellets were
Table I. Buffers used in the experiments
BUFFER COMPOSITION
Buffer A 50 mM Tris-HCl, pH 7.9, 50 mM NaCl, 5 mM Imidazole, 100
µg/ml PMSF, 50 µg/ml TLCK, 100 µg/ml TPCK
Buffer B 50 mM Tris-HCl, pH 7.9, 50 mM NaCl
Buffer C 50 mM KH2PO4/K2HPO4, pH 7.2
Assay buffer 20 mM Pipes, pH 7.5, 150 mM NaCl, 1% sucrose, 0.1 %
CHAPS, 10 mM DTT
Phosphate buffer 50 mM KH2PO4/K2HPO4, pH 7.5, 1mM DTT
Tris buffer 50 mM Tris-HCl, pH 7.2-9.0, 1 mM DTT
Citrate buffer 20 mM citrate pH 3.0-6.0, 1 mM DTT
Electroblotting
buffer
30 mM Tris, 0.2 M glycine, pH 7.5, 20% methanol
TBS-T 20 mM Tris pH 7.6, 0.15 M NaCl, 0.1% Tween-20
Blocking buffer TBS-T containing 5% non-fat dry milk
a French Pressure cell (16,000 psi). The supernatant was separated from cell debris
by centrifugation at 28,000 x g for 30 minutes (SA-600 rotor). The pellet from this
step was washed once with buffer A (Table I) (5 ml per liter of culture) and
centrifuged for 30 minutes. The resulting supernatant was combined with the first.
The proteins were then batch-bound for 15 minutes to His-bind resin (20ml)
equilibrated in buffer A (Table I). The resin was washed four times with four volumes
of buffer A (Table I) , then four times with four volumes of buffer A (Table I)
containing 80 mM imidazole. After each wash, the resin was centrifuged for two
minutes at 500 g (SA-600 rotor), and the supernatant was removed. The protein was
eluted with buffer A (Table I) containing 500 mM imidazole (two times of two
volumes each), and the fractions were analyzed by SDS-PAGE (4-25% gradient
gels). The 500 mM fractions were pooled and dialyzed overnight (2 x 80 volumes)
against buffer B (Table I). The sample was applied to a DEAE-sepharose column (3
cm x 18 cm) that had been pre-equilibrated with buffer B (Table I). The proteins were
eluted at a flow rate of 4 ml per minute with a linear gradient of 50-400 mM NaCl.
Each fraction was tested using a mini-Bradford assay (72), and the positive fractions
were analyzed by SDS-PAGE (4-25% gradient gels). The fractions (100-175 mM
NaCl) containing the pure proteinswere pooled, concentrated, and dialyzed
overnight against buffer B (Table I). The proteinswere stored at -20 oC. The protein
purity was greater than 95% as assessed by SDS-PAGE.
The concentrations of procaspase-3 and caspase-3 mutants were determined
method of Edelhoch (73) and are in good agreement with that determined previously
for procaspase-3 (74). The concentrations shown here are those of the monomers.
Procaspase-3(C163S,V266E) was also purified from the insoluble fraction of
E. coli Bl21(De3)TUNER cells. Briefly, the cells were grown at 30 oC, induced with
0.4 mM IPTG at an OD600 of ~1.2, and harvested after 20 h. After lysis as descried
above, the inclusion bodies were washed 5 times with buffer A (Table I) and then
resuspended in buffer A containing 4 M urea. The purification on His-bind resin was
done as described above, except that all buffers contained additionally 4 M urea.
The imidazole fractions containing the protein were concentrated, dialyzed against
50 mM Tris HCl, 50 mM NaCl, 4 M urea, 1 mM DTT, pH 7.9 and refolded in the
same buffer without urea at a final concentration of 50 µg/ml, on ice. After
concentration to A280~0.4, the protein was stored at -20 oC.
Peptide synthesis
The wild type and mutant (D9A) pro-domains were synthesized by the
Peptide Facility at the University of North Carolina at Chapel Hill. The peptides were
dissolved in DMSO at a concentration of 100 mM.
Analytical ultracentrifugation
Sedimentation equilibrium experiments were performed at 25 oC in a
Beckman XL-A ultracentrifuge equipped with absorbance optics and a four-hole
AnTi60 rotor. The proteins were dialyzed at 4 oC into buffer C (Table I) with either 1
equilibrated at three rotor speeds (14,000 rpm, 18,000 rpm, 24,000 rpm), and the
absorbance was measured at 280 nm or 230 nm. For the 280 nm data, the protein
concentrations were: a) procaspase-3(C163S): 3.5, 9.4, and 18.9 µM b) pro-less
variant(C163S): 1.26, 4.9, and 12.9 µM; c) procaspase-3(C163S,V266E) (soluble
fraction): 11.3, 18.8, and 26.4 µM; d) procaspase-3(C163S,V266H): 7.5, 18.8, and
30.1 µM; e) caspase-3(V266E): 5.6 and 15.0 µM; f) procaspase-3(C163S,V266E)
(insoluble fraction): 8.4, 15.4, and 23.3 µM. For 230 nm, the protein concentrations
were: a) procaspase-3(C163S): 0.45, 0.78, 1.1, 3, and 4.1 µM. b) pro-less form:
0.75, 1.25, 1.85, 2.5, and 3.7 µM. The following calculated partial specific volumes of
the proteins were used: 0.713 ml/mg for procaspase-3(C163S, V266E) and
pro3(C163S,V266H), 0.714 ml/mg for pro3(C163S) and
caspase-3(V266E), and 0.715 for pro-less variant(C163S).
Size exclusion chromatography
Gel filtration experiments were done at room temperature using Sephacryl
S-100 HR resin (1 cm x 30 cm) equilibrated in phosphate buffer at pH 7.2 containing
0.2 mM DTT (Table I). The proteins (13.9 µM for procasapse-3(C163S) and 14.1 µM
for pro-less variant) were dialyzed in the equilibration buffer and 300 µl were applied
on the column. The fractions were collected in 250 µl volume and the absorbance at
230 nm was monitored. The column was standardized using cytochrome c (~12.4
kDa), carbonic anhydrase (~29.0 kDa)and BSA (~66.0 kDa). Procaspase-3(C163S)
Fluorescence and circular dichroism spectroscopy
Fluorescence emission was measured using a PTI C-61 spectrofluorometer
(Photon Technologies International). Proteins (1 µM), dialyzed in buffer C (Table I)
containing 1 mM DTT, were excited at either 280 nm or 295 nm, and fluorescence
emission was measured from 300 to 400 nm. Circular dichroism was measured
using a Jasco J600A spectropolarimeter using either a 0.1 cm (far-UV) or 1 cm
(near-UV) cell. Proteins (dialyzed in buffer C containing 1 mM DTT) had
concentrations between 11.3 and 20 µM. All measurements were corrected for
background signal. Both instruments were equipped with thermostatted cell holders,
and the temperature was held constant at 25 oC (± 0.1 oC) using a circulating water
bath.
Pro-peptide labeling with dansyl chloride
Labeling of the wild-type or mutant (D9A) pro-peptide was performed as
described (75), with few modifications. Briefly, wild type or mutant pro-peptide was
dissolved in 0.1 M sodium bicarbonate, pH 8.6, to a final concentration of 10 mg/ml.
The peptide solution was mixed while vortexing with 1/10 volumes of 10 mg/ml
dansyl chloride in DMF, followed by incubation overnight at 4 °C on rotation wheel.
The labeled peptide was separated from unreacted reagent using a Sephadex G-15
column (1x10 cm), equilibrated with phosphate buffer. The flow-through, containing
the conjugated pro-peptide, was stored at -20 °C. The degree of labeling was
determined by calculating the concentration of dansyl chloride conjugate (ε345= 3400
labeling of mutant pro-peptide and wild type pro-peptide were 50% and 40%,
respectively.
Fluorescence anisotropy
Labeled pro-peptide (1 µM), either wild-type or D9A mutant, was incubated at
25 oC in phosphate buffer in a final volume of 2 ml. The peptide was titrated with
pro-less variant between 0 µM and 10 µM, and the fluorescence anisotropy was
measured as described (76). The PTI C-61 spectrofluorometer in the T-based format
was used (excitation wavelength of 345 nM and emission wavelength of 450 nm).
Enzyme activity
Activity measurements were carried out as described previously using the
fluorescent substrate Ac-DEVD-AFC (77). The proteins were diluted into enzyme
assay buffer (Table I) and incubated at 25 °C for 15 minutes. The protein
concentration was 10 times that used in the experiment. The total reaction volume
was 200 µl, and the final concentration of the enzymes was 1-10 nM (caspase-3
mutants) or 10-25 nM (procaspase-3 mutants). Following the addition of the
substrate, the samples were excited at 400 nm, and the fluorescence emission was
monitored at 505 nm for 300 s. All fluorescence measurements were acquired using
a PTI C-61 spectrofluorometer. The instrument was equipped with a thermostated
cell holder, and the temperature was held constant at 25 ºC using a circulating water
bath. The steady-state parameters, Km and kcat, were determined from plots of initial
the pH was determined by measuring the initial velocity over the pH range of 5 to 10
as described (74). The assay buffer (Table I) contained: 50 mM citrate (pH 3.0 to
6.2), 20 mM Pipes (pH 6.1-7.5), 50 mM Tris HCl (pH 7.2-9.0), and 50 mM sodium
bicarbonate (pH 9.2-10.6). The concentrations of CHAPS, sucrose, NaCl, and DTT
were like in Table I. Final protein concentrations were 2.5-10 nM (caspase-3
mutants) or 25 nM (procaspase-3 mutants).
The enzyme activity studies in presence of the pro-domain were carried out in
both assay buffer and phosphate buffer (Table I). Pro-less variant(D175A) (50 nM)
was incubated with wild type peptide for 1 h, at room temperature, at final
pro-peptide concentrations of 0.1, 0.5, 1.0 and 2.0 µM. The fluorescent substrate was
added at final concentration of 100 µM and the relative fluorescence was measured
as described above.
In case of the dilution enzymatic assays, the enzyme samples were diluted in
assay buffer at pH 7.5 at final concentrations shown in the figures, and incubated at
25 oC for 1 h. The substrate was added at a final concentration of 150 µM for
experiments using V266E and V266H mutants, and 100 µM for experiments using
V266R mutants. The initial velocity was determined as described above and plotted
against the enzyme concentration.
Activation of the V266H mutant at low pH
Procaspase-3(D3A,V266H) (25.2 µM) was dialyzed in 50 mM sodium citrate
containing 1 mM DTT at pH 3.0, 4.0, 5.0, and 5.5 (1:100 volume ratio). After ~16 h of
DTT, and dialyzed for additional ~19 h. In parallel, the protein was dialyzed against
buffer B (pH 7.5, 1 mM DTT) for ~35 h. Fresh DTT was added in the control solution
after ~16 h of dialysis. After dialysis step, the samples were centrifuged to remove
the precipitate, and the concentrations were measured by reading the absorbance at
280 nm. The final concentration of the samples was: 25.2 µM (pH 7.5), 21.8 µM (pH
5.5), 12.4 µM (pH 5.0), 1.9 µM (pH 4.0) and 2.0 µM (pH 3.0). Samples dialyzed at
pH 3.0 and 4.0 formed heavy precipitate after the second dialysis step. The samples
were diluted to 1 µM in assay buffer and the substrate Ac-DEVD-AFC was added at
final concentration of 100 µM. Initial velocity was measured as described above. The
experiments were performed twice.
Granzyme B digestion
Digestion of the procaspase-3(V266H) and procaspase-3(V266H,Y197A) with
granzyme B was carried out in enzyme assay buffer at 37 oC for 2 h at a final
caspase: granzyme B molar ratio of 90:1. Following digestion with granzyme B, the
initial velocity was measured using final enzyme concentrations of 1 nM (caspase-3)
or 10 nM (caspase-3 mutants).
Limited proteolysis with trypsin
Proteins (15-20 µM) were digested with one fifteenth of their concentration
(w/w) of trypsin in Tris buffer pH 7.2 or citrate buffer for pH 5.5-6.0 at 25 °C. After
trypsin was added, aliquots were withdrawn at prescribed time intervals, and