ABSTRACT
SIEBER, MICHAEL DAVID. Influence of Surface Structure on Hydrophobicity of Electrospun Nylon 6 Coated Fabric and Improvement of Durability using Atmospheric Pressure Plasma. (Under the direction of Dr. Xiangwu Zhang and Dr. Marian G. McCord).
The purpose of this work is to utilize atmospheric pressure plasma to increase the adhesion between an electrospun nanofiber layer and a textile substrate. Woven fabric is pretreated in audio frequency glow discharge plasma and mounted on a rotating collector prior to deposition of the electrospun fibers. Both atmospheric pressure plasma and electrospinning can be scaled up to an industrial, continuous process, and promise cost and energy savings relative to many traditional and current textile finishing methods.
In this study, surface structure is shown to significantly affect static Water Contact Angle (WCA) independent of surface chemistry or the use of low surface energy chemical treatments. Repellency is controlled by choice of solution and processing parameters. Nylon 6 (WCA 62.6°) was chosen in this study due to its ease of electrospinning and well-characterized properties. To show the role of structure in surface hydrophobicity, beaded-nanofiber nonwoven webs were electrospun atop a woven Nylon 6,6/cotton military fabric to have static WCA as high as 140.85 ± 2.15°. Repellent coating surfaces such as these could be applied for use as protective fabric coatings or filtration barriers against aerosols and other contaminants.
Martindale rubbing cycles and peeling toughness increased as polymer concentration, flow rate and substrate treatment time increased. This indicated increased interfacial strength between nanofibers and fabric. Substrate effects to plasma treatment were also verified by increased surface wettability using WCA and exhaust dyeing intensity.
Influence of Surface Structure on Hydrophobicity of Electrospun Nylon 6 Coated Fabric and Improvement of Durability using Atmospheric Pressure Plasma
by
Michael David Sieber
A thesis submitted to the Graduate Faculty of North Carolina State University
in partial fulfillment of the requirements for the degree of
Master of Science
Textile Engineering Raleigh, North Carolina
2011
APPROVED BY:
_______________________________ ______________________________ Dr. Xiangwu Zhang Dr. Marian G. McCord Co-chair of Advisory Committee Co-chair of Advisory Committee
________________________________ ________________________________ Dr. Mohamed A. Bourham Dr. Henry Boyter, Jr.
ii
DEDICATION
iii
BIOGRAPHY
iv
ACKNOWLEDGEMENTS
I would like to thank and express gratitude towards my Advisory Committee members: • Dr. Xiangwu Zhang, whose encouraging words while motivating me during
my graduate studies;
• Dr. Marian G. McCord, whose support and advice helped me much in my research;
• Dr. Mohamed A. Bourham, whose technical opinion and expertise inspires me to work harder;
• Dr. Henry Boyter, Jr, whose technical expertise helped me with the organization of research writing.
I also would like to thank many on staff at the College of Textiles, including but not limited to:
• Jeff Krauss, NCSU COT Pilot Plant, for his help with fabrics and dyeing in the Pilot Plant;
• Judy Elson, TECS Laboratory, for guidance with sputter-coating and SEM; • Dr. Julie Willoughby, for the use of her contact angle instrumentation;
• Teresa White, Physical Testing Laboratory, for her help with abrasion testing; • Dr. Russell Gorga, for the use of his Instron test apparatus;
• Angie Brantley, TECS office, for her advice with registration and enrollment issues;
• Patrice Hill, ITT, for much help involving paperwork, internships, and guidance through the many confusing yet necessary steps graduate school seemed to present.
v
TABLE OF CONTENTS
List of Tables ... ix
List of Figures ... x
Chapter 1: Introduction ... 1
1.1 Significance of Study ... 1
1.2 Problem Statement ... 2
1.3 Research Objectives ... 3
Chapter 2: Literature Review ... 5
2.1 Introduction, Related Topics ... 5
2.2 Repellent Surfaces: Does Nature have the Answers? ... 5
2.2.1 Different Natural Superhydrophobic Surfaces ... 5
2.3 Repellent Surfaces: What are the Governing Factors? ... 12
2.3.1 Surface Tension and Contact Angle ... 12
2.4 Roughened Surface Wetting ... 14
2.4.1 Recent Progress with Roughened Surfaces ... 17
2.5 Application of Textile-Based Repellent Finishes ... 18
2.5.1 Textile Wet Finishing ... 18
2.5.2 Repellent Textile Chemistry ... 19
2.5.3 Non-Traditional Repellent Finishes ... 24
2.6 Polymer Finishes using Electrospinning ... 24
2.6.1 Electrospinning of Polymer Nanofibers... 25
2.6.2 Nanofibers in Filtration ... 26
vi
2.6.4 Challenges with Nanofiber Processing ... 29
2.7 Atmospheric Plasma Finishing of Textiles ... 30
2.7.1 Polymer, Textile Surface Needs in Application ... 30
2.7.2 Atmospheric Plasma Surface Modification ... 30
2.7.3 Benefits to Using Atmospheric Plasma with Textile Treatments ... 33
2.8 Summary, Prelude to Experimental Work ... 35
Chapter 3: Development of a Repellent Electrospun Deposition onto Woven Nylon6,6/cotton Fabric ... 36
3.1 Background ... 36
3.2 Experimental ... 36
3.2.1 Materials ... 36
3.2.1.1 Substrate Preparation ... 37
3.2.1.2 Electrospinning Solution Preparation ... 38
3.2.2 Electrospinning Procedure ... 38
3.3 Characterization ... 39
3.3.1 Observed Static Water Contact Angle ... 39
3.3.2 Fiber Characterization ... 40
3.4 Results and Discussion ... 41
3.4.1 WCA Effects ... 43
3.4.1.1 Effect of Concentration on WCA ... 46
3.4.1.2 Effect of Voltage, Flow Rate on WCA ... 46
3.4.1.3 Areal Density Effect on WCA ... 48
3.4.2 Discussion on Nanofiber Characteristics and WCA ... 49
3.4.2.1 Surface Morphology ... 49
vii
3.4.2.3 Web Porosity, Expected WCA with Cassie-Baxter Model ... 56
3.5 Summary, Future Research ... 63
Chapter 4: Plasma Effects on Development of a Durable Repellent Electrospun Textile Surface ... 66
4.1 Background ... 66
4.2 Experimental ... 67
4.2.1 Materials ... 67
4.2.1.1 Substrate Selection ... 67
4.2.1.2 Electrospinning Solution ... 67
4.2.2 Atmospheric Pressure Plasma System ... 68
4.3 Methods... 68
4.3.1 Substrate Preparation ... 68
4.3.2 Plasma Treatment Prior to Electrospinning ... 69
4.3.3 Electrospinning Procedure ... 69
4.4 Characterization of Nanofiber/Substrate Interactions ... 69
4.4.1 Martindale Abrasion ... 70
4.4.2 Interfacial Peel Testing ... 72
4.5 Verification of Evidence of Plasma using Substrate... 76
4.5.1 Contact Angle of Treated Nylon 6,6 Film ... 76
4.5.2 Exhaust Dyeing of Fabrics ... 77
4.5.2.1 Nylon 6,6 Fabric Exhaust Dyeing Procedure ... 78
4.5.2.2 Cotton Fabric Exhaust Dyeing Procedure ... 78
4.5.3 Experimental Design ... 78
4.6 Results and Discussion ... 79
viii
4.6.1.1 Effect of Areal Density with Martindale Abrasion and Peel Tests ... 81
4.6.1.2 Martindale Abrasion Results ... 84
4.6.1.3 Peel Test Results ... 88
4.6.2 Evidence of Plasma Treatment to Substrate Effects ... 91
4.6.2.1 Effect of Plasma using Exhaust Dyeing... 91
4.6.2.2 Effect of Plasma using Static WCA ... 94
4.6.3 Discussion of Results ... 96
4.7 Summary, Future Research ... 99
Chapter 5: Summary of Project Conclusions, Next Steps ... 103
5.1 Conclusions Related to Water Repellency of Electrospun Nanofiber Coatings ... 103
5.2 Conclusions Related to Improved Nanofiber-Fabric Durability Resulting from Plasma Treatment ... 103
5.3 Potential Applications ... 104
5.4 Research Summary, Path Forward ... 105
Chapter 6: References Cited ... 107
Appendices ... 116
ix
LIST OF TABLES
Table 2-1: Force balance between adhesive and cohesive forces. ... 13
Table 3-1: Experimental settings for Nylon 6 coated nanofiber fabrics, varied in order to find factors and levels which maximize observed WCA. Observed average WCA at different experimental settings can be seen within table cells ... 51
Table 3-2: SEM images of nanofiber surface coatings, shown to demonstrate transition of bead-dominated to nanofiber-dominated morphology as concentration increases ... 52
Table 3-3: Average nanofiber diameters of electrospun nanofiber surface coatings, showing nanofiber diameter increasing with polymer concentration increasing from 6-15% ... 55
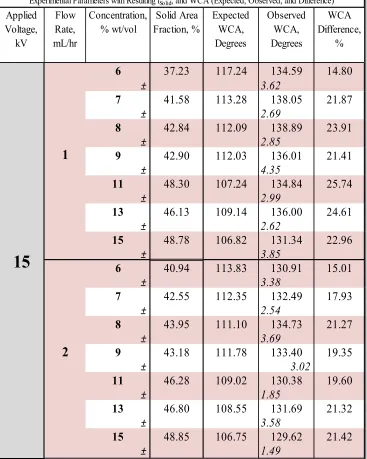
Table 3-4: Nylon 6 solid area fraction (or fSolid) used for calculation of expected WCA, compared to actual WCA observed for experimental factors and levels (shown below). Electrospinning parameters: Polymer concentration (6-15%), applied voltage (15, 17 kV), and flow rate (0.5, 1, 2 mL/hr). Difference (%) of observed-expected WCA is also shown . 57 Table 3-5: Selected morphology of electrospun nanofiber surface coatings prepared by varying experimental parameters: Polymer concentration (7, 15% shown), flow rate (0.5, 1, 2 mL/hr), and applied voltage (15, 17 kV) ... 60
Table 4-1: Experimental parameters used for evaluation of Martindale abrasion: concentrations used were 11-15%, flow rates used were 0.5, 1, and 2 mL/hr respectively. .. 80
Table 4-2: Experimental settings used during Peel test: concentrations used were 11-15%, Flow rates used were 1, and 2 mL/hr respectively. Control substrates were coated and tested for load required to remove web. ... 81
Table 4-3: Static WCA comparison for Nylon 6,6 film treated in Helium and Helium-Oxygen atmospheric plasma ... 95
Table A-1 Polymer Surface Tensions and WCA ... 118
Table A-2: Dimensions and other Constants related to Martindale Abrasion testing ... 120
x
LIST OF FIGURES
Figure 2-1: Lotus leaves on a pond, and water droplets atop a lotus leaf (A, B). SEM images of lotus leaves with different magnifications showing micropapillae and epicuticular wax crystals (C, D). The inset of (D) is of a water droplet on a lotus leaf, having WCA = 161.28° with sliding angle of 3°. ... 7
Figure 2-2: (A) Water droplet on roughened surface having WCA below 90° and high contact angle hysteresis. This displays greater hindrance to rolling and contaminant removal when moving during time (t = 13). (B) Water droplet on roughened surface having
WCA > 90° with low contact angle hysteresis ... 8
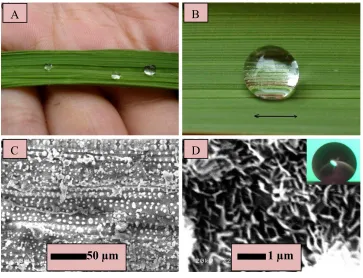
Figure 2-3: Anisotropic surface features of rice leaf (A, B). Water droplets floating on rice leaf. SEM images of rice leaf at different magnification (C, D). Inset of (D) shows WCA profile on a rice leaf to be ~ 157°. ... 9
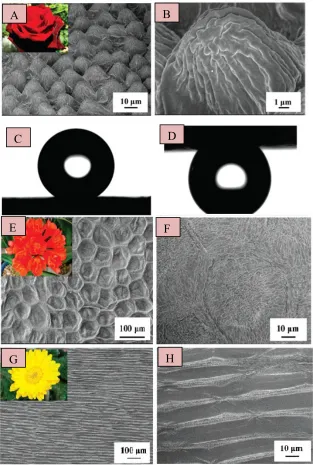
Figure 2-4: Examples of Petal Effect: (A, B) SEM images of rose petal surface, showing hierarchical morphology consisting of micropapillae and nanofolds. (C) Shape of water droplet on rose petal, indicating superhydrophobicity (WCA ~152°). (D) Adhesion of droplet to rose surface when rotated 180°. (E, F) SEM images of surface of Chinese Kafir lily petal showing a periodic array of closely-packed hexagons and helices in two scales.(G, H) SEM images display sunflower morphology being composed of two scales, seen with helical indentions forming a larger parallel array ... 10
Figure 2-5: A water strider’s legs support itself when atop a body water ... 11
Figure 2-6: Model of static liquid droplet on a flat, ideal surface. Equilibrium, or Young’s WCA as denoted by θin the figure, is related to force balance of interfacial tensions (γX-Y) between solid, liquid, and vapor phases. ... 13
Figure 2-7: Example of stearic acid melamine derivative applied as repellent finish ... 21
Figure 2-8: Components of silicone water repellents, which react to form a cross-linked repellent layer for textiles. Hydrogen bonds between siloxane backbone and fabric provide good durability ... 22
Figure 2-9: Perfluoro-containing acrylic polymer, an example of a fluorocarbon-based repellent finish as applied to fiber surfaces ... 22
xi
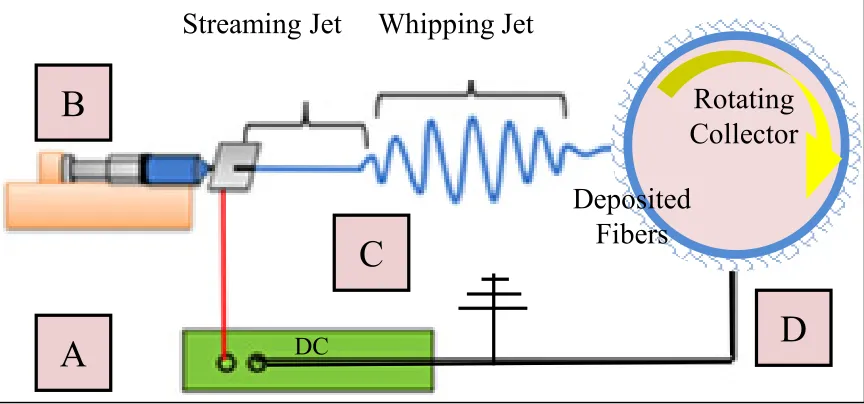
solution traveling across electric potential. The polymer jet deposits fibers onto (D) a
collection apparatus, which can be either grounded or oppositely-charged. ... 26
Figure 2-11: SEM images of as-spun PHBV electrospun beaded-nanofiber morphology at different magnifications: (A) 1 kX magnification; (B) 10 kX magnification ... 28
Figure 2-12: SEM images of as-spun PMMA electrospun fibers with (A) and without (B) surface pore structures ... 29
Figure 2-13: Schematic of atmospheric pressure glow discharge plasma system designed and developed at NCSU.. ... 34
Figure 3-1: Rendering of experimental setup used for electrospinning; shown are charged syringe (A) which displaces polymer solution (B) across electric potential to oppositely-charged or grounded collection apparatus (C). ... 39
Figure 3-2: OCA20 Contact Angle Analyzer for observing surface wettability. ... 40
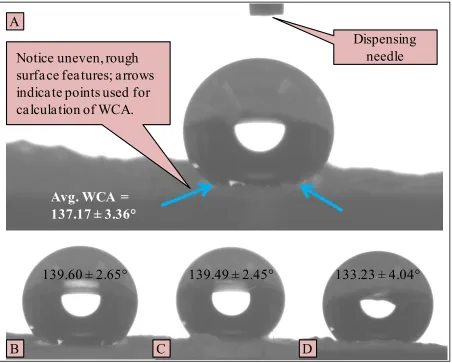
Figure 3-3: Example images of electrospun Nylon 6 nanofiber coating surface profiles with 5 µL droplet; average WCAs included: (A) 6% concentration, 17 kV applied voltage, 2 mL/hr flow rate. (B) 7%, 17 kV, 2 mL/hr. (C) 15%, 0.5 mL/hr, 17 kV. (D) 15%, 17 kV, 1 mL/hr... 43
Figure 3-4: Oneway ANOVA and Student’s paired t-estimates used to compare how experimental factors have effect on observed WCA: polymer concentration (6-15%) (top); flow rate (0.5, 1, 2 mL/hr) (bottom left); and applied voltage (15, 17 kV) (bottom right) ... 45
Figure 3-5: Observed WCA versus concentration (6-15%) for nanofiber surface coatings. Shown are WCA for concentrations having 15 kV applied voltage (left) and 17 kV (right). Electrospinning when having flow rates of 0.5 (purple), 1 (orange), and 2 mL/hr (green) also shown, respectively ... 47
Figure 3-6: Observed WCA versus areal density (g/m2) for nanofiber surface coatings, shown when electrospinning using flow rates of 0.5 (purple), 1 (orange), and 2 mL/hr
(green), respectively ... 49
Figure 3-7: Areal density (g/m2) versus polymer concentration (6-15%) for nanofiber surface coatings, electrospun when varying flow rates of 0.5 (purple), 1 (orange), and 2 mL/hr
(green), respectively ... 50
xii
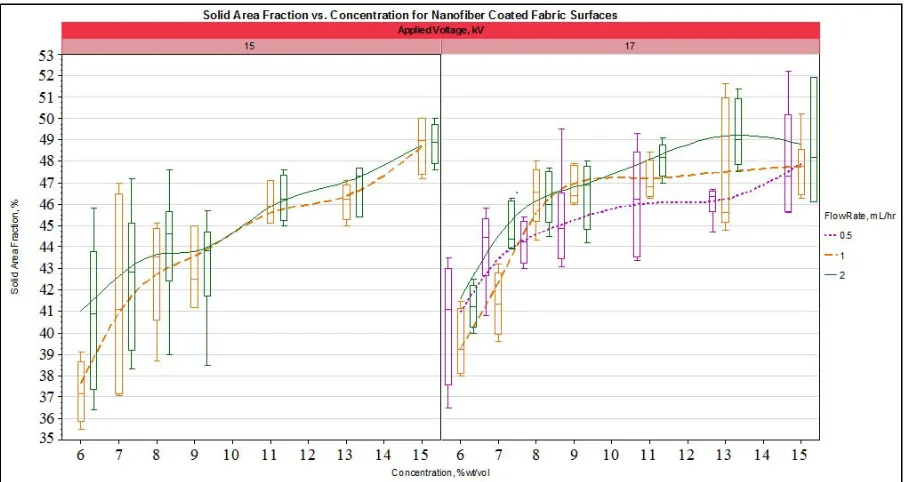
Figure 3-9: Solid area fraction versus concentration (6-15%) for nanofiber surface coatings when having electrospinning applied voltage of 15 kV (left) and 17 kV (right); flow rate of 0.5 (purple), 1 (orange), and 2 mL/hr (green) shown, respectively. ... 59
Figure 3-10: Observed WCA versus polymer concentration (top). Expected WCA was calculated from nanofiber surface porosity using image analysis (bottom). Differences between expected and observed show need for revised model to accurately predict observed WCA. ... 63
Figure 4-1: Martindale abrasion testing apparatus located in NCSU COT, showing mounted samples which oscillate against standard worsted wool fabric abradant. ... 71
Figure 4-2: Sample preparation of electrospun webs for Martindale abrasion testing. These samples are mounted upside-down and oscillate against a standard woolen fabric abradant, with the mounted sample having a minimum pressure of 1.7 kPa, oriented downward. ... 73
Figure 4-3: Example of modified Martindale abrasion failure, which was used as a qualitative classification of nanofiber web durability. This results after oscillatory rubbing motions against standard abradant Martindale; the average number of rubs until failure were recorded as metrics for analysis. Holes in the nanofiber layer are highlighted with orange circles. ... 73
Figure 4-4: Peeling test sample setup in Instron using modified (ASTM D 6862-04) method. This modified test is intended to maintain 90° peel between nanofibers and fabric using the standard tounge tearing method. ... 74
Figure 4-5: Example of peeling test output. Vertical axis (load applied to peel layer from substrate) is expressed in kgf, while horizontal axis (extension) is indicated in mm ... 75
Figure 4-6: Apparatus used for WCA acquisition in NCSU College of Textiles. ... 77
Figure 4-7: Average Martindale rubs versus areal density for coated fabrics electrospun using 11 (cyan), 13 (magenta), and 15% polymer solution concentrations (gold) ... 82
Figure 4 - 8: Average Martindale rubs versus nanofiber areal density for coated fabrics electrospun using 0.5 (purple), 1 (orange), and 2 mL/hr (green) flow rates, respectively. .... 83
Figure 4-9: Average peeling toughness versus nanofiber areal density for coated fabrics electrospun using 1 (orange), and 2 mL/hr (green) flow rates, respectively ... 84
xiii
Figure 4-11: Average Martindale number of rubs until failure versus substrate treatment type for nanofiber coated fabrics: comparing untreated (control) coated fabrics with those treated in Helium and Helium-Oxygen plasmas (applied for 2, 5 min.). Also shown are flow rates of 0.5 (left), 1 (middle), and 2 mL/hr (right), and polymer solutions of 11 (cyan), 13 (magenta), and 15% concentration (gold) varied during electrospinning ... 86
Figure 4-12: Average peeling toughness versus substrate treatment type for nanofiber coated fabrics: comparing untreated (control) coated fabrics with those treated in Helium and
Helium-Oxygen plasmas (applied for 2, 5 min.). Also shown are flow rates of 1 (left), and 2 mL/hr (right), and polymer solutions of 11 (cyan), 13 (magenta), and 15% concentration (gold) varied during electrospinning ... 90
Figure 4-13: Comparison of plasma intensity using exhaust dyeing on 100% Nylon 6,6 fabrics: Shown is K/S intensity spectrum at visible wavelengths comparing control to treated fabric. ... 91
Figure 4-14: Comparison of K/S intensity peaks shown in Figure 4-13 for plasma-treated versus non-treated 100% Nylon 6,6 fabric. ... 92
Figure 4-15: Comparison of plasma intensity using exhaust dyeing on 100% cotton fabric: Shown is K/S intensity spectrum at visible wavelengths comparing control to treated fabrics. ... 93
Figure 4-16: Comparison of K/S intensity peaks shown in Figure 4-15 for plasma-treated versus non-treated 100% cotton fabric. ... 93
Figure 4-17: Comparison of static WCA on control and plasma-treated Nylon 6,6 films. (A) Nylon 6,6 untreated film. WCA average = 66.56°. (B) Nylon 6,6 treated with Helium plasma, 5 minutes. WCA average = 40.71°. (C) Nylon 6,6 film, treated in Helium-Oxygen plasma, 5 minutes. WCA average = 42.53°. ... 95
Figure A-1: WCA versus critical surface tension for various polymers ... 119
Figure A-2: Additional view of Martindale testing apparatus. ... 120
1
Chapter 1: Introduction
1.1 Significance of Study
Development of chemical biological (CB) weapons has become an increasing threat to soldiers, whose personal protective equipment (PPE) includes short-term protective apparel and ocular and respiratory protection. Often are dispersed as aerosols CB agents create the need for liquid and particulate protection incorporated into military uniforms. Current CB protective clothing provides adequate protection yet offer limited breathability.1 Electrospun nanofiber webs layered within a clothing ensemble have been shown to maintain breathability while providing protection from liquid and vapor contaminants.2,3 In addition to military garments these webs can be applied to industrial and civilian clothing for protection against other Toxic Industrial Materials (TIM) and contaminants.
Electrospinning is a simple method employed to produce nonwoven mats or webs composed of micro- and nano-scale diameter fibers. Many polymers have been shown to be capable of electrospinning from solution into nanofiber webs and have extremely high surface area-volume ratios. Nanofiber webs can have high porosity with small individual pore diameters, enabling them to offer good protective barriers against liquids or aerosols. A challenge for nanofiber webs, limiting their integration into textile materials, is the ability to withstand mechanical stresses that are repeatedly incurred during such use.4-6
2
functionality yet can eliminate much of the aqueous application and subsequent thermal curing processes required with many traditional pad-dry-cure finishes.8-11 Surface energy and physical features can be modified without changing bulk properties12,13 to influence wetting or dyeability as well as other properties like adhesion to other surfaces.14-19
1.2 Problem Statement
Repellency of contaminants such as water, oils and solids is important to common acceptance of commercial textile garments, and a matter of significant importance in CB protective clothing. A majority of repellent finishes rely on chemical repellency through low surface energy molecules yet are known to produce harmful environmental effects such as large quantities of wastewater and chemical effluent.8,11,20 In recent years, research on surface wetting has focused on maximizing hydrophobicity through control and modification of submicron-scale physical structure. This concept was first realized through observation of highly-roughened physical features found on many natural surfaces which create repellent or
self-cleaning exteriors, preventing these from interaction with potential liquid and solid contaminants. If enough roughness is present, a hydrophobic solid surface can be created even if using hydrophilic materials.21-26
3
sacrificing breathability,2,34-39 however, a challenge to nanofiber development and production is mechanical durability, resulting in shortened functional lifetime and hindering application. Chemical interactions like covalent bonding between nanofibers and substrate could be made using plasma treatment, enabling better attachment of nanofibers to fabric. Treatment of fabric in plasma before electrospinning deposition could promote interaction when electrospinning onto this surface through addition of polar groups, functionalizing or increasing surface free energy of the fabric.
1.3 Research Objectives
Development of a hydrophobic Nylon 6 nanofiber surface coating to fabric is described in Chapter 3. Here, a polymer nanofiber coating was applied by electrospinning onto military Nylon 6,6/cotton (NyCo) woven fabric. In Chapter 4, atmospheric pressure glow discharge plasmas (APGD) using 100% Helium and 99% Helium with 1% Oxygen were applied to fabrics prior to electrospinning. Coated fabrics were then characterized for effect of increased adhesion or durability of the layer to fabric. The overall project outcome is summarized in Chapter 5 where efforts to combine this highly-porous yet hydrophobic fabric coating with increased interfacial adhesion are reviewed and evaluated.
4
5
Chapter 2: Literature Review
2.1 Introduction, Related Topics
Research surrounding surface wetting and citing many examples of non-wetting surfaces found in the natural world are first discussed in this chapter. Traditional and current water repellent application technologies are reviewed to highlight methods and materials used. Electrospinning and plasma processing will be discussed in detail describing examples of novel or nature-inspired (biomimetic) surface science related to these concepts.
Background regarding traditional and progressive textile finishes verifies the need for continued research using these methods and materials. Many water repellent treatments to fabric surfaces historically have been inefficient and chemical-intensive processes, which produce excess effluent and create environmental concerns.40 Recent improvements in the application of novel textile finishes could lessen the long-term costs and environmental impact for the producer as well as the consumer.
2.2 Repellent Surfaces: Does Nature have the Answers?
2.2.1 Different Natural Superhydrophobic Surfaces
6
surface attributes resulting from superhydrophobicity. On superhydrophobic surfaces, drops of water will have static water contact angle (WCA) of at least 150° and remain almost spherical.41,42 Some of these surfaces allow easy roll-off and removal of spores, dirt, or dust particles in their path.43-47 Different physico-chemical surface composition creates a range of superhydrophobic surfaces found on leaves. Different morphological phenomena affect wetting properties of leaves found on Alchemilla vulgaris (lady’s mantle),26,34 Senecio
cineraria (silver ragwort),34 Nelumbo muciferea (lotus),48 Oryza sativa (rice),49 and Rosea
rehd (rose).50
Superhydrophobic plant surfaces exhibit two defined microroughness scales which in combination enhance roughness, lower wettability and thus prevent adsorption from foreign contaminants. Different morphological features like concave or convex protrusions with arrays of epicuticular wax crystals are seen in Figure 2-1 with the lotus plant and numerous other leaves. When compiling and documenting surface roughness of many plants, Neinhuis and Barthlott in 1997 defined the Lotus Effect, which classifies highly-roughened surfaces characteristic of many plants that allow easy sliding and removal of liquids, solids, and other contaminants.51 These self-cleaning surfaces have low contact angle hysteresis, measured as the difference of advancing (θA) and receding (θR) WCAs. Figure 2-2 shows how θA and θR
7
Figure 2-1: Lotus leaves on a pond, and water droplets atop a lotus leaf (A, B). SEM images of lotus leaves with different magnifications showing micropapillae and epicuticular wax crystals (C, D). The inset of (D) is of a water droplet on a lotus leaf, having WCA = 161.28° with sliding angle of 3°.48
Leaves of plants, i.e., rice, demonstrate an anisotropic version of the Lotus Effect.
Figure 2-3 shows alignment of rice leaf surfaces, where aligned papillae atop parallel fibers create anisotropic roughness and direct fluid flow along their length.49 Figure 2-4 shows the
Petal Effect of red rose petals as well as Clivia miniata (Chinese kafir lily), and Helianthus annuus (sunflower), recently discovered by Feng et al.50,52,53 The Petal Effect defines surfaces having similar static wetting as the Lotus Effect, but with different dynamic wetting due to strong adhesive force that develops between surface and droplet. Surprisingly, lady’s mantle leaves are superhydrophobic macroscopically resulting from very hairy, rough
A B
C D
8
surfaces. Contact angle measurements of single hairs show hydrophilic wetting properties individually (WCA < 90°). The hairy surfaces of lady’s mantle illustrate how a hydrophilic surface found in nature can have superhydrophobic properties through roughness-induced wetting.25,26
Figure 2-2: (A) Water droplet on roughened surface having WCA below 90° and high contact angle hysteresis. This displays greater hindrance to rolling and contaminant removal when moving during time (t = 13). (B) Water droplet on roughened surface having WCA > 90° with low contact angle hysteresis. Low sliding angle displays self-cleaning properties characteristic of Lotus Effect. Water droplets on these surfaces slide easily during time (t = 13).
The animal kingdom also provides many examples of superhydrophobic surfaces. The feet of a gecko display patterned, nanostructured roughness which provide superhydrophobic properties with high interfacial tension, much similar to a rose petal. One species of gecko (Coleodactylus amazonicus, or pygmy gecko) is even capable of locomotion atop water.48,54,55 Many insect surfaces are non-wetting and can prevent from drowning or
A B
t = 2
9
assist with locomotion. A single hind leg of Gerris remigis (water strider), the insect shown in Figure 2-5 can support over 15 times its own mass, while a common mosquito leg (Culicidae family) can support over 23 times its mass and has a static WCA over 153˚.56,57
Figure 2-3: Anisotropic surface features of rice leaf (A, B). Water droplets floating on rice leaf. SEM images of rice leaf at different magnification (C, D). Inset of (D) shows WCA profile on a rice leaf to be ~ 157°.49
Magnification of many insect exoskeleton surfaces show needle-shaped hairs or microsetae, having fine nanometer-scale grooves patterning each seta. These grooves create a plastron layer (surrounding layer of air) if immersed and prevent interaction with contacting water.41,58
A B
C D
10
Figure 2-4: Examples of Petal Effect: (A, B) SEM images of rose petal surface, showing hierarchical morphology consisting of micropapillae and nanofolds. (C) Shape of water droplet on rose petal, indicating superhydrophobicity (WCA ~152°). (D) Adhesion of droplet to rose surface when rotated 180°. (E, F) SEM images of surface of Chinese Kafir lily petal showing a periodic array of closely-packed hexagons and helices in two scales. Different features of micro- and nanoroughness at low and high magnification. (G, H) SEM images display sunflower morphology being composed of two scales, seen with helical indentions forming a larger parallel array.50
A B
C D
E F
11
Figure 2-5: A water strider’s legs support itself when atop a body water. The very rough surface features of the legs form a plastron layer, a thin layer of air that develops at the leg-water interface, minimizing interaction with the water.56
12
2.3 Repellent Surfaces: What are the Governing Factors?
2.3.1 Surface Tension and Contact Angle
As mentioned, a water repellent or hydrophobic solid surface is one that can resist wetting by a mass of water (when a water droplet has static WCA greater than 90˚). W ater contact angle (θ), is associated with the surface energy or force balance related to liquid-, solid-, and vapor-phase contact lines. Figure 2-6 and Table 2-1 show relationships between surface tensions and contact angle. Thomas Young62 first defined the relationship between surface tension and contact angle while investigating capillary phenomena. Young’s equation relates wetting of an ideal or perfectly flat, homogenous solid surface to solid, liquid, and gas phase component surface energy or surface tension (expressed in dyne/cm or N/m). Dependent upon molecular species the equation presents a unique contact line resulting where all three phases meet. Interaction between cohesive and adhesive forces determines extent of wetting (how a liquid will spread over a surface) showing WCA as a function of total system energy. Later revised, the Young-Dupré equation explains surface tension through the balance of surface energy components62 as seen in Figure 2-6 and Table 2-1.
13
Figure 2-6: Model of static liquid droplet on a flat, ideal surface. Equilibrium, or Young’s WCA as denoted by θ in the figure, is related to force balance of interfacial tensions (γX-Y) between solid, liquid, and vapor phases.
Table 2-1: Force balance between adhesive and cohesive forces. As interactions increase between solid and liquid phases, contact angle decreases. Decreasing contact angles indicate increased surface wetting ability.
Contact Angle, θ Wettability Solid/Liquid Interaction Liquid/Liquid Interaction
θ = 0° Perfect Wetting Greatest Weak
0 < θ < 90° High Wettability Strong Weak-Medium
90 < θ < 180° Low Wettability Weak-Medium Strong
θ = 180° Nonwetting Weak Greatest
If a surface is hydrophobic, then the WCA of a droplet will be greater than 90°, while smaller contact angles and higher surface energy are characteristic of hydrophilic materials. Water has inherently high surface energy; it is polar and forms Hydrogen bonds. The following equation provides the relationship for Young’s contact angle, or equilibrium contact angle (θEquil):
γ
Solid-Liquidγ
Liquid-Vaporγ
Solid-VaporVapor
Solid
Liquid
14
𝐶𝑜𝑠𝜃𝐸𝑞𝑢𝑖𝑙 = γ𝑆𝑉γ− γ𝑆𝐿 𝐿𝑉
where γSL, γLV, and γSV are three interfacial tension components existing between solid and
liquid, liquid-vapor, and solid-vapor, respectively. The revised Young-Dupré equation states that neither γSV nor γSL can individually be larger than the sum of the other two respective
surface energies. Since γSV= γSL+ Cos θ * γLV,
If γSV > γSL+ γLV, complete wetting will occur (Cos θ = 0˚). And,
if γSL> γSV+ γLV, zero wetting will occur (Cos θ =180˚).
The Young equations for equilibrium or microscopic WCA assume a perfectly flat surface; in many real-life cases, imperfect surfaces exhibit surface roughness or other impurities which skew this assumption. In order to more accurately characterize the surface of a textile or other rough surface, a more complex model is necessary.63,64
2.4 Roughened Surface Wetting
15
characteristics found in nature have been divided into two primary wetting models for these roughened or non-ideal surfaces. The first method identified and quantified general roughness-induced wetting, proposed by Wenzel in 1936.65 In 1945, Cassie and Baxter observed that a layer of air can form between a liquid droplet atop a highly-roughened solid surface when in their experiments using many repellent textile and naturally-found surfaces. A Cassie-Baxter composite or heterogeneous wetting surface is one in which the total area contacting a liquid is composed of both solid and air (vapor) components.66 These surfaces differ from Wenzel or homogeneous wetting surfaces in which the solid area underneath a droplet is completely wetted. Recent discoveries utilizing these models have led to the development of superhydrophobic surfaces created out of inherently-hydrophilic molecules while possessing necessary physical characteristics.21,23-26,67
Many polymeric material assemblies, i.e., a fabric, would be inaccurately modeled if using the Young equation for equilibrium or intrinsic contact angle. The Wenzel model describes a homogeneous roughened surface, where a liquid completely wets or fills the grooves of a roughened surface.63,64,68,69 Wenzel showed that the intensity of surface free energy was proportional to the respective surface area in contact with a liquid. He quantitatively defined surface roughness as r, the ratio of true area wetted over apparent area wetted. For a hypothetical roughened surface, r > 1. With fabrics this roughness can occur from a surface exhibiting a structural network which increases surface area in contact with the droplet. The Wenzel apparent contact angle,θW, results from this ratio:
16
where θEquil is denoted as the Young’s, equilibrium, microscopic, or inherent WCA for a
given molecule composing the fiber surface. Apparent surface roughness is measured using profilometry to quantify surface areas that compose r. The Wenzel equation proposed that as
r increases, apparent contact angle increases proportionally, showing that surface area contributes significantly to apparent contact angle. Within the geometric features of the roughened surface, individual menisci form between solid and liquid which have a microscopic contact angle dependent on molecular structure.22 If roughened patterns are small enough γSolid-Liquid (solid-liquid surface tension) will be minimized, resulting in a high
fractional area of air in contact with the liquid body preventing liquid from penetrating or completely wetting a surface. This development of air pockets defines features created by a heterogeneous wetting surface. The critical contact angle (θCritical) at which air pockets
develop and resist wetting or impregnation of surface features, is shown by:
𝐶𝑜𝑠𝜃𝐶𝑟𝑖𝑡𝑖𝑐𝑎𝑙 = 𝑓𝑟 − 𝑓𝑆𝑜𝑙𝑖𝑑−1 𝑆𝑜𝑙𝑖𝑑
The fraction of solid touching the liquid at the interface is denoted fSolid. The apparent WCA
at or above θCritical for a given molecular γSolid-Liquid is the transition from homogeneous to
heterogeneous wetting.22,58,70 The contact angle of a heterogeneous surface can be modeled using the Cassie-Baxter apparent WCA, (θCB):
17
Cos θCB = fSolid (Cos θEquil+ 1) - 1.
In this model, fAir is the fraction of the total surface area of the liquid that is in contact
with air, where fSolid + fAir = 1. The Cassie-Baxter model proves that surface heterogeneity
contributes to a material’s apparent contact angle and, in maximizing, this can effectively create superhydrophobic surfaces even from such hydrophilic materials.
2.4.1 Recent Progress with Roughened Surfaces
Historically, all superhydrophobic surfaces were thought to have resulted from hydrophobic substrates and respective surface structures. However, recent studies show that roughness can also lead to a superhydrophobic contact angle even from a hydrophilic substrate.49 Since its introduction, this concept has been found to be similar to findings regarding Wenzel and Cassie-Baxter wetting models. The Lotus and Petal Effects model superhydrophobic surfaces which have low and high contact angle hysteresis, respectively. Their surface features create different Laplace pressure (internal-external differential air pressure) gradients and have similar static wetting but dramatically different dynamic wetting properties, resulting from different patterns of surface roughness.
18
decorated in Gold nanoparticles (Gold WCA ~ 70°). Studies published by Nosonovsky,64 Patankar,23,24 and Liu49 have shown that the degree of wall steepness of a cavity or abscess directly relates to the internal-external differential or Laplace air pressure that is created to support a droplet for heterogeneous wetting. Also, contributing factors are height, spacing, and diameter of the elevated surface features fabricated. Otten and Herminghaus25,26 studied the roughness of the lady’s mantle leaf, creating a superhydrophobic surface using a roughened hydrophilic material structure. They also fabricated molds of these profiles using wax for contact angle modeling. Material surfaces composed of molecules having θEquil < 90°
have been found to require re-entrant structures or some extent of overhang to create a Cassie-Baxter heterogeneous wetting surface area composed of both solid and air beneath a droplet. The suggestion has been made by Ma et al28,34-36 that a nanofiber web-based nonwoven structure is ideal from which to create such a network of cavities and could be easily fabricated or transformed from a hydrophilic material into a superhydrophobic surface.
2.5 Application of Textile-Based Repellent Finishes
2.5.1 Textile Wet Finishing
19
treated, or recycled. Globally, as water prices continue to rise, wastewater treatment prices are rising in proportion.71 Wastewater is expensive since it often produces chemical effluent which must be removed or neutralized before being released into the environment. Textile finishing chemicals like salts, surfactants, dispersants, emulsifiers, or other chemicals commonly found in textile processing wastewater, often have high aquatic toxicity. These chemical effluents are restricted in the way in which they are released from a processing plant.72 If organic solvents are used they are expensive and can require certain types of personal protective equipment (PPE) due to the risk of health hazards to workers, and also environmental concerns related to waste disposal. Many organic solvents used in textile wet processing have restrictions pertaining to their use. Another significant disadvantage of textile wet processing is the potential and volume of waste produced. Solutions used in finishing often can contain chemical auxiliaries, like dispersing agents, to aid in the finishing applications.71 Many chemicals are wasted when remaining finishing baths are drained, whereas, many dry application methods, like plasma treatments, cause little to no chemical or water-related waste.
2.5.2 Repellent Textile Chemistry
20
At standard room temperature and humidity, water has wetting tension of 32 dyne/cm. To effectively repel, the wetting tension or surface free energy of a fabric finish must be below this amount.73
Historically, water repellent textiles were produced with the use of heat, by which a molten hydrocarbon, like soft paraffin wax, was applied to the surface of a fabric. In Appendices 1 and 2, Table A-1 and Figure A-1 list many polymer contact angles and surface energy, showing the WCA for paraffin to be around 109°, resulting from its hydrocarbon backbone. This also enables them to bond to many textile surfaces, providing hydrophobicity yet hindering fabric breathability.33 Improved types of these finishes emulsified paraffin wax in water with stearic acid salts. Once emulsified, the waxy portion of the molecules would be hydrophobic and repel water, with fatty acid portions attracted to the fabric surface. Stearic acid-applied paraffin wax finishes had poor durability, created several toxic reaction products, and required the longest treatment time of any repellent treatment. In an attempt to overcome the disadvantages of waxes emulsified with stearic acid, melamine-based water repellents were developed. These repellents are formed by reacting stearic acid and formaldehyde with melamine. An example of these types of finishes is shown in
Figure 2-7.
21
water repellency, while silanol and silane components react during drying processes to form a cross-linked network, increasing the finish durability. Silicone water repellents require minimal application (< 1 % owf) and provide good garment properties such as soft texture and appearance. Disadvantages to silicone repellents include decreased fabric mechanical properties and toxicity of wastewater.
Figure 2-7: Example of stearic acid melamine derivative applied as repellent finish.11
22
Figure 2-8: Components of silicone water repellents, which react to form a cross-linked repellent layer for textiles. Hydrogen bonds between siloxane backbone and fabric provide good durability.11
Figure 2-9: Perfluoro-containing acrylic polymer, an example of a fluorocarbon-based repellent finish as applied to fiber surfaces.11
23
1% owf), and require low drying time for treated fabrics; however, they are expensive and cause environmental concern due to production of carcinogenic fluorocarbon derivatives. Exhaust air of the drying and curing processes with fluorocarbon finishes account for high amounts of volatile organic compounds dispersed by facilities as aerosols. Certain fluorocarbon finishes degrade to form perfluorooctanoic acid (PFOA), which is of great environmental concern due to its low degradation rate and its potential for bioaccumulation; hence, the U.S. Environmental Protection Agency (EPA) has taken measures to limit emission of PFOA aerosols.72
Effluent created from applying most repellent finishes bioaccumulates in water and is toxic to marine life because it bonds with Oxygen molecules present in water. Many garment repellent treatments result in decreased garment breathability, i.e., sweat cannot escape from the body, creating a burden to the user.76 A number of new finishing surface modification methods have been produced over time, including plasma-based processes. Over time, improved finishing techniques like those using plasma have evolved and now help modify textile surfaces while maintaining breathability, minimizing water usage, and producing less hazardous products during processing.
24
or other surface modification techniques, net process energy, time, and water could potentially be reduced.
2.5.3 Non-Traditional Repellent Finishes
2.6 Polymer Finishes using Electrospinning
Two general methods have been identified to create superhydrophobic surfaces where surface modification can occur through the use of (1) low surface energy chemicals, and by (2) highly-roughened surfaces.63,77 Many examples of both of these techniques have been applied using natural and synthetic textile materials, with many involving electrospinning of various polymer fibers. The novel approaches related to electrospinning seem to provide many possible products utilizing biomimicry. Products such as polymeric membranes or other barrier materials, chemical and biological protective materials, and biomaterial implants or drug delivery devices are potentially applicable if applying biomimicry to electrospinning. Water repellency with electrospun fibers using many different polymers could be fabricated through control of solution or processing parameters. When using a polymer of known solid-liquid interfacial tension (γSolid-Liquid), nanofiber surfaces can
25
2.6.1 Electrospinning of Polymer Nanofibers
Electrospinning utilizes a high electric field that can create fibers with nanometer diameters, if desired, making it an increasingly popular method capable of producing continuous fibers and imparting many different properties depending on the desired product. With a typical electrospinning setup, a polymer of high molecular weight in solution with solvent is subjected to a high voltage. The charged polymer solution is propelled in a jet out from a capillary across the electric field created by the voltage potential, resulting in significant decrease of jet diameter through whipping instability. The whipping action can decrease the diameter of the jet by over 103 times from its initial diameter at the capillary tip.78,79
26
arrangement, creating a nonwoven web or mat. Electrospinning is considered a form of nonwoven spinning though alignment of fibers is possible with specific experimental setups.
Figure 2-10: Simple electrospinning schematic: Shown are (A) high-voltage power supply connected to a syringe (B), and (C) respective streaming and whipping jet regions of polymer solution traveling across electric potential. The polymer jet deposits fibers onto (D) a collection apparatus, which can be either grounded or oppositely-charged.
2.6.2 Nanofibers in Filtration
Nanofibers can exhibit a range of useful properties when compared to other, conventional nonwoven fabric constructions. For electrospun nanofiber mats, characteristics such as low density, large surface area, high pore volume, and small pore size make these appropriate for a wide range of filtration applications. Nanofibers have significant potential for use in ultrafine filters compared with many other nonwoven constructions since
A
C
D
B
Streaming Jet Whipping Jet
DC
Rotating
Collector
27
nanofibers have substantially greater surface areas and have smaller micropores. High porosity and large surface area make nanofibers ideal for filter applications such as blocking hazardous aerosols or other submicron particles. If combined with other fabric products, nanofibers could be used as aerosol filters, facemasks, and protective clothing. Developmental industrial and military fabrics have been enhanced using nanofibers as a functional layer within a multilayered composite fabric designed to protect against Chemical-Biological (CB) and thermal hazards.1,3,27,80,81
2.6.3 Superhydrophobic Electrospun Nanofibers
Electrospun fibers are seen throughout related literature to exhibit significantly useful properties in a variety of applications due to their high surface area. Likewise, surface area/volume ratio of nonwoven electrospun nanofiber webs can enable polymer surfaces to have highly-hydrophobic properties, which is not limited to electrospinning of hydrophobic surfaces using hydrophilic polymers, currently being reported in several studies. Zhu et al21 electrospun superhydrophobic surfaces having a porous, beaded nanofiber morphology with smaller pores present on individual fibers and beads, as seen in Figure 2-11. This experiment was performed using the polymer poly(hydroxyl butyrate co-valerate) (PHBV, WCA ~ 70°) in solution with chloroform. WCAs as high as 158.1° with a sliding angle of 7° were reported.
A research group at MIT, led by Gregory Rutledge, found that electrospinning beaded nanofibers of poly(methyl methacrylate) (PMMA, θEquil = 70°), with chloroform as solvent,
28
average WCA ~ 147˚.35 These PMMA porous nanofibers are seen in Figure 2-12. Other studies displaying overhanging or re-entrant structures can be seen which create similar contact angles using hydrophilic materials.
Figure 2-11: SEM images of as-spun PHBV electrospun beaded-nanofiber morphology at different magnifications: (A) 1 kX magnification; (B) 10 kX magnification.21
When creating high surface areas, many natural materials repel water and effectively maintain self-cleaning properties, proving that surface chemical composition corresponding to γSolid-Liquid is not the most critical factor. Natural and prepared surfaces mentioned in this
review demonstrate dual-scale hierarchal structure consisting of microspheres and nanofibers which display heterogeneous wetting behavior, essential for attaining high WCA.82 Several examples of polymer nanofibers electrospun with beaded nanofiber, nonwoven features have been found to exhibit similar qualities found in self-cleaning plant and animal surfaces throughout the natural world.52,83 These micro- and nano-scale structural features can be quickly fabricated using a simple technique. Beaded nanofiber morphology can be electrospun onto fabrics to provide a repellent surface coating while mitigating subsequent
29
process steps. If newer water repellent techniques using biomimicry were applied, they could be utilized to repel water and maintain clean surfaces to prevent interaction with foreign matter like soil contaminants, CB aerosols, or other TIMs.1,2,55
Figure 2-12: SEM images of as-spun PMMA electrospun fibers with (A) and without (B) surface pore structures. Note that scale bars in larger images are 1 µm while inset images have 10 µm scale bars.35
2.6.4 Challenges with Nanofiber Processing
Compared to conventional fibers manufacturing techniques, the process of making nanofibers is quite expensive due to the low production rate and high capital cost of updating for improved industrial application. In addition, evaporated solvent vapors resulting from the electrospinning process require recovery or proper disposal of chemicals, posing potential environmental hazards. Mechanical properties are naturally low for nanofibrous materials due to their small dimensions, and many result in easy damage or effective failure. Many electrospun nanofibers perform well in laboratory settings but fail to provide applicability for real-world use. Because of the exceptional qualities electrospun nanofibers provide, there is
30
tradespace between factors related to nanofiber production capabilities, environmental impacts, and mechanical properties limiting applicability. Even though these factors all are the focus of related nanofiber literature, all are currently limiting factors which inhibit viability in usable application and implementation by industry currently.
2.7 Atmospheric Plasma Finishing of Textiles
2.7.1 Polymer, Textile Surface Needs in Application
The use of plasma has become a well-established, versatile technology for modifying polymer surfaces for which less water and production time are required than traditional pad-based finishing. Material surface characteristics can be tailored to meet specific requirements when appropriate choice of plasma composition and process conditions are incorporated. Such processes are able to be performed using dry conditions without high consumption of energy, raw materials, or pollutant creation.8,9,84 The cost of new environmental laws has motivated researchers to improve or even replace some textile finishing steps. One type of finishing process now popular with textile materials applies nonthermal plasma at atmospheric pressure to modify these surfaces without using wet chemistry.
2.7.2 Atmospheric Plasma Surface Modification
31
other related surface energy increases, can result from using atmospheric plasma.86-89 Atmospheric plasma systems require less capital than earlier plasma technologies requiring ultralow pressure conditions, which this suits the application needs of the textile industry, since these systems have become a viable option for finishing use.
Organic material surfaces are best suited for processing using weak plasmas (lower temperatures) characteristic of atmospheric pressure than those at requiring a vacuum, which create higher plasma intensities. Organic materials suffer from excessive degradation if exposed to excessive energy or vacuum plasma. Organic materials are better suited for modification using low temperature plasmas due to their amorphous and crystalline nature which requires less energy to modify. Highly-organized, rigid inorganic surfaces require a higher plasma intensity to be rendered reactive. Inorganic material surfaces, therefore, are more commonly treated using stronger plasmas operating at lower pressure, like that in a vacuum. For both vacuum and atmospheric pressure plasmas, these treatments modify the top layer of both inorganic and organic surfaces in the angstrom (Å) to nanometer (nm) range, or 10-10-10-9 m.
32
plasma. Gas molecules become excited and reconfigure into a variety of free radicals. These radicals bombard the surface and increase its polarity through distributing available bonding sites. When treating with the aim of gaining large increases in surface energy, defects to the substrate, such as surface degradation and accelerated treatment decay, sometimes can occur with corona discharges resulting from nonuniform discharge. Another disadvantage is that corona treatment decays rapidly with handling and age, especially when in humid environments. Deionization during processing may be needed as well, resulting from static buildup.
Dielectric barrier discharge systems employ an AC audio frequency from 1-100 kHz, with high voltage usually less than 20 kV applied across parallel metal electrodes coated in a capacitive shroud. Helium is required as a component of the working atmosphere usually, in order to prevent arcing with DBD plasma systems. Other source gases like Argon, Oxygen, Nitrogen, or fluorinated gases can be added to the working atmosphere to generate enhanced surface reactions, like etching effects or surface repellency. Monomer application, prior to the use of plasma, can promote graft and cross-linking which occur from induced polymerization, enhancing durability and fixation of surface finishes.
33
are required. By employing these techniques, plasma equipment has been shown to produce finishes which rival properties produced using traditional pad-dry-cure finishing processes.
2.7.3 Benefits to Using Atmospheric Plasma with Textile Treatments
After the plasma is applied, the surface is modified with many active radical species produced on the surface. Three processes can occur when free radicals bombard the surface of polymer substrates:
(1) Etching/Ablation: Surface cleansing caused by removal of the outer molecular layer of substrate.
(2) Cross-linking: Induced chemical bonding and joining of long-chain molecules, creating a more interconnected, network-type structure.
(3) Activation: Changes in molecular surface energy or functionality can be caused by the impartation of reactive molecules from the ambient atmosphere.
Polar groups, like carbonyls and hydroxyls on the surface, increase in number during plasma treatments, due to the presence of Oxygen in ambient atmosphere. Surface tension is composed of polar and dispersive components. The polar component is modified most significantly which lowers γSolid-Liquid of textile and polymer surfaces after exposure to
34
adhesion. Molecular species used as dyes, inks, coatings, adhesives, or other specific functions are able to flow better and adhere more uniformly than prior to plasma treatment. Free radicals formed on the surface provide sites for adhesion of the desired molecule to the surface.
Figure 2-13: Schematic of atmospheric pressure glow discharge plasma system designed and developed at NCSU. The capacitively-coupled discharge consists of two parallel copper electrodes embedded within a polycarbonate insulator. Specimens are placed between the electrodes and exposed to plasma while in ambient atmosphere.
35
plasma-based finishing processes cause environmental concerns due to decreased water consumption and waste. Conventional techniques used for textile finishing require chemical padding, evaporation of water applied, and thermal curing. The employment of recent plasma processes in industry has initiated a decline in the cost of necessary capital for production facilities. Combined with cost savings from a decrease in waste production and use of resources, plasma processes may result in long-term efficiencies for producers, consumers, and the environment.
Plasma treatment is powerful, provides the ability for specific and predictable surface functionalization, and can meet demanding or specialized requirements. Plasma treatment will continue to be a primary topic of polymer surface treatment technologies and methods.
2.8 Summary, Prelude to Experimental Work
36
Chapter 3: Development of a Repellent Electrospun Deposition onto
Woven Nylon6,6/cotton Fabric
3.1 Background
Electrospun nanofibers have been found to provide extreme properties for a variety of applications by utilizing their high surface area/volume ratios. Repellent garment surfaces have long been a popular concept; such surfaces, traditionally, have resulted from using low surface energy chemical treatments, applied using wet processing techniques. Historically, these treatments have been shown to use large amounts of water, energy, chemistry, and/or time.11,20,71,92 The goal of this study was to use a quick and simple process that yielded effective water repellent coatings on a woven fabric.
The first intent of this project was to examine the effect of nanofiber properties on apparent WCA. Keeping substrate and deposited polymer constant, the goal was to maximize WCA by variation of material and process variables. Discussion starting in Section 3.4 incorporates related roughened surface wetting research in an attempt to explain possible surface phenomena creating high apparent WCA nonwoven surface coatings.
3.2 Experimental
3.2.1 Materials
37
similar concepts should be applied to other nanofiber fabric coatings in later research. Depending on desired application, many potential polymers and substrate combinations could be studied.
The commonly used polymer Nylon 6 has been electrospun in many studies.2,5,93-100 Known for processing ease, Nylon 6 can produce very small fiber diameters using melt extrusion and solution spinning techniques, the chemistry of which allows it to be tailored for specific purposes, resulting in a good platform material for many functional electrospun surfaces. By using Nylon 6, several solution and process parameters are varied in order to obtain different surface morphologies. The U.S. Army Combat Uniform (ACU) ripstop woven Nylon 6,6/Cotton (NyCo) fabric was used as the experimental substrate to demonstrate its use with a current, commonly-fielded military garment lacking protection from liquid and aerosol contaminants.1,3,27,80
3.2.1.1 Substrate Preparation
38
3.2.1.2 Electrospinning Solution Preparation
Nylon 6 pellets and 2,2,2-Trifluoroethanol (TFE) which was used as solvent were acquired from Sigma-Aldrich and used without further modification. Solutions with concentrations made ranging from 3 to 15% (wt/vol) of Nylon 6/TFE were made, and left to stir overnight before electrospinning onto fabric.
3.2.2 Electrospinning Procedure
39
Figure 3-1: Rendering of experimental setup used for electrospinning; shown are charged syringe (A) which displaces polymer solution (B) across electric potential to oppositely-charged or grounded collection apparatus (C).
3.3 Characterization
3.3.1 Observed Static Water Contact Angle
Using static contact angle, WCA is found in this study using the American Society for Testing and Materials (ASTM) D 5946-09 sessile drop method. Using a 5 µL water droplet, contact angle was measured after being in contact with the surface for 30 seconds.73 Averages were created for each specimen from eight measurements using a model OCA20 Contact Angle System Goniometer (FDSC),101 which can be seen in Figure 3-2.
A C
40
Figure 3-2: OCA20 Contact Angle Analyzer for observing surface wettability.101
3.3.2 Fiber Characterization
Nanofiber mats were weighed to acquire areal mass density (g/m2) deposited onto the fabric surface. Observed areal density was used for comparison with theoretical areal density for each experimental parameter, which assumes 100% nanofiber deposition onto the fabric. Six 3 X 3 cm measurements were recorded in different locations chosen randomly for each experimental sample.
41
measurements were made with each sample to determine the mean nanofiber diameter and standard deviation. If beads were present, they were measured for diameter; yet, standard deviations were not taken into account since every specimen could not yield 50 measurements.
Porosity characteristics were also calculated using ImageJ. Porosity was measured by converting SEM images into grayscale, where the fibrous area was differentiated from the void area. Porosity values were determined as a percentage of the void area with respect to the total area of the mat. The layer of visible fibrous mat was considered as the total solid area in contact with a water droplet. According to Wenzel homogeneous wetting behavior, a droplet is assumed to contact the total area apparent. Porous nanofiber mats were calculated to have solid area fraction (fSolid), and assumed as a theoretical percentage of solid surface in
contact with a droplet. Solid area fraction was used in calculating expected heterogeneous or Cassie-Baxter apparent contact angle due to the porous nature of nanofiber surfaces. Calculation of solid area fraction was performed using ImageJ using three samples were acquired at each experimental specimen to find average expected WCA using Cassie-Baxter's formula. Expected WCA was used to compare against observed WCA for each specimen. Using the two wetting models these assumptions were used to help explain wetting properties of experimental Nylon 6 nanofiber webs, in order to explain the observation of apparent WCAs observed.
3.4 Results and Discussion
42
43
Figure 3-3: Example images of electrospun Nylon 6 nanofiber coating surface profiles with 5 µL droplet; average WCAs included: (A) 6% concentration, 17 kV applied voltage, 2 mL/hr flow rate. (B) 7%, 17 kV, 2 mL/hr. (C) 15%, 0.5 mL/hr, 17 kV. (D) 15%, 17 kV, 1 mL/hr.
3.4.1 WCA Effects
Independent of flow rate and voltage factors, initially it was found that lower concentrations seemed to provide higher observed contact angles, as seen in Figure 3-4; here, analysis of variance (ANOVA) and paired Student’s t-estimates are used to compare
Notice uneven, rough
surface features; arrows
indicate points used for
calculation of WCA.
B
C
D
A
Dispensing
needle
Avg. WCA =
137.17 ± 3.36°
44
mean WCA for each concentration between 6-15%. In this figure, concentration can provide statistically-different mean WCAs for the nanofiber layers, determined from having a paired Student’s t-estimate of 1.9687. Also included in this figure are ANOVA and paired Student’s t-estimates for flow rate and applied voltage. These paired mean estimates also exhibited statistically different means, having respective t-estimates of 1.9686 (flow rate) and 1.99685 (applied voltage) when using 95% confidence.
45
46
3.4.1.1 Effect of Concentration on WCA
A table of average WCA values for electrospun surfaces is included and can be seen in Table 3-1. Average surface coating WCAs displayed maximum values between 6 and 8% for 15 and 17 kV depending on applied voltage and flow rate. Nanofiber WCA data is plotted visually in Figure 3-5. Nanofiber surface WCAs were observed with maximum values which displayed a limiting factor, a critical concentration where WCA reached maximum level and below which WCA would decrease until surfaces displayed wetting behavior. Concentrations where the highest WCAs were exhibited were between 6 and 8% dependent on flow rate and voltage; thus, no definite conclusions were made regarding critical concentration. More research is needed to accurately predict this critical concentration when considering the factors of flow rate and voltage. Figure 3-5 shows the trend in which below a certain concentration and lower, contact angles for webs decreased until hydrophilicity resulted. Hydrophilic coating webs were evaluated at 3 and 5% concentration, from which a droplet could not be supported and which allowed penetration to the fabric below.
3.4.1.2 Effect of Voltage, Flow Rate on WCA
47
In terms of flow rate, samples displayed slightly higher WCA with 1 ml/hr than with 2 mL/hr. To better determine the effect of flow rate, 0.5 mL/hr was electrospun using only 17 kV. Different mean WCAs were found to be statistically different when comparing using paired Student’s t-estimates in Figure 3-4. Figure 3-5 and Table 3-1 show average nanofiber WCAs observed at 0.5 mL/hr having a different trend from those electrospun using 1 and 2 mL/hr. When using flow rates of 1 and 2 mL/hr during electrospinning, increasing polymer concentration decreased surface WCA. This is observed at both 15 and 17 kV. For surfaces electrospun using 0.5 mL/hr, there was less dependence of WCA on polymer concentration—
Figure 3-4 and Table 3-1 show that for surfaces electrospun between 6 and 15% there was
48
only a slight change in average WCA. With surfaces electrospun using 0.5 mL/hr flow rate, increasing concentration slightly increased average WCA (6% averaged 137.91 ± 4.25°, 15% averaged 139.49 ± 2.45°). For webs electrospun using different flow rate, surface WCA measurements show dependence (slight, however) on flow rates used; the same can be said for applied voltage.
When coupling the factors of flow rate, voltage and concentration, concentration and flow rate together appear to provide the greatest effect on nanofiber webs’ WCA measurements. Lower concentrations and lower flow rates, in general, led to higher nanofiber surface coating WCAs, though with the lowest extrusion rate (0.5 mL/hr), there was little dependence on concentration. More testing regarding dependence on WCA with respect to flow rate and voltage at different concentrations should be performed to confirm or revise these findings.