HIGH FREQUENCY CUTOFF ANALYSIS FOR EVALUATING VALVES
SUBJECTED TO HYDRODYNAMIC LOADS
Cagri Ozgur1, Evren Ulku2, Nish Vaidya3, Kristofor Paserba4 and Enrique Bazan5
1Project Engineering Associate, Paul C. Rizzo Associates Inc., Pittsburgh, PA
2Senior Project Engineer, Paul C. Rizzo Associates Inc., Pittsburgh, PA (evren.ulku@rizzoassoc.com)
3Vice President, Paul C. Rizzo Associates Inc., Pittsburgh, PA
4Principal Engineer, Westinghouse Electric Company, Cranberry Township, PA
5Principal, Paul C. Rizzo Associates Inc., Pittsburgh, PA
ABSTRACT
In-line and skid mounted components of piping systems such as valves are qualified for static as well as dynamic loads. Seismic loads are generally characterized by frequency content less than about 33 Hz. Hydrodynamic (HD) loads in pressure piping, on the other hand, due to various source mechanisms collectively exhibit a broad range of frequencies much higher than 33 Hz. HD loads may also result in accelerations in excess of those due to the design basis seismic events and allowable limits. Current regulatory guidelines do not specifically address the evaluation of equipment response to high frequency loading.
This paper investigates the response of skid and line mounted valves of piping systems under high frequency (HF) HD loads by using rigorous finite element (FE) analysis solutions with a representative piping system segment. This paper develops a rationale for issues such as frequency cutoff relevant to HD loading and presents an approach for the evaluation of the response of valves to HF HD loads.
INTRODUCTION
This paper presents an approach for the evaluation of the response of safety-related in-line valves
of the AP1000® plant standard design for HD loads resulting from valve closure, jet impingement,
depressurization, and pipe whip. The HD loads are characterized by high frequency content resulting in relatively small displacements. The maximum response accelerations due to HD force time histories on the other hand could be relatively high at some locations of the system. However, predicted accelerations at valve bodies are associated with very small displacements, high frequencies, short duration, and a low impulse.
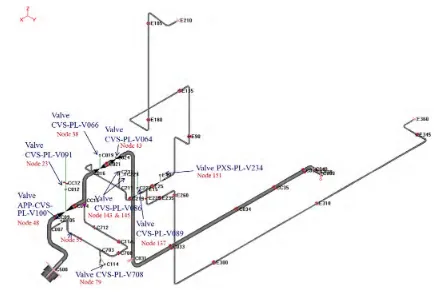
The paper develops the dynamic response to the HD loads of the valves located on a selected single representative segment. Figure 1 shows the FE model of the piping segment, including the location of in-line valves. The HD loads stem from a single event and consist of 23 separate force time histories applied simultaneously. HD loads are generally located close to elbows or intersection points with sub-segments. Most HD load time histories exhibit a few short duration pulses with a total duration less than a second within which the HD loads are essentially damped out.
Figure 1. Finite element model of the piping segment and specified valve locations.
(i) THL004, Force vs. time (ii) Fourier transformation of THL004
Figure 2. An example HD load (THL004) and the frequency content of the same load by using the Fourier transformation.
BACKGROUND
Fragility Test Data
As part of developing the basis for a frequency cutoff, the paper also examines existing fragility data to determine if this data would be applicable relative to the reported equipment type and characteristics of the input motion by means of acceleration levels and frequency content.
0.1 1 10 100 1000 10000
0 5 10
Frequency (Hz)
F
our
ie
r A
m
pl
it
Fragility tests performed in the early 1970s as part of the SAFEGUARD program (referenced in NUREG/CR-3558), demonstrate acceptable reliability of power and process equipment installed in a hardened radar installation. The SAFEGUARD program accomplished selected fragility and shock environment qualification tests on generic equipment. This program developed about 300 test reports, of which 63 were directly applicable to equipment that were later used in the Seismic Safety Margin Research Program (SSMRP) to assess nuclear power plant equipment fragilities.
Most of the SAFEGUARD tests were single-axis, superimposed sine beat pulse tests that were selected to fit prescribed acceleration spectra. Equipment was excited to levels of more than 15g’s while their functions were monitored. Consequently, the tests were true measures of fragility. The prescribed spectra reflect significant spectral accelerations in the high frequency range (in excess of 150 Hz) typical of blast loading.
Gaberson and Eubanks (1982) presented a simplified procedure to implement the SAFEGUARD data in design. In this procedure, if a test spectrum which the equipment has survived (“the hardness curve”) is greater than the environmental spectrum (“the severity curve”) for all frequencies above the fundamental frequency of the equipment; the equipment would survive the environmental spectrum. A subsequent pilot study by Electrical Power Research Institute (EPRI) examined the transfer of the military hardness assessment to the nuclear industry for evaluating the operability of equipment in the high frequency range of 20 to 100 Hz (EPRI NP-3946, 1985). The pilot study concluded that additional effort was needed to put the data and procedures in a form utilities could use more easily for evaluating a wider range of nuclear plant equipment under plant specific high frequency loads.
The HD loads are similar in frequency content and displacements to the shock loads used in the SAFEGUARD program. Therefore, the fragility information is useful, at least in a qualitative sense. However, because of differences in the type of equipment, the fragility information needs to be supplemented by representative quantitative test and analysis data to support the basis for the high frequency response of in-line valves subjected to HD loads.
Regulatory and Industry Position
Nuclear Regulatory Commission’s (NRC) Regulatory Guide (RG) 1.100 (2009) states that “… the seismic qualifications of some safety related equipment were (previously) performed using IEEE 344 type tests with intentional high-frequency content to account for simultaneous BWR hydrodynamic loads. However, the frequency content of the input for such tests needs to have enough energy to be compatible with the amplified region of the Required Response Spectrum (RRS) at high frequencies. Therefore, past experience data may only be used when it is evaluated in accordance with Annex B of IEEE 344, “Frequency Content and Stationarity.” It lists a number of techniques that may be used to show the adequacy of the frequency content and stationarity. Accordingly, the Earthquake Experience Based Qualification, discussed in ASME QME-1 Article QR-A7400 (2007) and the Experience methods of
IEEE 344 (1987) are not acceptable methods for seismic qualification for AP1000® plant safety-related
equipment.
IEEE 344 (2004) recommends that the strength and function of Class IE electrical equipment be demonstrated by analysis and by testing. According to IEEE 344 (2004), Section 8.1.6.1, the RRS for qualification by testing should reflect the combination of the operating basis earthquake (OBE) or safe shutdown earthquake (SSE) loads and the HD loads. The RRS for testing may be obtained by combinations such as SRSS.
Electro-mechanical relays (e.g., control relays, time delay relays, protective relays)
Electro-mechanical contactors (e.g., Motor Control Center (MCC) starters)
Circuit breakers (e.g., molded case and power breakers – low and medium voltage)
Auxiliary contacts (e.g., for Molded Case Circuit Breakers (MCCBs), fused disconnects,
contactors/starters)
Control switches (e.g., benchboard, panel, operator switches)
Transfer switches (e.g., low and medium voltage switches with instrumentation)
Process switches and sensors (e.g., pressure/differential pressure, temperature, level,
limit/position, and flow)
Potentiometers
Digital/solid-state devices (mounting and connections only)
In order to assure that potentially vibration vulnerable components are avoided, EPRI (2007b) recommends that safety-related applications of these components be identified, evaluated, and their acceptability determined by screening using either existing qualification data, circuit evaluation for high frequency sensitivity, or high frequency testing. It should also be noted that, the frequency range considered for screening is only between 25 and 50 Hz for high frequency ground motion.
Valve Acceptance Criteria
Seismic qualification of AP1000® plant valve assemblies are primarily performed by analysis.
For active valves, the seismic qualification analysis is supplemented by functional qualification testing. The valve seismic qualification analysis is based on static equivalent seismic loads associated with SSE accelerations of at least 6g applied along three orthogonal axes (two horizontal and one vertical) of the valve. The acceptance criteria ensure that the valve design meets the requirements of ASME B&PV Code, Section III (2010) for pressure boundary and structural integrity.
While the above analysis demonstrates structural integrity, operability of the active valves under seismic conditions is demonstrated by: 1) static deflection testing, and 2) shake table testing in accordance with IEEE 344 (1987), seismic qualification of operators. Test programs are designed to demonstrate that the active valve performance meets or exceeds the requirements of the valve design specifications. Static and dynamic test results may be compared to assess load sensitive behavior of electric motor actuated valves.
Static deflection testing of active valves demonstrates that the valve, when subjected to the required seismic loading, will not bind or interfere with itself. The load used in the static deflection test is taken to be the resultant (calculated by taking the square root of the sum of the squares) of the tri-axial static equivalent loads of 6g, plus the deadweight of the valve, and a 10 percent margin.
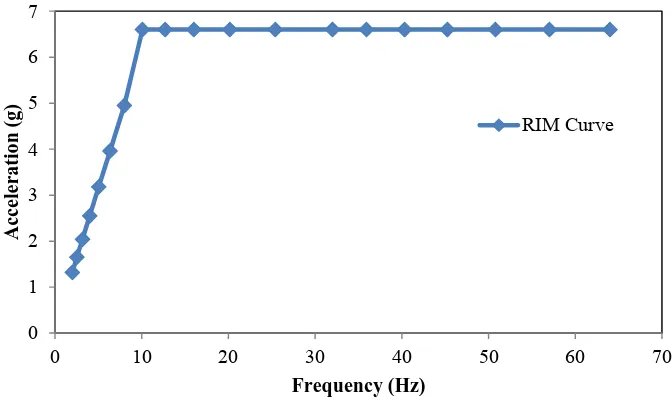
Qualification of active valves for dynamic loading with shake table testing in accordance with IEEE 344 (1987) and IEEE 382 (1996) takes into account the dynamic characteristics of the equipment, such as frequency and mode shapes and are, therefore, more representative of seismic and any other vibratory loads the valves may be subjected to. The shake table tests demonstrate that active power operated valve assemblies meet the functional requirements in accordance with ASME QME-1 (2007) Appendix QR-A for a bounding acceleration input. This bounding acceleration is defined with the Required Input Motion (RIM) curve.
frequencies. For Hard Rock High Frequency (HRHF) potentially sensitive safety-related equipment, seismic RIM testing is extended to 64 Hz. RIM testing from 32 Hz to 64 Hz is performed using a series of single-frequency sine-beat tests at one-sixth octave interval test frequencies.
Figure 3. Required input motion (RIM) curve.
BASIS FOR HIGH FREQUENCY CUTOFF
The basis for a high-frequency cutoff for the qualification analysis of in-line valves is developed. The implementation of the cutoff implies that the response of the in-line valves in modes above this cutoff may be ignored. The basis presented here examines the response of the representative piping system that affects structural integrity and operability, and the parameters that represent this response such as displacements and strain energy imparted to the in-line components. The following sections explain the basis for the high frequency cutoff, procedure implemented to test the cutoff and quantitative studies performed on the selected segment of the piping.
Strain Energy Basis for High Frequency Cutoff
The modal methods of dynamic analysis are based on the analogy between a vibration mode of a multi-degree system and the equivalent single-degree system. This analogy requires that the kinetic energy (KE), internal strain energy, and work done by all external forces for the equivalent single-degree system are at all times equal to the same quantities for the complete multi-degree system when vibrating in this normal mode alone (Biggs, 1970). Therefore, the sum of the KE in the individual modes can be used to represent the sum of the internal strain energies. Because it is related to the response quantities
used in design, the strain energy (or its surrogate, the KE) may be used as basis to assess the cutoff (fco).
In general, for a specific value of a cutoff frequency (fco), the KE in active modes, i.e., the modes
below the cutoff is:
KEco=1/2 ∑m MrSvr2
r=1 (1)
The KE in modes above cutoff is approximated by:
KErbm 1/2 1‐ ∑r 1m pmr ∑Ni 1 Mi Svco2 (2)
0 1 2 3 4 5 6 7
0 10 20 30 40 50 60 70
Acceleration (g)
Frequency (Hz)
and the total KE is thus approximated by:
KEtotal≈1/2[ ∑ Mi)(1‐ ∑m pmr
r=1 N
i=1 Svco2 (3)
The system Kinetic Energy, (KEmax), is another form of (1), and derived using all modes in the
modal combination as:
KEmax=1/2[ ∑ Mi)( ∑N pmrSvr2
r=1 N
i=1 ] (4)
where,
Svco = Spectral velocity at cutoff frequency, inches per second (in/sec) = Saco/ 2π fco
Saco = Spectral acceleration at cutoff frequency, inches per second squared (in/sec2)
Svr = Spectral velocity for r-th mode, in per second (in/sec) = Sar / 2π fr
Sar = Spectral acceleration for r-th mode, in per second squared (in/sec2)
fr = r-th Mode frequency, Hz
Mr = Effective Modal Mass for r-th mode, pounds which can also be described by the equation:
Γ ∑ (5)
Mi = Mass at i-th node, pounds
r = Modal Participation Factor for r-th mode
r} = eigenvector matrix for mode r, with N modal shape coefficients, ir for i = 1 to N
pmr = Mass Participation Ratio for r-th mode
Γ ∑ / ∑ (6)
m = number of active modes
N = total number of degrees of freedom
The KE associated with the above combination of modal responses is as follows:
KE=1/2 ∑ (7)
summed over all modes.
Based on the above discussion, a cutoff frequency is assessed from a comparison of the strain energy calculated from (1) and (7).
Procedure Implemented to Test High Frequency Cutoff for Valve Response
The following steps summarize the procedure for the high frequency cutoff, while next section elaborates on it and provides the quantitative results.
1. Perform a modal superposition time history analysis of the structural model and extract the
velocity time history for all and truncated modes at the mass point of each valve.
2. Calculate:
a. The maximum kinetic energy, KEmax, assuming all N modes to be active at the mass
point of each valve.
b. The kinetic energy KEco, for modes below cutoff at the mass point of each valve.
3. Compare and report the computed kinetic energies, KEco, KEmax.
4. Evaluate the maximum displacements at the mass point of each valve assuming 500 modes
up 3500 Hz
5. Evaluate the maximum displacements at the mass point of each valve up to truncated time
history analysis solution.
6. Compare representative displacement quantities for the full analysis and the cutoff analysis to
assess the fco.
QUANTITATIVE STUDIES
Figure 4-i presents the displacement ratio in the direction of maximum displacement (governing direction) for various in-line valves included in the FE model obtained using various frequency cutoffs to the respective resultant displacement from the full solution considering 500 modes. Figure 4-i shows the results for cutoff frequencies of 33Hz, 50Hz, 64Hz, 80Hz and 100Hz. Figure 4-ii present the respective KE ratios corresponding to Figure 4-i.
Figure 4 illustrates that about 90% of the displacements and kinetic energies are accumulated in modes less than 64Hz in the direction of the major or dominant response. However, when the resultant response (SRSS in X, Y and Z directions) is considered, about 80% of the resultant displacements, and 70% of the total KE are accumulated in modes up to 64Hz. This is reflected in the smaller mass participation of the modes below 64 Hz in the minor directions. For example, Figure 5 which shows the mass participation vs. cutoff frequencies, shows mass participation in modes below 64 Hz in the Z direction is very low compared to that of resulting from the full solution using 500 modes. However, the low mass participation in Z direction doesn’t affect the valve integrity or functionality (stem operability) for this type of loading as the valve reaches the maximum displacement in dominant direction (X or Y Direction). In addition, the total Z direction response is small compared to the dominant response, the relatively small contributions to the predicted displacements and KE below 64 Hz in this direction will not affect the overall stresses.
Figure 4. Summary of (i) displacement and (ii) KE ratios (in dominant displacement and KE directions for corresponding valve) vs. different cutoff frequencies.
Figure 5. Modal mass participation in each direction for different cutoff frequencies. 0 10 20 30 40 50 60 70 80 90 100
0 10 20 30 40 50 60 70 80 90 100
Displacement Ratio
(%
)
Cutoff Frequency (Hz) (i) CVS-PL-V091-X Dir CVS-PL-V066-X Dir CVS-PL-V708-Y Dir CVS-PL-V089-Y Dir CVS-PL-V086-Y Dir PXS-PL-V234-Y Dir 0 10 20 30 40 50 60 70 80 90 100
0 10 20 30 40 50 60 70 80 90 100
Kinetic
Energy Ratio (%
)
Cutoff Frequency (Hz) (ii) CVS-PL-V091-X Dir CVS-PL-V066-X Dir CVS-PL-V708-Y Dir CVS-PL-V089-Y Dir CVS-PL-V086-Y Dir PXS-PL-V234-Y Dir 0 10 20 30 40 50 60 70 80 90 100
0 500 1000 1500 2000 2500 3000 3500
Ma ss Pa rticipa tio n (% )
Cutoff Frequency (Hz)
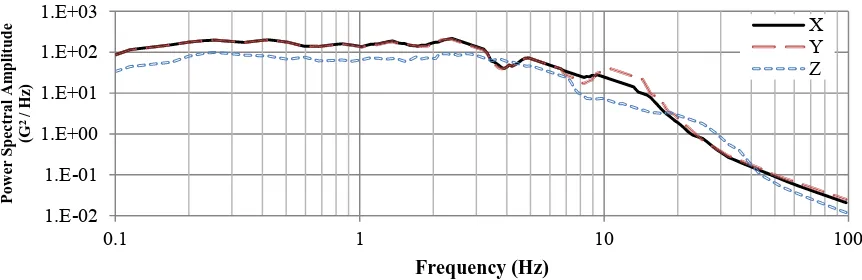
Figure 6. Power spectral density of acceleration response of valve CVS-PL-V091 to HD loads.
Figure 7. Power spectral density associated with the seismic (SSE) floor response spectrum loading.
CONCLUSIONS
HD loads generate system response that has high frequency content with accelerations that may
exceed the qualification limits. These accelerations typically occur at locations with a small mass and have a very low impulse. The accelerations are observed at relatively high frequencies and the response is controlled by displacements which are found to be small.
For the given piping system (or similar systems with similar response and transient
characteristics), the valve is shown to have small displacements and the kinetic energy (KE).
Power spectral density plots of the valves verify that the energy content under HD loads is much
lower than that of seismic response.
Because the response displacements and the KE are relatively small, structural integrity of valve
body and pipes are not a concern under HD loads
A cutoff frequency of 64 Hz is sufficient to capture the displacements, and KE content of the
valve body and its response is controlled by the piping system.
The findings of this study are in agreement with EPRI. High frequency motions are
non-damaging.
The performance of supporting electrical components subjected to high frequency pulse loading
needs to be evaluated further. 1.E-13
1.E-11 1.E-09 1.E-07 1.E-05 1.E-03 1.E-01
0.1 1 10 100 1000 10000
Pow
er Spectral
Am
plitude
(G
2 / Hz
)
Frequency (Hz)
X Y Z
1.E-02 1.E-01 1.E+00 1.E+01 1.E+02 1.E+03
0.1 1 10 100
Pow
er
Spectral
Am
plitude
(G
2 / Hz
)
Frequency (Hz)
ACKNOWLEDGEMENTS
The input and consultancy of William LaPay is gratefully acknowledged.
REFERENCES
ASME QME-1, 2007, “Qualification of Active Mechanical Equipment Used in Nuclear Power Plants,” The American Society of Mechanical Engineers.
ASME 2010, Boiler and Pressure Vessel (B&PV) Code, Section III, American Society of Mechanical Engineers.
Biggs, John M., 1970, “Section 3.7 Modal Analysis of Multi-Degree Systems,” Introduction to Structural Dynamics, Mc-Graw Hill, New York.
Cover, L. E.; M. P.Bohn, R. D. Campbell, and D. A. Wesley, 1985, “Handbook of Nuclear Power Plant Seismic Fragilities,” Seismic Safety Margins Research Program, NUREG/CR-3558, University of California Radiation Laboratory (UCRL)-53455, Lawrence Livermore National Laboratory, Livermore, CA.
Electric Power Research Institute (EPRI) 1015108, 2007a, “Program on Technology Innovation: The Effects of High Frequency Ground Motion on Structures, Components, and Equipment in Nuclear Power Plants”
Electric Power Research Institute (EPRI) 1015109, 2007b, “Program on Technology Innovation: Seismic Screening of Components Sensitive to High-Frequency Vibratory Motions”.
Gaberson, H.A. and R.A. Eubanks, 1982, “Simplified Shock Design for Installation of Equipment,” Naval Civil Engineering Laboratory, Port Hueneme, CA.
Institute of Electrical and Electronics Engineers (IEEE), 1987, “IEEE Recommended Practice for Seismic Qualification of Class 1E Equipment for Nuclear Power Generating Stations,” Institute of Electrical and Electronics Engineers, Inc., New York, NY.
Institute of Electrical and Electronics Engineers (IEEE), 2004, “IEEE Recommended Practice for Seismic Qualification of Class 1E Equipment for Nuclear Power Generating Stations,” IEEE-344, IEEE Power Engineering Society, New York, NY.
United States Nuclear Regulatory Commission (USNRC), 2009, “Seismic Qualification of Electrical and Active Mechanical Equipment and Functional Qualification of Active Mechanical Equipment for Nuclear Power Plants,” RG 1.100, Revision 3, USNRC Washington, DC, September 2009.