University of Windsor University of Windsor
Scholarship at UWindsor
Scholarship at UWindsor
Electronic Theses and Dissertations Theses, Dissertations, and Major Papers
2009
Reliability of Serviceability and Strength of Deep Foundations
Reliability of Serviceability and Strength of Deep Foundations
Embedded in (p-y) Sand Below Water Table Subjected to Lateral
Embedded in (p-y) Sand Below Water Table Subjected to Lateral
Cyclic Loading
Cyclic Loading
Ruoah Yousif
University of Windsor
Follow this and additional works at: https://scholar.uwindsor.ca/etd
Recommended Citation Recommended Citation
Yousif, Ruoah, "Reliability of Serviceability and Strength of Deep Foundations Embedded in (p-y) Sand Below Water Table Subjected to Lateral Cyclic Loading" (2009). Electronic Theses and Dissertations. 99. https://scholar.uwindsor.ca/etd/99
Reliability of Serviceability and Strength of Deep
Foundations Embedded in (p-y) Sand Below Water Table
Subjected to Lateral Cyclic Loading
BY
ROUAH YOUSIF GIZEER
A Thesis
Submitted to Faculty of Graduate Studies Through the
Department of Civil and Environmental Engineering
In Partial Fulfillment of the Requirements for the Degree of
Master of Applied Science
At the
University of Windsor
Windsor, Ontario, Canada
2009
Author’s Declaration of Originality
I hereby certify that I am the sole author of this thesis and that no part of this thesis has been published or submitted for publication.
I certify that, to the best of my knowledge, my thesis does not infringe upon anyone’s copyright nor violate any proprietary rights and that any ideas, techniques, quotations, or any other material from the work of other people included in my thesis, published or otherwise, are fully acknowledged in
accordance with the standard referencing practices. Furthermore, to the extent that I have included copyrighted material that surpasses the bounds of fair dealing within the meaning of the Canada Copyright Act, I certify that I have obtained a written permission from the copyright owner(s) to include such
material(s) in my thesis and have included copies of such copyright clearances to my appendix.
ABSTRACT
Piles are used in many engineering applications especially when we have
weak soil that cannot support the proposed structure, also when we have a scour
issue with the soil (especially in designing foundations for bridges), or when large
uplift capacity is needed. In many engineering applications the piles are
subjected to lateral loads as well as axial loads.
Many design variables (uncertainties) affect the behavior of laterally
loaded piles and the pile-soil system and their modeling. In reality when
engineers are faced with uncertainties, they use a factor of safety to design the
structure or a component, which is a conservative approach.
Reliability is a probabilistic method of analysis that provides consistent
measurements for propagation of uncertainties and unifying framework for risk
assessment. For this reason it is used instead of the factor of safety to provide a
DEDICATION
This thesis is dedicated to my family members, my husband Ziad, my kids
Marwan and Tareq. And especially my Father Salah and Mother Awatif for their
ACKNOWLEDGEMENTS
I would like to express my sincere appreciation to the numerous
individuals who guided me through the progression of this thesis with their
knowledge, support and encouragement. First, I would like to express my
deepest gratitude to my advisor Dr. B. Budkowska for her patience, insightful
comments and assistance. I also would like to thank my committee members, Dr.
Nader Zamani and Dr. S. Cheng for their valuable suggestions to improve this
thesis. Also I would like to thank the University of Windsor and the Department of
Civil and Environmental engineering for all their support.
I am forever grateful for the continued encouragement and support of my
TABLE OF CONTENT
AUTHOR’S DECLARATION OF ORIGINALITY III ABSTRACT IV DEDICATION V ACKNOWLEGMENT VI LIST OF TABLES X LIST OF FIGURES XI NOMENCLATURE XV
CHAPTER ONE: INTRODUCTION
1.1 Laterally loaded pile 1
1.2 Objective 2
1.3 Thesis stages 5
1.4 Thesis layout 6
CHAPTER TWO: LITRATURE REVIEW 2.1 Analysis of laterally loaded piles 8
2.1.1 General 8
2.1.2 Elastic soil subgrade modulus 10
2.2 Group of piles 13
2.3 Reliability analysis 16
2.3.1 Introduction 16
2.3.2 Methods of reliability analysis 22
2.3.3 Risk assessment and probability of failure 24
CHAPTER THREE: BEHAVIOR OF LATERALLY LOADED PILE EMBEDDED IN SAND. 3.1 Behavior of laterally loaded pile embedded in sand 28
3.2 Type of laterally loaded pile 32
3.2.1 Active piles 32
3.2.2 Passive piles 32
3.3 Nature of loading 32
3.3.1 Static loading 33
3.3.2 Cyclic loading 33
3.3.3 Sustained loading 33
3.3.4 Dynamic loading 34
3.4 Boundary condition 34
3.5 p-y relationships used to model the sand around a pile 35
3.6 Computer program COM624P used in the investigation 46 of single piles 3.7 FB-Pier software 47
3.8 Group of piles 47
3.9 p-multiplier, fm employed to model pile group 49
CHAPTER FOUR: THEORETICAL BASIS FOR APPLICATIO OF
RELIABILITY THEORY TO ANALYSIS OF LATERALLY LOADED PILES
4.1 Uncertainties in soil 54
4.2 Random variables 55
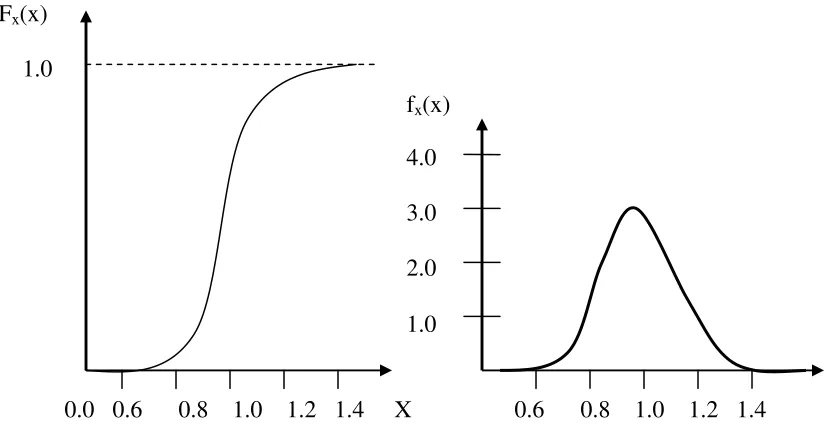
4.2.1 Cumulative distribution and probability density functions 56 4.2.2 Statistical description of random variables 57
4.2.3 Types of random variables 59
4.2.3.1 Normal random variable (Gaussian Distribution) 60
4.2.4 Statistical linearization method 60
4.2.5 First-Order Second-Moment Reliability Index 64
4.3 Numerical investigation 68
4.3.1 The determination of typical design parameters 69
4.3.2 Determination of relative stiffness factor T of pile 70
4.3.3 Development of p-y curve 75
4.3.4 Pile Mesh Sensitivity Analysis to Investigate 77
Model Accuracy CHAPTER FIVE: DISCUSSION ON RESULTS 5.1 Discussion on the results of laterally loaded free head 79
long (10T) pile 5.1.1 Discussion on the probabilistic modeling of free head 80
long (10T) pile 5.1.2 Discussion on the reliability analysis and probability of 82
failure of free head long (10T) pile 5.2 Discussion on the results of laterally loaded fixed head 86 long (10T) pile 5.2.1 Discussion on the probabilistic modeling of fixed head 86
long (10T) pile 5.2.2 Discussion on the reliability analysis and probability 87
failure of fixed head long (10T) pile 5.3 Discussion on the results of laterally loaded hinged 91
head long (10T) pile group with (3D) spacing 5.3.1 Discussion on the probabilistic modeling of hinged 91
head long (10T) pile group (3D) spacing 5.3.2 Discussion on the reliability analysis and probability of 93
failure of free head long (10T) pile group with (3D) spacing 5.4 Discussion on the results of laterally loaded fixed head 97 long (10T) pile group(3D) spacing 5.4.1 Discussion on the probabilistic modeling of fixed head 97
5.5 Discussion on the results of laterally loaded hinged 102
head long (10T) pile group with (5D) spacing 5.5.1 Discussion on the probability modeling of hinged head 102
long pile group with (5D) spacing 5.5.2 Discussion on the reliability analysis and probability of 103
failure of hinged head long (10T) pile group with (5D) spacing 5.6 Discussion on the results of laterally loaded fixed 107
head long (10T) pile group with (5D) spacing 5.6.1 Discussion on the probability modeling of fixed head 107
long (10T) pile group with (5D) spacing 5.6.2 Discussion on the reliability analysis and probability of 108
failure of fixed head long (10T) pile group with (5D) spacing CHAPTER SIX: CONCUSIONS 6.1 Conclusion on laterally loaded single pile 112
6.2 Conclusion on laterally loaded pile groups 114
6.3 Recommendations for future research 116
VITA AUCTORIS 124
APPENDIX A- APPENDIX F ON ATTACHED CD
APPENDIX A: Laterally loaded free head single pile (10T) APPENDIX B: Laterally loaded fixed head single pile (10T)
APPENDIX C: Laterally loaded free head long (10T) pile group with (3D) spacing
LIST OF TABLES
Table 2.1: relationship between reliability Index (β) and Probability of Failure (pf)
(US Army Corps for Engineers 1997)………..25
Table 4.1: Typical load and resistance statistics for structures (Data from
Ellingwood et al. 1982)………..66
Table 4.2:Reliabilityindices (failure probabilities) connected to ultimate strength
for a 1 year reference period (Madsen et al. 1995)………...68
Table 4.3: Length of piles ad relative stiffness factor T for different boundary
conditions used in the analysis………...74
Table 4.4: The pile mesh changed with increments 25, 30 and 35 and 35 when
subjected to lateral force P=30 kN……….……….……77
Table 4.5: The pile mesh changed with increments 25, 30 and 35 and 35 when
subjected to lateral force P=80 kN……….……….……77
Table 4.6: The pile mesh changed with increments 25, 30 and 35 and 35 when
subjected to lateral force P=150 kN……….……….…….77
Table 4.7: The pile mesh changed with increments 70, 75 and 80 and 35 when
subjected to lateral force P=30 kN……….……….……78
Table 4.8: The pile mesh changed with increments 70, 75 and 80 and 35 when
subjected to lateral force P=80 kN……….……….……78
Table 4.9: The pile mesh changed with increments 70, 75 and 80 and 35 when
LIST OF FIGURES
Figure 2.1: The Concept of p-multiplier (fm) (Brown et al. 1988) ……….14
Figure 2.2: Reliability assessment for normally distributed load and capacity (Phoon et al, 2003)……….19
Figure 2.3: Cost-Benefit Analysis (Phoon et al, 2000) ……….……...25
Figure 2.4: Empirical Rates of Failure for Civil Engineering Facilities (Beacher 1987) ………. 26
Figure 3.1: Laterally loaded pile embedded in sand………...28
Figure 3.2: Soil Reaction on Laterally Loaded Pile (Reese et al 2000)………….29
Figure 3-3 Pile Head Boundary Conditions………....35
Figure 3-4 Typical p-y curve for Sand at arbitrary depth x>0………..37
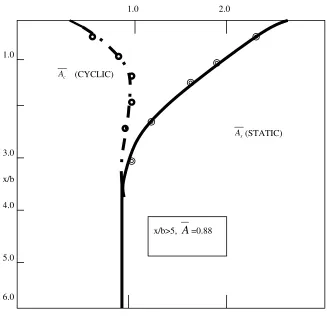
Figure 3-5 Values of coefficient As (Reese et al., 1974)………...38
Figure 3-6 Values of coefficient Bs(Reese et al., 1974)………...39
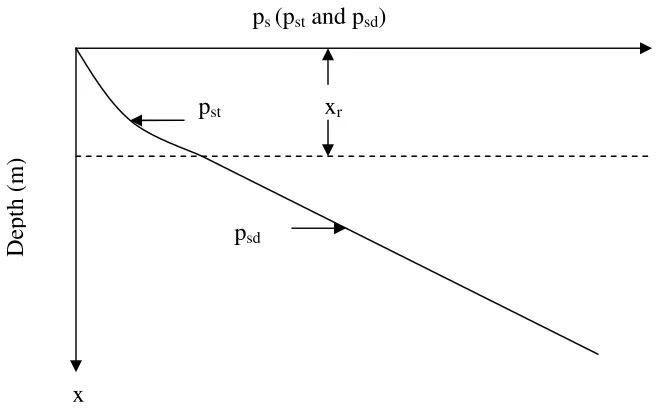
Figure 3-7 Variability of ultimate soil resistance ps (pst and psd) of qualitative type around laterally loaded piles embedded in sand……….…..42
Figure 3-8 Family of p-y curves for different value of x ………...………43
Figure 3-9 (a) Components of p-y curve above xr……….…………44
Figure 3-9 (b) Components of p-y curve below xr……….……45
Figure 3-10 (3x3) pile group and pile cap in group of piles……….……48
Figure 3-11 Orientation of rows in a plan of group of piles………..50
Figure 3-12 Geometrical characteristics of pile group………..51
Figure 3-13 Proposed p-multiplier design curves (Mokwa and Duncan, 2001)……….52
Figure 4.1 Representatives of Random Variables………57
Figure 4.3 Geometry of pile, soil properties and type of load in sand………...71
Figure 4.4: p-y curves at different depth, x………....76 .
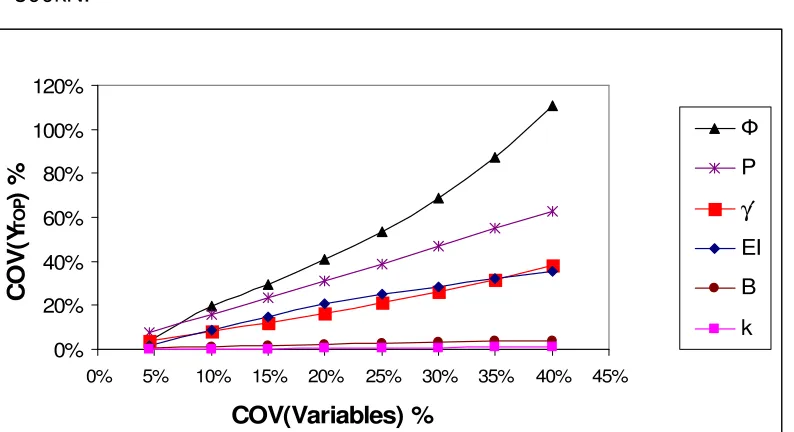
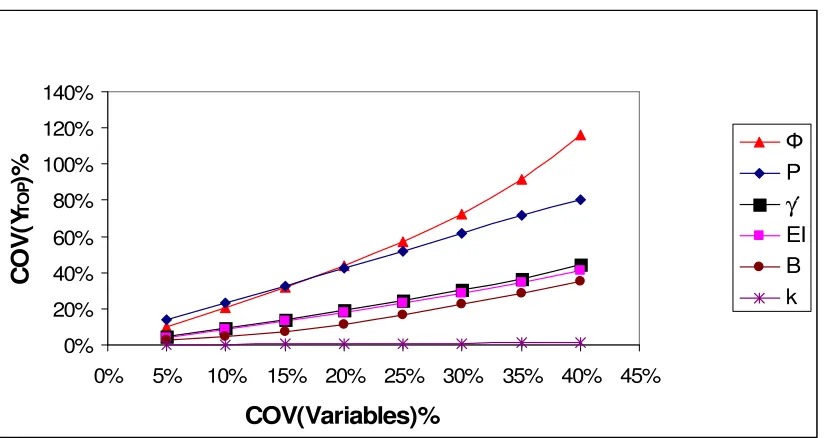
Figure 5.1 Effect of different variables on COV(YTop) for free head single long pile
(10T) at lateral load P=150kN. ………..…..81
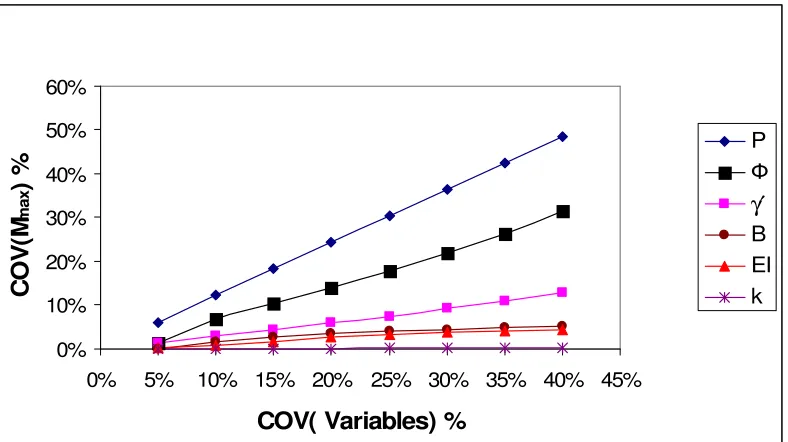
Figure 5.2 Effect of different variables on COV(Mmax) for free head single long
pile (10T) at lateral load P=150kN. ………..……..82
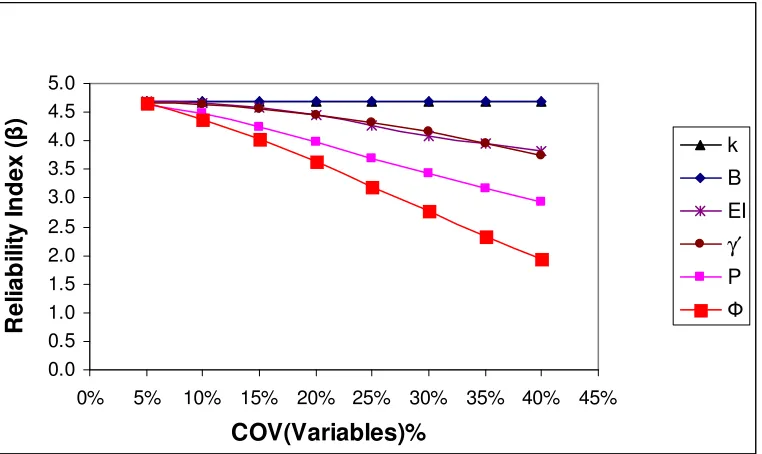
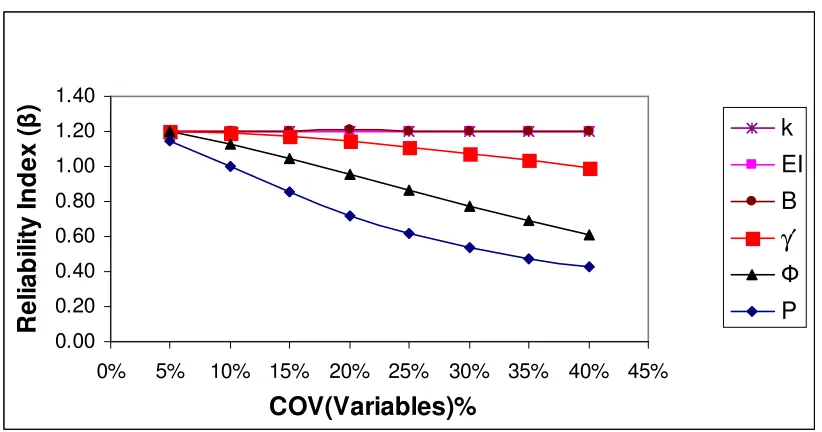
Figure 5.3 Reliability Index (βYTOP) connected with YTop for free head single long
pile (10T) with lateral load P=150kN. ……….…………..83
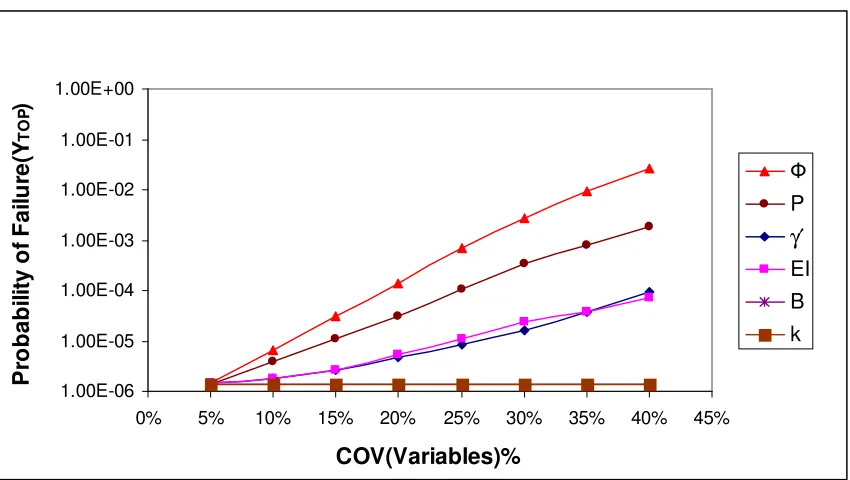
Figure 5.4 Probability of Failure connected with YTop for free head single pile
(10T) with P=150kN. ………84
Figure 5.5 Reliability Index (βMmax) connected with Mmax for free head single pile
(10T) with P=150kN. ……….…….…..85
Figure 5.6 Probability of Failure connected with Mmax for free head single pile
(10T) with P=150kN ………...85
Figure 5.7 Effect of different variables on COV (YTop) for fixed head single long
pile (10T) at lateral load P=300kN. ………....86
Figure 5.8 Effect of different variables on COV (Mmax) for fixed head single long
pile (10T) at lateral load P=300kN……….……….87
Figure 5.9 Reliability Index (βYTOP) connected with YTop for fixed head single long
pile (10T) with lateral load P=300kN. ……….…...88
Figure 5.10 Probability of Failure connected with YTop for fixed head single pile
(10T) with P=300kN. ……….89
Figure 5.11 Reliability Index (βMmax) connected with Mmax for fixed head single pile
(10T) with P=300kN. ………..…….….90
Figure 5.12 Probability of Failure connected with Mmax for fixed head single pile
(10T) with P=300kN. ……….90
Figure 5.13 Effect of different variables on COV(YTop) for hinged head long pile
(10T) group with (3D) spacing and lateral load P=1025kN. ………..….92
Figure 5.14 Effect of different variables on COV(Mmax) ) for hinged head long pile
Figure 5.15 Reliability Index (βYTOP) connected with YTop for hinged head long pile
(10T) group with (3D) spacing and lateral load P=1025kN. ………...94
Figure 5.16 Probability of Failure connected with YTop for hinged head long pile
(10T) group with (3D) spacing and lateral load P=1025kN. ……….……..95
Figure 5.17 Reliability Index (βMmax) connected with Mmax for hinged head long
pile (10T) group with (3D) spacing and lateral load P=1025kN……….…….96
Figure 5.18 Probability of Failure connected with Mmax for hinged head long
pile(10T)group with (3D) spacing and lateral load P=1025kN. ………..…96
Figure 5.19 Effect of different variables on COV(YTop) for fixed head long pile
(10T) group with (3D) spacing and lateral load P=2500kN. ………..……...97
Figure 5.20 Effect of different variables on COV(Mmax) for fixed head long
pile(10T) group of piles with (3D) spacing and lateral load P=2500kN. …………98
Figure 5.21 Reliability Index (βYTOP) connected with YTop for fixed head long pile
group with (3D) spacing and lateral load P=2500kN. ……….…...99
Figure 5.22 Probability of Failure connected with YTop for fixed head long pile
group (3D) spacing and lateral load P=2500kN. ………...100
Figure 5.23 Reliability Index (βMmax) connected with Mmax for fixed head long pile
group(10T) with (3D) spacing and lateral load P=2500kN……….……….. 101
Figure 5.24 Probability of Failure connected with Mmax for fixed head long (10T)
group of piles with 3D spacing and lateral load P=2500kN. ………...…………101
Figure 5.25 Effect of different variables on COV(YTop) for hinged head long (10T)
group of piles with 5D spacing and lateral load P=1300kN. ……….102
Figure 5.26 Effect of different variables on COV(Mmax) ) for hinged head long
(10T) group of piles with 5D spacing and lateral load P=1300kN………103
Figure 5.27 Reliability Index (βYTOP) connected with YTop for hinged head long
(10T) group of piles with 5D spacing and lateral load P=1300kN. ………...…...104
Figure 5.28 Probability of Failure connected with YTop for hinged head long (10T)
group of piles with 5D spacing and lateral load P=1300kN. ………...….105
Figure 5.29 Reliability Index (βMmax) connected with Mmax for hinged head long
Figure 5.30 Probability of Failure connected with Mmax for hinged head long (10T)
group of piles with 5D spacing and lateral load P=1300kN. ……….…106
Figure 5.31 Effect of different variables on COV(YTop) for fixed head long (10T)
group of piles with 5D spacing and lateral load P=3300kN. ………....107
Figure 5.32 Effect of different variables on COV(Mmax) ) for fixed head long (10T)
group of piles with 5D spacing and lateral load P=3300kN. ………....108
Figure 5.33 Reliability Index (βYTOP) connected with YTop for fixed head long (10T)
group of piles with 5D spacing and lateral load P=3300kN. ………....109
Figure 5.34 Probability of Failure connected with YTop for fixed head long (10T)
group of piles with 5D spacing and lateral load P=3300kN. ………...….110
Figure 5.35 Reliability Index (βMmax) connected with Mmax for fixed head long
(10T) group of piles with 5D spacing and lateral load P=3300kN. ………..111
Figure 5.36 Probability of Failure connected with Mmax for fixed head long (10T)
group of piles with 5D spacing and lateral load P=3300kN. ……….111
NOMENCLATURE
As = Dimensionless coefficient.
ε50 =Strain at which 50% of the soil (sand) is mobilized.
Bs = Dimensionless coefficient.
B = Width of the pile.
β = Reliability index of the pile.
COV (Mmax ) = Coefficient of variation of pile bending moment.
COV (YTOP ) = Coefficient of variation of pile head deflection.
Cpφ =Passive pressure factor.
D = Diameter of member piles in a group.
EI = Flexural stiffness of the beam.
fm = p- multiplier.
φ = Angle of internal friction.
φt = Top flexural rotation of the pile.
Ge = Pile group efficiency.
Hc = Characteristic shear load.
Ht =Horizontal load applied at the ground line.
γ′ = Unit weight of the soil.
k = Coefficient of subgrade reaction.
ks = Subgrade soil modulus.
Ka = Coefficient of active lateral earth pressure of Rankine type.
Kο = Coefficient of earth pressure at rest.
Mt = the moment at the ground line.
Mmax = Maximum bending moment of the investigated pile.
Mmaxο = Mean value of pile bending moment.
MmaxM = Margin of safety of pile bending moment.
(MmaxM )ο = Mean value of margin of safety of pile bending moment.
MmaxMax = Maximum allowable bending moment of the pile.
µF = Mean value of the load.
µM = Mean value of the margin of safety.
µQ = Mean value of the capacity.
Nr = the number of rows.
P = Horizontal force applied to pile head.
p = Soil response.
PG = Force applied to the cap pf primary pile group.
Pf = Probability of failure.
Pgp = Lateral load resistance of a pile in a group that is p-value for the pile in the group.
Ps = The ultimate soil resistance.
Psd = The ultimate soil resistance associated with lower part of the pile.
(Ps)g = The ultimate lateral load capacity of the pile group.
(Ps)s = The lateral load capacity of single pile.
Pst = The ultimate soil resistance associated with upper part of the pile.
Psp = Lateral load resistance of a single pile that is p-value for a single pile.
Sx = Covariance matrix for random variable.
σM = Standard deviation of the margin of safety.
σP =Representative passive pressure of soil.
σQ = Standard deviation of the capacity.
σ Mmax = Standard deviation of maximum bending moment.
σ Mmax M = Standard deviation of margin of safety of maximum bending
moment.
σ Mmax Max = Standard deviation of maximum allowable bending moment.
σYTOP = Standard deviation of pile head deflection.
σYTOPM = Standard deviation of margin of safety of pile head deflection.
σYTOPMax = Standard deviation of maximum allowable deflection of pile head.
Tm = Relative stiffness of pile under bending moment.
Tp = Relative stiffness of pile under horizontal force.
Var(Mmax) = Variance of maximum bending moment.
Var(YTOP ) = Variance of pile head deflection.
y = Deflection of the pile at a arbitrary depth.
YTOP = Top lateral deflection.
YTOPο = Mean value of pile head deflection.
YTOPM = Margin of safety of pile head deflection.
(YTOPM )ο = Mean value of margin of safety of pile head deflection.
CHAPTER ONE
INTRODUCTION
1.1 Laterally loaded pile
Piles are mainly used to transmit axial forces, from various structures, to
the subsoil. Piles are used in many engineering application especially when there
is weak soil that cannot support the proposed structure. They are also used when
there is scour issue with the soil (especially in designing foundations for bridges),
or when large uplift capacity is needed. Since the main structural forces are
gravity loads, the majority of piles are constructed to carry these vertical loads.
However, many structures which must be constructed on piles are not only
subjected to vertical gravity forces, but also to horizontal forces. In order to
transmit these horizontal forces through pile as axial forces, some of the piles
should be constructed as inclined piles (battered piles). Construction of inclined
piles in most of the cases is either not possible or if possible not feasible from a
economical point of view. For such structures, piles, constructed vertically, must
be designed not only to transmit vertical forces, but also to transmit horizontal
forces to subsoil. The horizontal force that is exerted to the piles may result from
the following:
• Wind forces acting on buildings, bridges, large signs or other structures,
• Centripetal forces from vehicular traffic on curved bridges,
• Loads on bridges resulting from accelerating, braking or turning of
vehicles,
• Lateral seismic forces from earthquake,
• Forces acting on offshore or near shore structures resisting ocean wave
or water currents,
In case of axially loaded pile, the design of a pile can be accomplished by
solving the equations of static equilibrium. On the other hand, the analysis of a
pile under lateral loading requires the solution of non-linear differential equation.
The solution is possible if non-linear relationships of soils, represented by p-y
curves are employed. This solution represents the soil resistance as a function of
pile deflection along the length of a pile. Iteration must be employed because the
soil response is a non-linear function of pile deflection and of position along the
length of pile. The iteration by finite difference method leads to compatibility
between pile deflection and soil resistance, while the iteration by finite element
method leads not only to compatibility between pile deflection and soil resistance
but also condition of equilibrium.
1.2 Objective
The performance of the laterally loaded pile depends on a number of
parameters, called design variables. In this thesis these design variables are
summarized as:
• pile bending stiffness, EI
• pile diameter, B
• submerged unit weight, γ’
• angle of internal friction of soil, Ф
• modulus of sub-grade reaction, k
• lateral load, P
In order to accomplish efficient and optimum design it is important to study
and visualize the behavior of laterally loaded pile embedded in soil. A well
designed pile should have its top lateral deflection or rotation at the top within
certain limits. This means that lateral deflection and rotation of pile at the top are
the measures of engineering performance of the pile. Calculation of deformation
of laterally loaded pile is lengthy and complicated. Unlike axial deformation under
Traditionally, the design of infrastructure involves consideration of only
initial conditions, loads, geometry, and material properties as the primary input
variables for structural analysis without taking into account the result of material
degradation due to environmental effects with time. Such an approach does not
adequately assess the actual service life of the structure. With the concept of
serviceability limit state design, structures to be designed to maintain desired
serviceability throughout the span of time for which the structure is designed for.
The structure will have a good performance if it provides an acceptable level of
serviceability when constructed as well as throughout its designed lifetime. As
part of infrastructure that supports the superstructure, laterally loaded piles
require maintenance services, future rehabilitations, renovations and
replacements. The deterioration of the pile-soil system results in increase of
deformations especially top lateral deflection, y and top flexural rotation øt of the
pile. The key factors that cause such deterioration of pile-soil system are material
degradation due to aging and construction quality. It is therefore essential to
develop a method that provides a theoretical basis for assessment of change of
maximum deformations expressed in terms of possible changes of material
properties.
The uncertain performance of deep foundations is affected by many
factors such as spatial variation of soil properties, limited soil exploration
programs, uncertainties in the parameters determined by various testing methods
and analysis, limited calculations models or error in the models as well as
uncertainties in loads. Every site is considered as unique in terms of subsurface
conditions that vary spatially within a site. The variability of subsurface conditions
within and between sites leads to uncertainty in the information needed in
geotechnical design. These uncertainties have been traditionally accounted for
through a variety of conservative design practices such as:
• use of extreme loading conditions
• conservative soil properties
The uncertainties exist in soil-pile system due to many factors as discussed
above. There is a need to account for these uncertainties in the parameters that
affect the performance of the pile system. In reliability analysis, the uncertainties
are represented by Coefficients of Variation (COV). The COV of different type of
parameters contribute to overall performance of the pile-soil system. A
probabilistic analysis gives therefore more insight into significant components of
an investigated problem than parametric analysis. Moreover the probabilistic
assessments are valuable complements to deterministic analysis.
The objective of this study is to perform the reliability analysis of laterally
loaded single piles and pile groups embedded in sand below water table
subjected to cyclic loading. Statistical analysis (determination of Var(YTop), Var
M(Max), YTopο , MοMax) is used to assess the laterally loaded pile and pile group
embedded in p-y sand for ultimate and serviceability limit state (MMaxM and YTopM)
through probabilistic modeling and reliability analysis. The goals behind this
study are:
1. To investigate dimensionless parameter i.e. coefficient of variation (COV)
of the function of random variables such as maximum deflection YTop
(connected with Serviceability Limit State) and maximum bending moment
MMax (connected with Ultimate Limit State).
2. To investigate the effect of the random design variables on the
performance of the pile soil system for ultimate strength and serviceability
limit state (MMaxM and YTopM) for single pile and pile group.
3. To investigate the effect of the pile length (short or long pile), the pile type
(single pile or group of piles), and the effect of boundary condition at piles
head (free head or fixed head) on the performance of the system.
4. Investigate the effect of random design variables on the reliability indices
and corresponding probability of failure of the pile-soil system for strength
5. To set recommendations for further research on laterally loaded single
piles and pile groups with more complex loads such as dynamic loads or
piles in seismic areas. Also future research may consider different type of
soil, different soil conditions or piles on rock.
1.3 Thesis stages:
• Investigation of the uncertainties of the MMax and YTop caused by uncertainties
of physical property of the pile-soil system.
The determination of each component of covariance matrix Cov(YTop,, MMax) is
conducted in this study.
In the pile-soil system, the effect of each random design variable (EI, B, γ′,
k, φ, P) on YTop,, MMax requires determination of partial derivatives of YTop and
MMax with respect to their random variables in the vicinity of the mean value of
random variables (EIo, Bo, γ′o, ko, φo, Po). In numerical analysis, it is done by
changing the input value of one parameter at a time by
) 40% 15%, 10%, 5%, e.g.
( ± ± ± L± in order to asses the effect of this change to
determine e.g. ο EI YTop ∂ ∂
in the vicinity of mean value of all other parameters.
In particular, the assessment of each term
ο EI YTop ∂ ∂ and ο EI MMAX ∂ ∂ is
conducted based (in general) on the expansion of arbitrary function f
( )
x ofmany variables arranged in vectorx, in Taylor’s series in the following way:
(1-1)
where:
{ }
f(x) ={
Mmax,YTop}
• Determination of the variance of YTop and variance of MMax
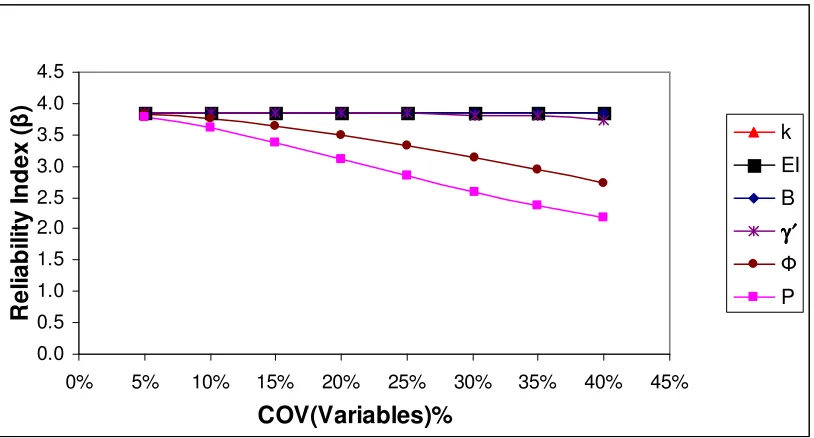
• Investigate the results for the coefficient of variation COV (YTop) vs. COV
(random variables) and COV (MMax) vs. COV (random variables) for single
pile and pile group to evaluate the effect of each random variable on the
performance of the system to identify, which random variable has more
influence on the system performance.
• Calculate the reliability indexβ and corresponding probability of failure of
(YTop & MMax) for single piles and pile groups and investigate the effect of
each random parameter expressed by COV (EI, B, γ′, k, φ, P) on reliability
indices β defined by equation (2.8 Chapter Two).
• Compare the reliability index β and probability of failure with the standard
recommended values.
All the above stages were investigated for single pile and pile groups for
different boundary conditions (free head, fixed head) and different pile lengths
from (2T to 10T), where T is the relative stiffness factor. The characteristic
parameter for pile group is defined by spacing between piles. Thus in
investigation of pile group the spacing was changed between 3D to 5D.
1.4 Thesis Layout
This thesis consists of six chapters, which are identified as:
Chapter two contains a review of the literature relevant to the topic of this thesis,
that is connected with reliability analysis of laterally loaded piles imbedded in
(p-y) sand below water table. This chapter discusses the theory of laterally loaded
piles and methods of analysis. It also discusses the reliability analysis and
probabilistic methods, the research and development of the reliability analysis
Chapter three presents the theoretical formulation of p-y curve of sand below
water table subjected to cyclic loading for single pile and pile group. It also
highlights the development of p-y curve for piles and the research in the field.
Chapter four shows the numerical investigation of laterally loaded piles, the
random variables associated with the pile-soil system with the relevant
theoretical formulation. Chapter four presented a complete sample calculation to
show the numerical procedure used in this thesis to conduct reliability analysis on
laterally loaded single pile and pile group. This chapter deals with the general
terms and formulation used for probabilistic modeling and reliability analysis.
Chapter five provides a discussion on the results of the analysis conducted in
this thesis.
Chapter six identifies the conclusion that came out of the study and
recommends areas for future research.
In addition to the above chapters, this thesis includes the following appendices:
Appendices A and B present the analysis of the results for single isolated pile in
forms of tables and charts.
Appendices C and D display the analysis of the results of pile group with (3D)
spacing. Where, D is the pile diameter.
Appendices E and F give the analysis of the results of pile group with (5D)
CHAPTER TWO
LITRATURE REVIEW
2.1 Analysis of Laterally Loaded Piles
2.1.1 General
Modeling piles behavior is very important in today’s engineering
applications because of the pile effect on the structure behavior, the overall
structure stability and safety. It becomes more critical when the pile or group of
piles are carrying loads from high rise buildings subjected to significant lateral
wind loads or complex bridges and interchanges carrying heavy traffics and
subjected to seismic loads. For all above reasons piles attract interest of
engineers to study their behavior, modeling techniques, and factors affecting
their capacity and stability under specified loads. Many researchers have
investigated the laterally loaded pile behavior. The ultimate resistance of piles
and the deflection due to a lateral loading are complex due to the interactions
between the pile and the surrounding soil. For single piles, lateral loading is a
problem of soil-structure interaction, in which pile deflection depends on the soil
response and soil response depends on pile deflection. For closely spaced pile
groups, this behavior is more complex for single pile due to the decrease of
group efficiency because of close pile spacing and the distribution of the load
from the superstructure to each of the supporting piles. Types of design or
analysis can be categorized into several approaches depending on how piles and
soils are modeled and summarized as:
Linear Elastic Method
Ultimate Load Method
In the late 1940s and 1950s when energy companies built offshore
structures that were designed to sustain relatively large horizontal loads from
waves, the concept of the response of the soil as a function of the lateral
deflection of pile, y, was developed. Since then, full scale testing and the digital
computer allowed the development of the p-y curve method (American Petroleum
Institute, API, 1987). Nonlinear soil behavior is described in terms of soil reaction,
p, versus lateral deflection of pile, y, curves, based on analysis of field load test
and laboratory tests. The characteristics of soil, as well as the stiffness of pile
have a pronounced effect of such performance of pile as top lateral deflection
YTop, and maximum bending moment, Mmax. Those design parameters (variables)
are described as:
• pile bending stiffness, EI
• pile diameter, B
• submerged unit weight, γ’
• angle of internal friction of soil, Ф
• modulus of sub-grade reaction, k
Reese et al. (1970) used a finite difference method for analysis of laterally
loaded single pile and pile group. Reese provided a thorough description of the
p-y-method for group of piles and an overview of different p-y-curves. LPILE
PLUS program was used to model the single pile test. The initial input soil
parameters were adjusted to obtain a good match between the measured and
computed results. This refined soil profile was then used to model the pile group
in GROUP program (Reese et al. 1996).
Evans and Duncan 1982 (Evan et al. 1982) developed the elastic
continuum concept for piles which is based on the subgrade modulus concept for
soil. The subgrade modulus method is based on the assumptions that the
reaction forces exerted on a beam resting on an elastic foundation is proportional
at every point to the deflection of the beam at that point. This concept was
The subgrade modulus concept treats the soil as a series of springs and
does not account for its continuity. In the elastic continuum procedure, soils are
modeled as continuum and soil modulus is homogeneous, isotropic or increasing
linearly with depth. The elastic continuum procedures have the important
advantage over the subgrade modulus method of enabling analysis to be made
for group action of piles under lateral loads. However, they provide somewhat
uncertain results and are somewhat difficult to apply in many practical cases,
especially in layered soils. A major problem with using this procedure is the
determination of an appropriate reaction modulus (Epy), as it varies with pile
properties, depth below the ground surface and the pile deflection.
Evans and Duncan 1982 introduced the procedure that can be applied to
a wide variety of conditions to estimate the non-linear load-deformation and the
bending moments in laterally loaded single pile or pile group, by using
dimensional analysis technique. The Limit State Analysis procedures developed
by Evans & Duncan (1982) (Evans et al 1982) can be used to estimate the
ultimate pile capacity for a given set of soil and pile properties. In the extended
work of Duncan, M. J., Levison, H. F., & Budd, S. M., (Duncan et al. (1994)), they
presented the characteristic-load method (CLM) which is based on the earlier
work of Evans & Duncan (1982). A series of solutions were generated with
nonlinear p-y curves for soils and pile head conditions. The results were
analyzed with the view to obtain simple equations that could be used for rapid
prediction of the response of piles under lateral loading. It can be used to check
computer output from more sophisticated analysis.
The non-linear p-y method provides the best fit between the calculated
behavior of laterally loaded piles and the behavior measured in full scale tests.
2.1.2 Elastic Soil Subgrade Modulus:
defined as the resistance of the soil at a point along the pile divided by the
deflection of the pile at that point. The soil reaction modulus is a function of both
the depth below the ground surface z and the deflection of the pile y.
The subgrade modulus is based on assumptions introduced by Winkler
in 1867, that:
a) The reaction forces exerted on a beam resting on an elastic
foundation are proportional at every point to the deflection of the beam
at that point.
b) The elastic foundation deforms only in the area beneath the load.
The first of the assumptions leads to the definition of the subgrade
modulus as:
ks=-p/y (2.1)
ks= subgrade (soil) modulus (force/length2)
p= soil reaction
y= deflection of the beam in units of length
Using a subgrade modulus, as defined by Eq. (2.1), the basic
differential equation for a laterally loaded pile is expressed as:
If the value of ks is constant with depth, simple closed form solution is
available for Eq. (2. 2) (Hetenyi 1946). Hetenyi modeled the interaction between
the soil and the pile using the concept of subgrade reaction, this analysis is
based on the assumption that the soil reaction p is proportional to the deflection
of the pile y. The soil reaction divided by the deflection is called the soil modulus
Es. in 1946 Hetenyi developed a solution for Es constant with depth. Poulos and
Davis (1980) present tables of non-dimensional coefficients for the determination
of deflection, slope, bending moment and shear for free head, fixed head piles
when subjected to lateral loads, where ks is assumed constant with depth. In their
0 4
4
=
+k y
dx y d
model, Poulos and Davis calculated the responses of a pile by solving the
deferential equations of deflection curve using finite element analysis.
In 1958, McClelland and Focht (Focht 1973) introduced the p-y method to
take into account the nonlinearity of soil reaction modulus. In their research, they
concluded that the soil reaction modulus is not just a soil property but it is a
function of the pile diameter, deflection, and soil properties. The nonlinear p-y
method is considered as the most appropriate method for evaluating the pile-soil
interaction. This method provides the best fit between the calculated behavior of
the laterally loaded piles and the real test results using full scale tests. The soil
behavior is described in terms of soil strength parameters (γ': a submerged unit
weight, Ф: an angle of internal friction of soil, k: a modulus of subgrade reaction).
In 1956 Matlock & Reese (Reese et al. 1956) introduced a
non-dimensional method of analysis for single pile, followed by Matlock development
of p-y model in 1970 (Matlock 1970). Matlock measured the bending moment of
a pile using strain gages, then calculated the deflection by double integrating the
bending moment curve. The American Petroleum Institute (API) conducted
extensive research in the area of laterally loaded piles that lead to the publication
of the General Practice Recommendations for Planning Designing and
2.2 Group of Piles
Piles are most often used in groups. The models that are used for the
group of piles must address two problems: the efficiency of closely-spaced piles
under lateral loading; and the distribution of the loading to each of the piles in the
group, a problem in mechanics. If one can assume that the procedures are
accurate for analyzing a single pile under lateral loading, the problem of the
distribution of the loading to each of the piles in a group can be solved exactly.
The response of laterally loaded piles installed in group closely spaced (when
center-to-center spacing between piles is less than 6 times pile diameter) is very
different from that of single isolated pile. This difference in the behavior is due to
the fixity and lateral resistance (Mokwa & Duncan 2001) provided by pile cap and
the interaction between the pile and soil (pile-soil-pile interaction).
The easiest way to analyze the pile group is to assume that the pile cap is
rigid and only axial load is applied. In the beginning, most of the researchers
presented their work under these assumption, such as Culmann in 1866
(Terzaghi 1956), Brennecke & Lohmeyer in 1930 (Terzaghi 1956), Vetter in 1939
(Terzaghi 1956). However in 1950, Hrennikoff considered a laterally loaded pile
as an elastic beam on an elastic foundation with uniform stiffness and this was
the method which presents the potential for analytical treatment of the pile-soil
interaction system.
Because of the variability of soil and the complex nature of constitutive
models, theoretical solutions are currently unavailable for computing the
efficiency of a particular pile. Piles in closely spaced groups behave differently
than single isolated piles when loaded laterally because of pile-soil-pile
interactions that take place in the group. Deflections and bending moments of
piles in closely spaced groups are greater than deflections and bending moments
Brown et al. (1988) initially proposed the p-multiplier concept. The p-y
curves of single pile are modified to account for the influence of the interaction
between the different piles in the group. As shown in Figure 2.1, the p-multiplier
fm is the reduction factor of soil resistance p for the same deflection of y. The p-y
curve is compressed in the direction of p, so that the soil resistance, p, of piles
in-group will be smaller than the soil resistance of single piles.
Figure 2.1: The concept of p-multiplier (fm) (Brown et al. 1988)
The approach for analyzing the behavior of a pile in a group is similar to
the approach used for analysis of a single pile, except that the p-values (soil
resistance) are reduced using a p-multiplier to account for the reduced resistance
due to the interaction between piles. The piles and pile cap then can be analyzed
as a whole to calculate the deflections and forces. The computer programs,
which are based on the p-multipliers method, are also readily available in recent
years and are in continuous development to incorporate broader spectrum of
variables, such as dynamic effects, that affect the behavior of laterally loaded pile
groups. The p-multipliers method is also used to carry out the reliability analysis
of pile groups in this research.
The values of p-multiplier proposed by Brown et al. (1988) are the result of
an isolated pile embedded in dense sand subjected to cyclic loading and a full-p-y curve for single pile
p-y curve for pile in group p
y pgroup = psingle x fm
scale test for pile group. Brown and Shie (1991) also presented the p-multipliers
from the result of 3-D finite element analysis. Mokwa and Duncan (2001a) carried
full-scale field tests to study the lateral resistance provided by the pile cap and
concluded that the pile cap, in some circumstances, constitute a substantial
percentage of the total lateral resistance of the group.
Cox et al. (1984), Brown and Reese (1985), Morrison and Reese (1986),
McVay et al. (1995), Ruesta and Townsend (1997), McVay et al. (1998) and
Rollins et al. (1998) suggested different values for the p-multiplier, fm, based on
the centrifuge or full-scale tests in different type of soils.
Through combining the research work that had been done before, Mokwa
and Duncan (2001b) proposed a way to construct the value of p-multiplier, fm, for
all kinds of soil. They collected and reviewed over 350 journal articles and other
publications pertaining to lateral resistance, testing, and analysis of pile caps,
piles and pile groups. The results from these tests were assimilated into tables
and charts, from which the trends and similarities can be observed. Ilyas et al.
(2004) proposed a centrifuge model test study of laterally loaded pile groups in
clay. A series of centrifuge model tests has been conducted in their research to
examine the behavior of laterally loaded pile groups in normally consolidated and
over consolidated kaolin clay. The pile groups have a symmetrical plan layout
consisting of 2, 2x2, 2x3, 3x3 and 4x4 piles with a center-to-center spacing of
three or five times the pile width. The piles are connected by a solid aluminum
pile cap placed just above the ground level. It is established that the pile group
efficiency reduces significantly with increasing number of piles in a group. The
tests also reveal the shadowing effect phenomenon in which the front piles
experience larger load and bending moment than that of the trailing piles. The
shadowing effect is most significant for the lead row piles and considerably less
significant for subsequent rows of trailing piles. They also pointed out that the
approach adopted by many researchers of taking the average performance of
large pile groups as the outer piles in the row carry significantly more load and
experience considerably higher bending moment than those of the inner piles.
2.3 Reliability Analysis
2.3.1 Introduction
Reliability is a probabilistic method of analysis that provides consistent
measurements for propagation of uncertainties and unifying framework for risk
assessment (K. K. Phoon et al., 2003). It is the capacity of a system to perform
the required function for a desired period of time without failure, in specified
environment and with desired confidence. Reliability analysis is a quantifying of
sources of failures with emphasis on the most significant contributors towards the
overall system.
Uncertainties are present in geotechnical engineering and geotechnical
system such as deep foundation. The uncertain performance of pile–soil system
is affected by many factors such as spatial variation of soil properties, limited soil
exploration programs, uncertainties in the parameters determined by various
testing methods and analysis, limited calculation models and the uncertainties in
the applied loads (K. K Phoon and F. H. Kulhawy, 1999). In reality, absolute
safety or zero probability of failure cannot be achieved. In deterministic analysis
with uncertainties, engineers use the factor of safety based on their experience
and engineering judgment, which is a conservative estimate of the design
parameters, while in probabilistic analysis, economical design can be achieved
by properly balancing the risk of failure, consequence of failure and the initial
cost. Because of the uncertainties accompanied with the soil-pile system,
reliability analysis merely removes the need of guesswork (Phoon et al.(2003a)),
(expected value), variance and or coefficient of variation (COV) of random
variables to evaluate reliability indices of the structure (Phoon et al.(2003a).
All geotechnical engineering project start with site exploration and soil
testing to obtain the properties and distribution of soil. After that analysis is
conducted to estimate the response of the soil under applied load. Errors, often
of unknown magnitude, are introduced in all three phases of a project. Over 40
years ago, Casagrande (1965) mentioned that there should be a proper balance
among the risk of failure due to these unknown errors, consequences of failure,
and the initial cost. To achieve above mentioned criteria, geotechnical engineer
uses the conventional factor of safety approach, which is based on experience
and it is logical too. However, it is very common to use the same value of factor
of safety for different kinds of design, such as long-term slope stability, without
regard to the degree of uncertainty involved in its calculation. The same value of
factor of safety is applied to the widely varying degree of uncertainty. On the
other hand, reliability analysis differentiates between the situation where the
uncertainties are particularly high or low and also it takes into account the
combined effect of uncertainties on structure . Christian et al. (1994)express
some about reliability method.
Many of the structural related reliability –based design codes have been
put into practice in mid 1970s, such as BSI 1974; NKB 1978;ACI 1983.However
geotechnical design community has been slow in assimilating this new design
methodology.
Ruiz (1984,1986) analyzed the laterally loaded pile in soft clay using
reliability analysis(First-Order Second-Moment Method) .Folse (1989) also used
the same (FOSM) method for the lateral displacement of the pile top and for first
yielding of pile material. The pile was loaded with set of forces and moment and
randomized p-y curve was used. Using the single axially loaded piles, single
conducted a comprehensive reliability analysis to evaluate the error, optimum
cost, and reliability associated with the conventional method for offshore pile
design. Hansen, Madsen and Tjelta (1995),considered the pile-soil interaction in
their study.
In reliability analysis the variables which significantly influence the
judgment of safety or failure, and which are characterized by substantial
uncertainties are called random variables. When an analysis of a structure is
conducted, it gives a certain result. If the analysis is performed for (N) number of
times on the same structure with different outcome every time, then in
probabilistic theory, each analysis result is known as an event and all possible
results are form a space of event. In the analysis of laterally loaded piles, the
events are represented in terms of serviceability and strength (YTop & MMax).
Every event has some probability assigned to it. The function of the event (YTop &
MMax) which fulfills certain conditions is known as function of random variable (EI,
B, γ’, k, Ф, P).
The uncertainties (random variables) connected to the parameters of pile
material (pile bending stiffness, EI, and pile diameter, b), soil surrounding the pile
(γ’, submerged unit weight, Ф, angle of internal friction of soil, k, modulus of
subgrade reaction) and applied load (lateral load P) are considered to be
A simple application of reliability theory is shown in the figure below:
Uncertain design quantities, such as the load (F) and the capacity (Q), are
modeled as random functions of the design variables, while design risk is
quantified by the probability of failure. The basic reliability problem is to evaluate
the probability of failure by applying statistics of F and Q, which typically include
the mean (µF and µQ) and the standard deviation (σF and σQ). If both Q & F are
normally distributed, then the safety margin (M= Q-F) also is normally distributed
with the mean value (µM) and variance (σM2) (Melchers 1999) given as:
µM = µQ-µF (2.3)
2 F 2 Q 2
M σ σ
σ = + (2.4)
The overlapped area shown in Figure 2.2 is directly proportional to the
failure. Structural reliability methods are often used to evaluate the failure
performance of geotechnical structure, thus the probability of failure is taken as
an index known as the reliability index (β) which is defined as:
2 F 2 Q
F Q
M M
σ σ
µ µ
σ µ β
+ − =
= (2.5)
Figure 2.2: Reliability assessment for normally distributed load and capacity (Phoon et al, 2003)
One critical aspect in determining the reliability index is the explicit
definition of the limit state function of the system. In a problem involving
multidimensional random variables, the limit state function is the boundary
separating the safe domain from the failure domain. In this summary, Figure 2.2
can be used to investigate the reliability of serviceability (YTop) or strength (MMax)
of the pile-soil system subjected random load P. In serviceability, the load and
capacity curves can be replaced by YTop and YTopmax, therefore Eq. 2.3, 2.4, and
2.5 become:
(2.6)
(2.7)
(2.8)
where:
standard deviation of margin of safety of pile head deflection (serviceability).
mean value of margin of safety of pile head deflection (serviceability).
(2.9)
(2.10)
Cornell in 1969 developed the First-Order Second-Moment Reliability
Method (FOSM) (Cornell, C. A. (1969)). The name “First-Order Second-Moment
Reliability Method” is based on the first-order Taylor series approximation of the
limit state function and uses second moment statistics (mean and variance (or
covariance) of the function of random variables). The margin of safety (Limit
State Function) can be determined as:
Top Max Top M
Top Y Y
Y = −
Top Top
TOP Y
2 Max Y 2 M Y
2 σ σ
σ = +
(
)
M YTop
ο
M Top
σ
Y
β
=
(
YTopM)
ο ==
M YTop
σ
(
)
(
Top)
2
Y
VAR
Y
σ
Top
=
(
)
(
Max)
Top 2
Max
Y VAR Y
σ
For serviceability, it is defined as:
(2.11)
For strength, it has the following form:
(2.12)
where:
maximum allowable deflection of pile head,
maximum allowable bending moment of the pile,
YTop= deflection of the investigated pile,
MMax= maximum bending moment of the investigated pile.
While the mean value of the function of the random variables (YTop, MMax)
is the best estimate of the YTop and MMax variable without conservatism, the
variance or standard deviation is used to assess the uncertainty of functions YTop,
MMax. In general, the convenient way of defining of uncertainties is by means of
covariance Cov(YTop, MMax) as discussed in chapter four.
The probabilistic assessment of the performance of the pile-soil system is
described by the expected values of ο
Top
Y , and ο
Max
M whereas the covariance
matrix Cov(YTop, MMax) of maximum lateral deflection and maximum bending
moment defined as:
(2.13)
The determination of the variance of YTop, that is Var(YTop), which is the
random function of random variables (EI, b, γ’, k, Ф, P) is obtained in accordance
to FOSM method by means of the following formula:
= ) Var(M ) Y , Cov(M ) M , Cov(Y ) Var(Y ) M , Cov(Y Max Top Max Max Top Top Max Top Top Max Top M
Top Y Y
Y = −
Max Max
Max M
Max M M
M = −
(2.14)
where the notation |o means that the assessment of derivative of YTop is
conducted in the vicinity of it mean value of ο
Top
Y .
Similarly, the determination of the variance of MMax is obtained by the
following formula:
(2.15)
2.3.2 Methods of Reliability Analysis
Many methods have been developed and used for reliability assessments, they are:
1- Stress-strength Interference Method: it is still widely used because of its
simplicity. This method assumes that stress and strength are statically
independent parameter, an assumption which is not correct in all cases.
In 1986 Sundararajan (Sundararajan, 1986), derived a stress strength
equation for general failure criteria which is given by:
p FC(l)FL(l)dl
f
∫
∞
∞ −
= (2.16)
(
)
( )
( )
( )
( )
( )
*Var( )
PP Y γ' Var * γ' Y B Var * Y k Var * k Y Var * Y EI Var * EI Y Y Var 2 o Top 2 o Top 2 o Top 2 o Top 2 o Top 2 o Top Top ∂ ∂ + ∂ ∂ + ∂ ∂ + ∂ ∂ + ∂ ∂ + ∂ ∂ = B
φ
φ
(
)
( )
( )
( )
( )
( )
*Var( )
Pwhere Pf is the probability of failure and FL(.) & FC(.) are the cumulative density functions of L, l (load) and C (capacity), respectively.
2- First- Order Second-Moment Reliability Methods: this method is
developed by Cornell in 1969 (Cornell 1969). Its name (First-Order
Second-Moment Reliability Method) because it is based on the First-Order Taylor
Series expansion of the limit state function which uses second moment
statistics (mean and variance (or covariance) of the function of random
variables. While the mean value is the best estimate of YTop and MMax
without conservatism, the variance or standard deviation is used to assess
the uncertainty of functions YTop and MMax..
This method requires more computation than the stress-strength method,
but it is less restrictive and applicable to wider range of problems.
3- Simulation Based Reliability Method: Computer based analytical model is
developed to predict the behavior of the system. If uncertainties are
involved then the model need to be evaluated several times. Each
simulation cycle is based on a certain randomly selected set of input
parameters. Output parameters such as (YTop and MMax) are calculated from
the model. Statistical methods are used to get the mean, variance, or
distribution type of output parameters. The most recent simulation method is
Monte Carlo simulation technique.
4- Probabilistic Finite Element Method: The above methods are limited to
application of simple structures with linear behavior. If the geometry of the
system or the applied loads are complex, or if the material has nonlinear
behavior, then finite element methods are required with the statistical
method such as First- Order Second-Moment to analyze the structure.
Beacher (Baecher & Ingra 1981) used this technique also more information
on this method is available in Probabilistic Structural Mechanics Handbook
2.3.3 Risk Assessment and Probability of Failure
Risk Analysis and Assessment of Failure in Engineering and Economics
introduces the fundamental concepts, techniques, and applications to evaluate
the probability of an event and its consequences on the potential failure of the
system. However there is no generally accepted definition of the term risk.
The risk is assessed based on the situation, for example, the risks that
may affect a large number of people simultaneously are less tolerable than risks
of individual accidents. After the risk assessment is completed, we get expected
costs of failures for a project. By taking into account this expected cost of failure
and other costs such as initial and maintenance cost, we can theoretically
evaluate the project to get optimum value of reliability index.
As mentioned before, the overlapped area shown in Figure 2.2 is directly
proportional to the failure. Structural reliability methods are often used to
evaluate the failure performance of geotechnical structure. The probability of
failure is assessed by an index known as the reliability index (β).
The reliability indices for most geotechnical components and systems lie
between 1 and 5, corresponding to probabilities of failure ranging from about
0.16 to 3x10⁻⁷ (Melchers, 1999). Table 2.1 shows relationship between reliability
Table 2.1: Relationship between Reliability Index (β) and Probability of
Failure (pf) (US Army Corps for Engineers 1997)
Reliability Index (β) Probability of Failure
(pf)
Expected Performance
Level
1.0 0.16 Hazardous
1.5 0.07 Unsatisfactory
2.0 0.023 Poor
2.5 0.006 Below Average
3.0 0.001 Above Average
4.0 0.00003 Good
5.0 0.0000003 High
Probability of failure (pf) decreases as the reliability indices (β) increases.
In principle, the most economical target probability of failure (pT) can be
determined by conducting cost-benefit analysis, as shown in Figure 2.3.
By studying the variation of the initial cost, maintenance costs, and the
expected failure costs with pf, it is possible theoretically to arrive at the most
economical target probability of failure for design. This approach is not yet
practical because of the difficulties in evaluating failure costs (e.g. cost of human
lives) and the effect of component failure on the system. Another approach is to
set the value of pT at a level that is comparable with the failure rates estimated
from actual case histories (Figure 2.4).
However, comparing the theoretical probability of failure derived from
reliability computations with a value established by actual case histories is not
straightforward. It has been noted that the theoretical probability of failure usually
is significantly smaller than the actual failure rate. This result is not surprising,
because the safety of a design is not affected by uncertainties underlying design
calculations alone. It also can be severely compromised by factors such as poor
construction and human errors.
The common practice for selecting a target probability of failure for design
is to calculate the theoretical probabilities of failure implicit in existing working
value of pT. While this approach is empirical, it does possess a major advantage
of keeping the new design methodology compatible with the existing experience