GUI Model for Comparative Study of Acoustic
Wave Absorption
Dr. T. B. Mohite-Patil, Prof. T.T. Mohite-Patil, Prof. Smita A. Patil.
Principal, Dr. D. Y. Patil Pratistan’s College of Engineering Salokhenagar, Kolhapur, India
Associate Professor, Dept. of E &TC, Sanjeevan Engineering College Panhala, Kolhapur, India
Assistant Professor, Dept. of E &TC, D.Y.Patil Technical Campus, Talsande, Kolhapur, India
ABSTRACT: A MATLAB based Graphical User Interface (GUI) [1] accesses the depth (D), salinity(S), temperature (T), pressure (p) frequency (F) and pH (ph) data and evaluates coefficient of absorption The MATLAB GUI supports to plot the total absorption of sound waves traveling through the oceanic environment w.r.t. the depth and frequency. Values of Coefficient of absorption calculated by GUI model have been compared with the observed values graphically. The results are closely matching which validates applicability of the GUI model
KEYWORDS- GUI model, depth, salinity, temperature, pressure, coefficient of absorption.
I. INTRODUCTION
Because the electro-magnetic wave is highly attenuated by seawater, research on underwater communication is done
using acoustic wave [2].In recent years; the need for high-speed underwater acoustic communication to construct sensor
networks on the sea floor or to communicate with underwater vehicles has become prominent. In this paper the GUI[1]
model has been developed to calculate and represent graphically the absorption coefficient of sea water by using formulations of four different methods namely a) Francois[3,4] b) Fisher[5] c) Schulkin[6] and d) Thorp [7,8].The results are presented in the paper.
II. RELATED WORK
In [2] authors had presented a review of high speed underwater acoustic communication, focusing on the bandwidth, efficient phase coherent method. In [3] authors had presented for sound absorption in sea water as a function of frequency, temperature, and pressure based on laboratory data. The equation includes contributions to absorption due to boric acid, magnesium sulfate, and water. The effect of pressure on sound absorption due to magnesium sulfate and water has been treated differently than in the Schulkin and Marsh equation. At 4°C our results for absorption at frequencies from 10–400 kHz and pressures up to 500 atm are substantially lower than those calculated from the Schulkin and Marsh equation.In [4]. An experiment was conducted to provide an empirical evaluation of attenuation in sea water in the frequency range of 354–3540 cps. Recordings were made of solar shots detonated every 5 miles along
a 500‐mile track. The receiving elements were located near the axis of the so far channel. An analysis is outlined both
in terms of received energy spectrum and transmission loss as a function of rangeIn [5] authors had presented a simple
practical expression is given for determining frequency‐dependent sound attenuation coefficients. The expression is an
III. DATABASE
The main database necessary for acoustic propagation prediction is sound absorption coefficient. A. Sound absorption coefficient.
We have used the database of different oceans to calculate the coefficient of sound absorption .The practical values of depth, salinity, temperature, pH, pressure and frequency of sound wave propagation are used to calculate the coefficient of absorption (alpha) by the empirical formulae derived by the Francois method b) Fisher method c) Schulkin method and d) Thorp method are used to calculate the coefficient of absorption. The fig. 1 shows the GUI model of comparative study of sound absorption.
IV. SOUND ABSORPTION GUI MODEL
The fig. 1 shows the GUI model of sound absorption in sea water. The model consists of eleven edit boxes named as Depth, Temp, Pressure, Salinity and Sound speed. The data is read in this GUI model. These buttons invoke the programs which calculate the sound absorption coefficient (alpha).When the acoustic wave propagates in sea water, absorption loss occurs, which is caused by a part of the energy changing into the heat owing to the viscous friction of
the water molecule, aside from the spreading loss. The absorption loss is represented as αr, where α is the coefficient in
dB/Km and r is the transmission distance.
Fig.1 GUI model of Coefficient of Absorption of sea water
Expressions of absorption coefficient α have been proposed by various researchers on the basis of the laboratory and
sea –based experiments. Some of these expressions are shown below.
small. The third term represents the sound absorption due to pure water. The pressure dependency of above equation is shown by P1 ,P2 and P3 constants.Frequency dependency is given by f1,and f2 which are the relaxation frequencies of Boric Acid and Magnesium sulfate. f is the frequency of sound. The constants A1, A2 and A3 shown are not purely constants but it has been experimentally proved that their values vary with the water properties, like temperature, salinity and pH of water.
The total coefficient of absorption of sea water is calculated by considering separately the absorption due to boric acid, magnesium sulphate and pure water. Separate contribution by the ingredients has been given below.
Following formulae have been used to calculate the coefficient of absorption of sea water. On entering the depth (d), temperature (t), pressure(p),salinity(s),pH and frequency in edit boxes and pressing the push button ‘plot(Alpha v/s d)’ displays the graph of coefficient of absorption v/s depth and pressing the push button ‘plot(Alpha v/s f)’ displays the graph of coefficient of absorption v/s frequency .
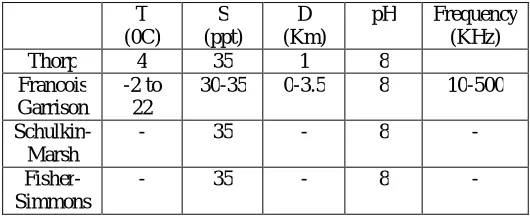
Table I. Coverage of parameters in each equation.
T (0C)
S (ppt)
D (Km)
pH Frequency
(KHz)
Thorp 4 35 1 8
Francois Garrison
-2 to 22
30-35 0-3.5 8 10-500
Schulkin- Marsh
- 35 - 8 -
Fisher- Simmons
- 35 - 8 -
2 1 1 1
1 2 2
1
(0.78 pH - 5) -1 -1
1
1
0.5 4 - 1245
θ
1
Absorption coefficient due to Boric Acid
8.86
A = 10 , dB Km KHz c
P =1,
S
f =2.8 10 ,
35
AP f f attn
f f
0
0 00
KHz
Where c is the sound speed (m/s), given by c=1412+3.21T+1.19 S+0.0167 D,
T is the temperature( C),
θ=273+T,
4
2 2 2 2
2 2 2
2
-1 -1
2
-4 -9 2
2
1990 8 - θ
2
Absorption coefficient due to MgSO
S
A =21.44 1+0.025T dB Km KHz c
P =1-1.37 10 D+6.2 10 D
8.17 10
f =
1+0.0018 S-35
A P f f attn f f 2 3 3 0
-4 -5 -7 2 8 3 -1 -2
3
0
KHz
Absorption coefficient due to Pure Water
3
For T 20 C,
A =4.937 10 -2.59 10 T+9.11 10 T - 1.50 10 T dB Km KHz
For T 20 C,
A
attn A P f
-4 -5 -7 2 -10 3 -1 -2
3
5 10 2
3
=3.964 10 -1.146 10 T+1.45 10 T - 6.5 10 T dB Km KHz
P =1 - 3.83 10 D + 4.9 10 D
The empirical expression of Thorp is shown as a function of the frequency by
2 4
2 2
43.7 0.109
3.01 10 (dB/Km)
4100 1
Where f is the frequency in KHz
f f f
The expression of Schulkin Marsh is shown as function of the frequency, salinity, temperature, pressure, pH, and speed of sound as
2 2 2
3 4
2 2 2 2
(0.69 6) 5
2( )
= 10 1 6.54 10 8686 (dB/Km)
Where
( ) 3.1 10 10 (Np/wavelength),
r r T
T
r T
pH r
f f SAf f Bf
x x p
c f f f f f
2 2
1 1 1 2 2 2
2 2 2 2
1 2
2 3 3
8 10 12 2
1 1700/ 273.1 3 1 8 10 2 7 2
8686 (dB/Km),
Where
1.03 10 2.36 10 5.22 10 (s/m)
1.32 10 273.1 exp (Hz)
A 5.62 10 7.52 10 (s/m)
1.55 10 27
A P f f A P f f
f f f f
T
A P f
A T T
f T T f T
3052/ 273.14 7 2
2
2 2 4 3 15 2
3
4 8 2
3
0
3.1 exp (Hz)
1 10.3 10 3.7 10 ,
(55.9 2.37 4.77 10 3.48 10 ) 10 (s / )
1 3.84 10 7.57 10
Where f is frequency in Hz, T is temperature in C, and
T
p p p
A T T T m
p p p
p is the pressure in atm
V. RESULTS
Fig.2 Comparison GUI model results with observed values of sound absorption (alpha) at NE Pacific
Fig.3 Comparison GUI model results with observed values of sound absorption (alpha) at Baffin Bay
The results obtained from GUI model for different methods on comparison with the observed values of coefficient of absorption clearly show that the results by Francois and Garrison method are closely match in with the observed values.
VI. CONCLUSION
The GUI model of sound absorption can predict the coefficient of absorption at any place on the earth which can be used to adjust the gain of an amplifier for faithful reception.
VII. ACKNOWLEDGMENT
This work was supported with the practical results provided by A. K. Saran Scientist from the National Institute of oceanography Goa India.
REFERENCES
1. MATLAB software user manual, Math works Inc.
2. M. Stojanovic “Recent advances in high-speed underwater acoustic communications” IEEE J. Oceanic Eng. 21(1996) 125.
3. R.E.Francois and G.R. Garrison,”Sound absorption based on ocean measurements .PartII:Boric acid contribution and equation for total absorption,” J. Acoustic. Soc. Am. 72(6), 1879— 1890(1982).
4. F. H. Fisher and V. P. Simmons, “Sound absorption in sea water,” The Journal of the Acoustical Society of America, vol. 62, no. 3, pp. 558–564, 1977.
5. W. H. Thorp, “Deep-Ocean Sound Attenuation in the Sub- and Low-Kilocycle-per-Second Region”J. Acoust. Soc. Am. 38 (1965) 648.
6. W. H. Thorp “Analytic Description of the Low-Frequency Attenuation Coefficient” J. Acoust. Soc. Am. 42 (1967) 270.
7. Z. Peng, J. Cui, B. Wang, K. Ball, and L. Freitag, “An underwater network testbed: design, implementation and measurement,” in WuWNet ’07: Proceedings of the second workshop on underwater networks, (New York NY, USA), pp. 65–72, ACM, 2007.
8. J. Proakis, E. Sozer, J. Rice, and M. Stojanovic, “Shallow water acoustic networks,” IEEE Communications Magazine, vol. 39, no. 11, pp. 114–119, 2001.
9. Chen and Millero, "The Sound Speed in Seawater", J. Acoust. Soc. Am. 62 (1977), 1129-1135 Derivatives of the EOS80 equation of state for seawater and the adiabatic lapse rate.
10. Am. 69(3), pp 862-863
Mrs. Mohite-Patil T. T. is currently working as an Associate Professor in the dept. of Electronics in Sanjeevan College of Engineering Panhala Kolhapur. She has published about 12 papers in national and international journals. Her fields of interest are Networking and Image processing etc. She has completed her graduation and post graduation in Electronics and also she has completed MBA in human resources. She has successfully counseled many students and couples. She has consulted many educational institutes.