Comparative Analysis of Drop-Call
Probability Due to Handover and Other
Factors
Nathaniel Tarkaa1, Joseph Mom2
Ph.D. Scholar, Dept. of EEE, UAM, Makurdi, Nigeria1
Senior Research Fellow, Dept. of EEE, UAM, Makurdi, Nigeria2
ABSTRACT: Drop-call probability is one of the most important quality of service indexes for monitoring performance of cellular networks. For this reason, mobile phone operators apply many optimization procedures on several service aspects for its reduction. In order to provide an uninterrupted communication, a call has to be switched over to appropriate base station, at the correct time. This process is known as handover. Failure of the handover process usually results in dropped calls. It has been found that drop-call probability models based on handover are only useful during the early phase of mobile network deployment. However, in a well-established network, it has been found that call dropping is mainly due to electromagnetic causes; irregular user behaviour and abnormal network response. It is obvious from these findings that estimates of the drop-call probabilities due to handover and the other factors could be deployed for cellular network performance analysis. Therefore, in this paper, starting with operational data collected from a GSM network, the drop-call probabilities due to handover and the other factors respectively are calculated and compared. The results of the analysis reveals that the GSM network needs further optimization as handover drop-call probability surpasses the drop-call probability due to other factors across all the six MSC areas of the network.
KEYWORDS: Cellular Network, Drop-call Probability, Handover, Optimization, Traffic Parameters.
I. INTRODUCTION
the maximization of network usage, the minimization of congestion, and the traffic balancing among surrounding cells have been obtained as a result of the network management.
Handover (as used in Europe) or handoff (as used in North America) is the mechanism that transfers an ongoing call from one cell to another as a user moves through the coverage area of a cellular system. Handover is an important aspect of cellular and mobile communications [5], [6]. Typically, a mobile terminal (MT) has a radio link to a Base Station Subsystem (BSS) that provides “best service” to the mobile terminals currently located within a cell. A cell’s BSS provides a radio link to each mobile terminal active in this cell. One or more BSSs are in turn, under the control of a Mobile Services Switching Centre (MSC). Beside other functions, an MSC has the primary responsibility of managing mobility. When an MT moves, it is quite possible that the currently serving BSS may no longer be able to provide reasonable quality of service as compared to some other BSS. Rather dropping the service to this MT, the currently serving MSC may decide to handover this service to some other better serving BSS or in some cases to another MSC. Occasionally, this handover process fails and the call drops. Several different handover techniques have been proposed and implemented in various cellular networks for reducing the handover call dropping probability. The simplest handover scheme is the one in which the MT is solely responsible for making handover decisions. When the received signal quality drops below an acceptable threshold, the MT may decide to choose another base station, i.e., the handover decision by the MT, as in the Wireless Access Communication System (WACS), Digital Enhanced Cordless Telecommunications (DECT) wireless systems and the mobile IP networks [5]. Alternatively, the network can be assigned the sole responsibility of making handover decisions, as in the integrated cellular wireless networks and the first generation analogue cellular networks. This approach, called the Mobile Assisted Handover (MAHO) is currently being used in the second and third generation digital cellular networks, e.g., GSM, IS-54 and IS-36 Digital Advanced Mobile Phone Service (DAMPS) [5]. In another scheme, these two approaches are combined so that handoff decisions can be made jointly by the network and mobile terminals.
Propagation (or electromagnetic) conditions are often the causes of radio frequency interference and signal attenuation (example multipath fading, shadowing and distance losses), which are the main factors responsible for call dropping. For this reason, various techniques and schemes are employed in the planning, design and optimization of cellular networks to combat these propagation effects. This normally covers the network physical configuration which includes all aspects of network infrastructure deployment – locations of base stations, heights of towers, sector azimuth orientations, antenna selection and tilting, etc. [4].
This study aims to evaluate an operative GSM network based on the findings of the above previous works [1], [2]. That is, in a well-established cellular network, it is not possible to find a prevailing cause of call dropping, but rather a mix of heterogeneous and independent causes; and that drop-call probability models based on handover are only useful during the early phase of mobile network deployment. Towards this end, starting with traffic parameters collected separately for handover and other drop-call factors from an operative GSM network in Nigeria, the respective drop-call probabilities are calculated and the results are compared.
The rest of the paper is organized as follows: The basic concepts of network traffic are discussed in section 2. In section 3, the methodology is presented. This is followed by a discussion of results of the analysis in section 4. Lastly in section 5 is the conclusion.
II. THE BASIC CONCEPTS OF NETWORK TRAFFIC
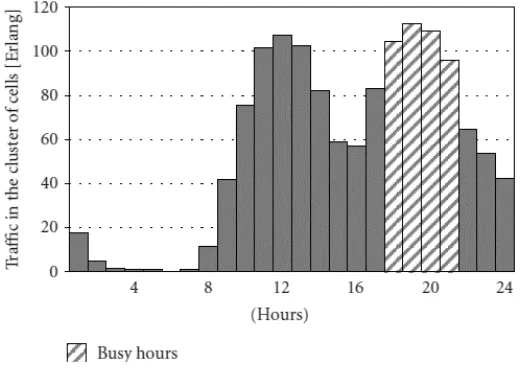
the density of the traffic. Fig. 1 shows daily traffic variation in a cluster of cells [1]. Some commonly used terms in traffic theory are discussed in the following subsections as can be found in [8]-[11].
Fig. 1: Daily traffic variation in a cluster of cells
Call Arrivals
The term call arrivals is used for incoming calls and outgoing calls. Incoming calls refer to those being received by a user, and outgoing calls refer to those being initiated by the user. Since every incoming call for one user must be originated from an outgoing call of another user, we only need to consider outgoing calls from each user when we analyse the network traffic. Thus the term call arrival means outgoing call arrival.
Holding Time
Outgoing calls are initiated randomly. If a call arrives and the conversation is successfully established, both the caller and the receiver will be engaged for a certain duration commonly known as holding time. The length of the holding time is also a random variable. Thus the traffic load depends on the rate of call arrivals and the holding time for each call.
Traffic Intensity
If the traffic is examined over a sufficiently long period of time (e.g., 60 min), we can obtain the average call arrival rate, λi, which is the average number of call arrivals per unit time, for user i. Thus for the whole network, the average
call arrival rate is given as follows:
=
Where N is the total number of users in the network.
A commonly used measure of traffic is the traffic intensity, which represents the load presented to a system, or the amount or volume of traffic handled by a group of trunks or switches over a period of time. It is given as follows:
= ℎ
In a telephone network, there are two distinct kinds of traffic: offered traffic and carried traffic.
Offered Traffic
Offered traffic is the total traffic that is being requested.
Carried Traffic
Carried traffic is the actual traffic that is being carried by the network.In practice, due to limited network capacity and some user behaviour, a certain percentage of the offered traffic experiences network blocking, or is lost. Hence the carried traffic is smaller than the offered traffic. The carried traffic can be expressed as follows:
Traffic carried = traffic offered – traffic lostOr Acarried = Aoffered – Alost
Also, blocking probability, which is the probability a call will be lost due to congestion is given by:
= =
Or
=
Substituting for
= − = 1− = ℎ 1−
Erlang-B Formula
The Erlang-B formula is given as follows:
= !
∑ !
Where B = Erlang-B loss probability, A = offered traffic intensity, N = available number of circuits andk = number of users.
To determine the maximum amount of offered traffic to a group of N trunks under a specified grade of service or loss probability, the Erlang-B traffic table is used. Alternatively, a software known as Erlang-B calculator can be used.
Trunking Efficiency
Trunking efficiency is a measure of channel utilization, and is defined as follows:
=
ℎ
Utilization Factor
=
ℎ
Drop-call Rate
Drop-call rate is a measure of lost calls in busy hour and is defined as:
− =
Call dropping events constitute a Poisson process. Let be its intensity. Hence, if Y is the random variable which counts the number of drops, the probability that there are n drops in the interval T= t is [1]:
( = ) =( ) !
≥0
The Concept of Busy Hour
The telephone network is usually measured in terms of the average activity during the busiest hour of a day. Busy hour is the given period within a day that bears the highest traffic intensity. The busy hour traffic is used to work out the equipment quantities of the network. The reason to use busy hour traffic is that, this period usually has the highest amount of blocked or lost calls. If the dimensioning of equipment at this period is correct and blocked calls can be minimised, all other non-busy hour traffic should then be handled satisfactorily.
III. METHODOLOGY
The primary data for this study were collected from an operative GSM network in Nigeria from six MSC regions, namely Ibadan, Kaduna, Port Harcourt, Abuja, Enugu and Lagos. The primary data included the following:
i. Number of call attempts in busy hour, iv. Call drop rate due to handover,
ii. Call drop rate in busy hour due other factors, v. Total number of active base stations in the six MSCs.
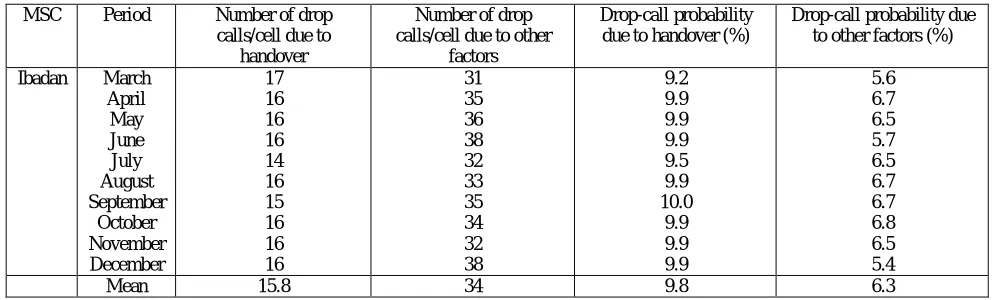
First, using the drop call rate dueto handover, the primary data were analyzed to determine values, per cell, of the number of dropped calls using some of the formulae in section 2. Similarly, the analysis was made using drop call rate due to other factors. Then the drop-call probability due to handover and other drop-call factors respectively were statistically estimated using Poisson probability distribution function from Microsoft Excel. The summary of the results are shown in tables 1-6 representing the six MSC regions of the GSM network.
Table 1: Drop-call Probability performance for Ibadan MSC
MSC Period Number of drop calls/cell due to
handover
Number of drop calls/cell due to other
factors
Drop-call probability due to handover (%)
Drop-call probability due to other factors (%)
Ibadan March April May June July August September October November December 17 16 16 16 14 16 15 16 16 16 31 35 36 38 32 33 35 34 32 38 9.2 9.9 9.9 9.9 9.5 9.9 10.0 9.9 9.9 9.9 5.6 6.7 6.5 5.7 6.5 6.7 6.7 6.8 6.5 5.4
Table 2: Drop-call Probability performance for Kaduna MSC
MSC Period Number of drop calls/cell due to
handover
Number of drop calls/cell due to other
factors
Drop-call probability due to handover (%)
Drop-call probability due to other factors (%)
Kaduna March April May June July August September October November December 18 14 13 10 16 13 15 15 9 18 35 58 50 52 37 55 47 48 47 49 5.7 10.6 10.5 6.4 8.8 10.5 10 10 4.6 5.7 0.7 2.4 5.6 5.1 1.7 3.2 5.8 5.8 5.8 5.6
Mean 14.1 48 8.3 4.2
Table 3: Drop-call Probability performance for Port Harcourt MSC
MSC Period Number of drop calls/cell due to
handover
Number of drop calls/cell due to other
factors
Drop-call probability due to handover (%)
Drop-call probability due to other factors (%)
Port Harcourt March April May June July August September October November December 9 14 13 23 18 17 20 14 12 11 68 65 60 58 75 73 66 66 70 60 3.1 10.2 9.4 14.0 7.2 8.6 4.3 10.2 8.1 6.5 4.0 4.8 4.8 4.3 2.6 3.3 4.9 4.9 4.3 3.9
Mean 15.1 66 8.2 4.2
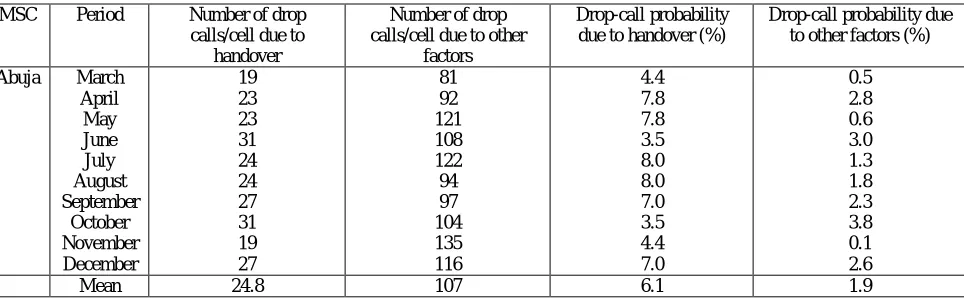
Table 4: Drop-call Probability performance for Abuja MSC
MSC Period Number of drop calls/cell due to
handover
Number of drop calls/cell due to other
factors
Drop-call probability due to handover (%)
Drop-call probability due to other factors (%)
Abuja March April May June July August September October November December 19 23 23 31 24 24 27 31 19 27 81 92 121 108 122 94 97 104 135 116 4.4 7.8 7.8 3.5 8.0 8.0 7.0 3.5 4.4 7.0 0.5 2.8 0.6 3.0 1.3 1.8 2.3 3.8 0.1 2.6
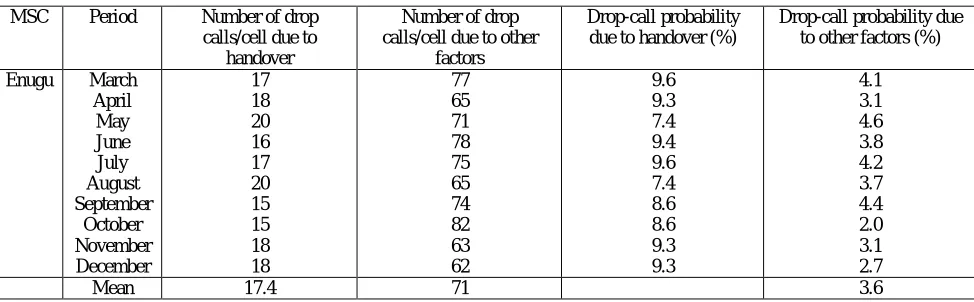
Table 5: Drop-call Probability performance for Enugu MSC
MSC Period Number of drop calls/cell due to
handover
Number of drop calls/cell due to other
factors
Drop-call probability due to handover (%)
Drop-call probability due to other factors (%)
Enugu March April May June July August September October November December 17 18 20 16 17 20 15 15 18 18 77 65 71 78 75 65 74 82 63 62 9.6 9.3 7.4 9.4 9.6 7.4 8.6 8.6 9.3 9.3 4.1 3.1 4.6 3.8 4.2 3.7 4.4 2.0 3.1 2.7
Mean 17.4 71 3.6
Table 6: Drop-call Probability performance for Lagos MSC
MSC Period Number of drop calls/cell due to
handover
Number of drop calls/cell due to other
factors
Drop-call probability due to handover (%)
Drop-call probability due to other factors (%)
Lagos March April May June July August September October November December 21 15 18 18 21 16 16 18 18 18 46 50 51 44 46 51 43 45 44 45 6.7 8.0 9.4 9.4 6.7 8.9 8.9 9.4 9.4 9.4 5.6 5.4 5.1 5.1 5.9 4.5 5.3 5.8 5.6 5.8
Mean 17.9 47 8.6 5.4
IV. ANALYSIS OF THE RESULTS
In this study, we want to do a comparison between the drop-call probability due to handover and the drop-call probability due to other factors. Towards this end, the results of the data analyses are further expressed graphically as shown in figs. 2-7. It can be seen that in all the six MSC regions of the GSM network, the curve of the drop-call probability due to handover is mostly situated above the curve of drop-call probability due to other factors. This is a clear indication that the network is not well-established yet. This is because in a well-established network, as stated earlier, call dropping due to handover is usually negligible, dominated by the call dropping due to other factors. That is to say, the network requires further optimization.
Analysis of Ibadan MSC
Fig. 2: Drop-call Probability performance analysis for Ibadan MSC
Analysis of Kaduna MSC
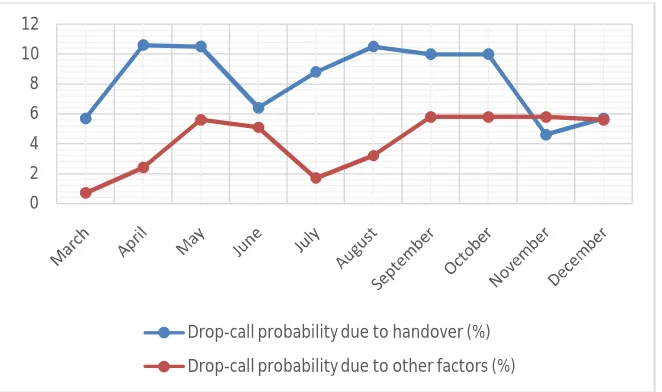
Fig. 3 shows the drop-call probability performance analysis for Kaduna MSC. It can be noticed that the curve of the drop-call probability due to handover is situated above that of the drop-call probability due to other factors. The network’s optimization is low between the months of March and May and it improves between the months of May and June. The network witnessed low optimized state from June until October. A slight improvement can be noticed as from September with both probabilities remaining constant until the network becomes highly optimized from November to December; the drop-call probability curve due handover for the first time lies below the drop-call probability curve due to other factors. The variation of both probabilities is rapid, which implies that the stability of the network is affected by both lack of communication resources and propagation conditions.
Fig. 3: Drop-call Probability performance analysis for Kaduna MSC
0 2 4 6 8 10 12
Drop-call probability due to handover (%)
Drop-call probability due to other factors (%)
0 2 4 6 8 10 12
Drop-call probability due to handover (%)
Analysis of Port Harcourt MSC
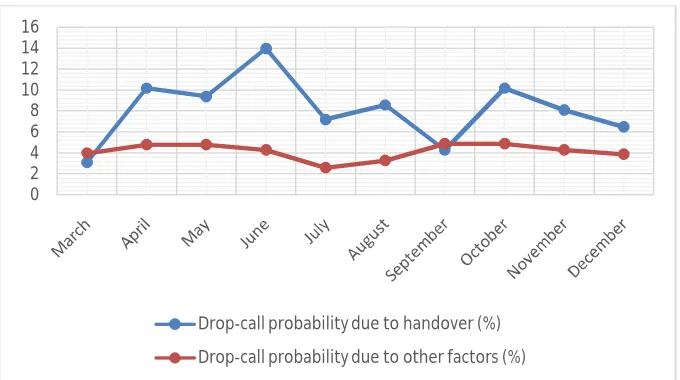
Fig. 4 shows the drop-call probability performance analysis for Port Harcourt MSC. The curve of the drop-call probability due to handover is mostly situated above the curve of the drop-call probability due to other factors, which implies that the network is similarly not well established in this region. It can be seen that the drop-call probability due to handover varies more rapidly than the drop-call probability due to other factors signifying that the network has more optimization problems with availability of communication resources than with propagation conditions. The optimized condition of the network was best in the months of March and September since during this period, the curve of the drop-call probability due to handover is below the curve of the drop-call probability due to other factors. The network’s optimization condition degraded rapidly as from the month of May and peaked at a handover drop-call probability of 14%. Also, the network’s optimized condition can be seen improving from September towards December.
Fig. 4: Drop-call Probability performance analysis for Port Harcourt MSC
Analysis of Abuja MSC
Fig. 5 shows the drop-call probability performance analysis for Abuja MSC. As usual, the curve of the drop-call probability due to handover is mostly situated above the curve of the drop-call probability due to other factors. This is a first indication that the optimized condition of the network is not stable. Then the rapid variations noticed in both curves indicates that the network’s condition is influenced by both lack of communication resources and electromagnetic factors. It can be seen that the network’s best conditions occur between the months of May and July, and between September and December with climaxes in the months of June and October respectively. On the other hand, the networks worst conditions occur between the months of March and May; July and September; and from November onwards.
0 2 4 6 8 10 12 14 16
Drop-call probability due to handover (%)
Fig. 5: Drop-call Probability performance analysis for Abuja MSC
Analysis of Enugu MSC
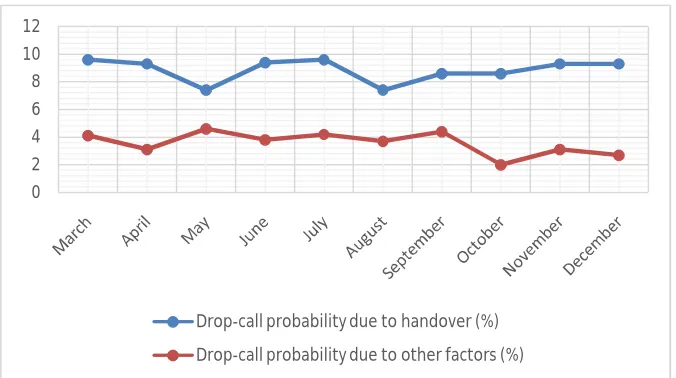
Fig. 6 shows the drop-call probability performance analysis for Enugu MSC region. The curve of the drop-call probability due to handover is situated above the drop-call probability curve due to other factors like in the other regions, which implies that the network also needs further continuous optimization procedures. Both curves exhibit slow variations for the entire operational period, which implies that the network’s optimization condition remains somewhat unchanged during the operational period.
Fig. 6: Drop-call Probability performance analysis for Enugu MSC
Analysis of Lagos MSC
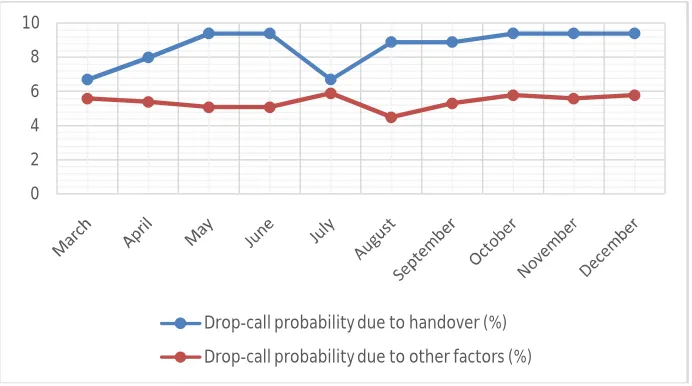
Fig. 7 shows the drop-call probability performance analysis for Lagos MSC region. The curve of the drop-call probability due to handover is mostly situated above the curve of the drop-call probability due to other factors, which implies that the network is similarly not well established in this area. It can be seen that the network started with better optimization in the month of March. However, beyond this month, the performance deteriorated progressively until the
0 2 4 6 8 10
Drop-call probability due to handover (%)
Drop-call probability due to other factors (%)
0 2 4 6 8 10 12
Drop-call probability due to handover (%)
month of May where it remained constant up to June. Then, the network became increasingly optimized from the month of June and reached a maximum point in the month of July. Beyond the month of July, the network experienced increasing degradation until the month of August from where its condition became constant for the rest of the operational period. The graph shows more sharp variations in the handover call probability curve than in the drop-call probability curve due to other factors. This shows that the optimized condition of the network is mostly affected by variations in the communication resources.
Fig. 7: Drop-call Probability performance analysis for Lagos MSC
V. CONCLUSION
The operation of a cellular network can be interpreted to consist of a sequence of events. From the network operation point of view, certain events are closely associated with bad performance [12]. The number of undesired events such as blocked channel requests and dropped calls during a measurement period are stored by a set of corresponding counters and printed as operational reports. The optimization of operative networks based on the analysis of such reports is aimed at minimizing the number of occurrences of such events. In this paper, the optimization performance of an operative GSM network is evaluated by comparing the drop-call probabilities due to handover and other factors respectively estimated over a measurement period of about one year. The veracity of this procedure is ascertained according to the classic work as reported in references [1] and [2]. That is, in a well-established cellular network, it is not possible to find a prevailing cause of call dropping, but rather a mix of heterogeneous and independent causes; and that drop-call probability models based on handover are only useful during the early phase of mobile network deployment. The calculation of drop call probabilities is done using the operational data that werecollected fromthe GSM network. The results of the analysis reveals that the GSM network needs further optimization as handover drop-call probability surpasses the drop-drop-call probability due to other factors in all the MSCs. Hence, the proposed approach may be found useful in the continuous optimization of an operating GSM network until it becomes fully established.
REFERENCES
[1].Gennaro Boggia, Pietro Cammarda and Allessandro D’Alconzo, “Modelling of Call Dropping in Well-established Cellular Networks”, EURASIP Journal on Wireless Communications and Networking, Vol. 2007, Article ID 17826, October, 2007.
[2].G. Boggia, P. Cammarda, A. D’Alconzo, A. De Biasi and M. Siviero, “Drop-call Probability in Established Cellular Networks: From Data Analysis to Modelling”, DEE – Politenico di Bari, Via E. Orabona, $ - 70125 Bari (Italy), Proc. IEE VTC Spring 2005, Vol. 5, pp2775-2779, 2005.
0 2 4 6 8 10
Drop-call probability due to handover (%)
[3].J.M. Mom, N.S. Tarkaa and C.I. Ani, “The effects of Propagation Environment on Cellular Network Performance”, American Journal of Engineering Research, Vol. 02, Issue 09, pp 31-36, 2013.
[4].N.S. Tarkaa , J. M. Mom, and C.I. Ani, “Drop-call Probability factors in cellular networks”, International Journal of Scientific and Engineering Research, Volume 2, Issue 10, pp 1-5, 2011.
[5].B.B. Madan, S. Dhamaraja and K.S Trivedi, “Combined Guard Channel and Mobile Assisted Handoff for Cellular Networks”, IEEE Transactions on Vehicular Technology, 2006.
[6].Guenter Haring, Raymond Marie, Ramon Ruigjaner and Kishor Trivedi, “Loss formulas and their application to optimization for cellular Networks”, IEEE Transactions on Vehicular Technology, Vol.50, No. 3, 2001.
[7].Ejide, Robert Saturday, Telephone traffic forecasting by Least Square Model: A case study of NITEL, North East Zone, Kaduna, MSc Thesis, Department of Electrical Engineering, Ahmadu Bello University, Zaria, Nigeria.
[8].Roger L. Freeman, “Fundamentals of Telecommunications”, Second Edition, John Wiley & Sons, Inc.,Publication, 2005, pp 55.58. [9].Vijay K. Garg, “Wireless communications and networking”, Morgan Kaufman, San Francisco, 2007.
[10].International Telecommunications Union, “Teletraffic Engineering Handbook”, ITU DSG 2/16 & ITC Draft, pp 17-22,2001.
[11].D.D. Dajab, N.S. Tarka, and B.G. Bajoga, “Simulation and Analysis of Drop-call Probability Model, a Case Study of MTEL”, Nigerian Journal of Engineering, Vol, 16, No 1, 2009.