Comparative Analysis of H-shaped RC frame
Structures with and without Shear Wall as per
IS1893-2002 and IS1893-2016
Ajay Salimath 1, Rajeeva S. V.2
P.G. Student, Department of Civil Engineering,SJB Institute of Technology, Bengaluru, Karnataka, India1
Professor, Department of Civil Engineering, SJB Institute of Technology, Bengaluru, Karnataka, India2
ABSTRACT:Highrise structures are mostly affected by lateral loads and vulnerable to seismic forces. One of the main
causes for failure of structures is their irregularity (either plan irregularity or vertical irregularity). In this study, the response of irregular structure with shape H situated in seismic zone V are evaluated. For the analysis, 25 storey building is considered. The analytical methods used in this dissertation work are response spectrum method and time history method. The seismic parameters for earthquake loads and functions are set as per 2002(1), IS1893-2016(1) and IS 16700-2017 and time history method is carried out using BHUJ earthquake data. The FEA software ETABS v15 is used for analysis. Also, the presence of shear wall and the behaviour of structure by its inclusion is studied. For the study, totally eight models are considered which are H-shaped structures (with and without shear wall analysed using linear and non-linear dynamic method for IS1893-2002 and IS1893-2016). In this work, various parameters like storey drift, storey displacement, time period, base shear and modal mass participation ratio are obtained for all the models and have been compared. Also, the column forces at re-entrant corner and interior column is compared.
KEYWORDS:Seismic force, irregularity, response spectrum method, time history method, 2002(1),
IS1893-2016(1), IS16700-2017, BHUJ earthquake, ETABS v15, re-entrant corners.
I. INTRODUCTION
the sudden release of energy below the ground. It is usually associated with the faulting or breaking of rocks. It is a sudden tremor or movement of the earth’s crust, which originates naturally at or below the surface. It excludes shock waves caused by nuclear test, manmade explosions etc. about 90% of all earthquakes, result from tectonic events, primarily movement on the faults[9] [10].
The earthquake forces due to the seismic waves produce vertical and horizontal ground motions. The vertical load due to ground motion is of lesser magnitude and can be withstand as the structure is designed for more factor of safety and according to is1893-2002 the analysis is ignored, but according to is 1893-2016 design for vertical earthquake effects is to be considered for structures with plan and vertical irregularity situated in seismic zone or and resting on soil type 3 (soft soil). Hence, 2/3rd of the lateral load due to earthquake is considered as vertical load for design. The building designed to resist the vertical gravity and seismic loads cannot resist the horizontal loads or lateral loads and due to lateral seismic loads, the structures are more vulnerable. The design engineer should take into account both the vertical and lateral loads (gravity, seismic, wind, etc.) on the buildings and should design for the worst condition considering the surroundings. The seismic loads are considered as per the is code is1893-2002 but recently it has been updated as is1893-2016. The greatest challenges of the recent days for a design engineer is to design a building seismic resistance.
II. LITERATUREREVIEW
[Bagheri et al., (2012)] modelled a 20 stories irregular building and analysed using software’s ETABS and SAP 2000
previously occurred ELECENTRO earthquake was considered for the time history analysis. From the results obtained through analysis, base shear, time period, column forces for all the different models were obtained. [Manilal M. and S. V. Rajeeva (2017)]
studied the horizontal irregularity (re-entrant corners). The paper focuses on the comparison of regular building with re-entrant corner buildings by conducting time history analysis located in seismic zone V. The time history analysis is carried out for BHUJ earthquake. The RC frame multi storied structure are modelled and analysed using FE software ETABS. The evaluation and comparison of the regular and irregular buildings has been done using the parameters storey displacement, storey drift, time period and base shear. Also, the forces on the columns near the re-entrant corner has been studied. [Bhattarai et al., (2017)] studied the behaviour of three G+10 storied buildings with different plans have been considered, one square shaped regular model and other two H shaped and hexagonal shaped models with horizontal irregularities. All models are located in Bangalore region with a seismic zone II. Analysis of these models is carried out using ETABS software. linear static method was used in the study of the models and results for various parameters was obtained like storey drift, storey displacement, storey shear, shear force and bending moment with and without shear wall. Comparison between three models with these parameters was done and it was found that the H-shaped model with shear wall gave better resistant to seismic load compared to other models and hence was chosen as the best frame.
III. MODELSCONSIDEREDFORANALYSIS
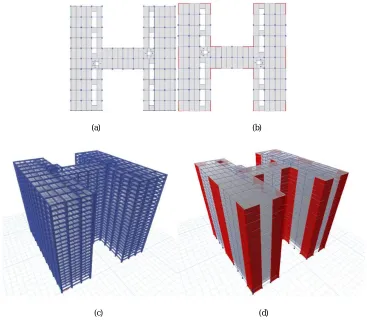
Eight models are modelled with H-shape and analysed. Models M1, M2, M5 and M6 are without shear wall and M3, M4, M7 and M8 are with shear wall. M1, M2, M3 and M4 are analysed using response spectrum method and M5, M6, M7 and M8 are analysed using time history method. M1, M3, M5 and M7 satisfy the codal provisions as per IS 1893-2002(1) and the other models are as per IS 1893-2016(1).
(a) (b)
(c) (d)
IV. MODELDETAILS Bay in both direction: 8m
No. of bays in both direction: 10 Storey height: 4m and 3.2m Stories: G+25
Concrete grade: M50-M25 Steel grade: Fe500 and Fe415
Beam sizes (in mm): 300x450, 300x600 and 450x750 Column sizes (in mm): 300x600 and 1000x1000 Thickness of slab: 165mm
Thickness of shear wall: 300mm Density of concrete: 25kN/m3 Live load: 5 kN/m3
Floor finish: 1.5 kN/m3, 2 kN/m3 and 4 kN/m3 Load on beam: 10kN/m
Seismic Parameters Seismic Zone, Z: V=0.36 Importance factor, I: 1 and 1.2 Response reduction factor, R: 5 Soil type: 1 (hard soil)
BHUJ earthquake data for time history analysis
Wind Load Parameters Wind speed: 50 m/sec Terrain category: 2 Structural class: C
Risk co-efficient (probability factor), k1: 1
Terrain, height and structure size factor, k2: as per height
Topography factor, k3: 1
V. RESULTSANDDISCUSSIONS
The H-shaped structure with and without shear wall are analysed as per codal provisions in IS 2002(1), IS 1893-2016(1) and IS 16700-2017 using linear and non-linear dynamic analysis (response spectrum method and time history method respectively) and the results are obtained and compared.
5.1 Response Spectrum Method
Model M1, M2, M3 and M4 are analysed using response spectrum method. M1 and M2 are models without shear wall and M3 and M4 are models with shear wall. Models M1 and M3 are analysed as per IS 1893-2002(1) and M2 and M4 are analysed as per IS 1893-2016(1).
The storey displacement and storey drift ratio are compared in three cases, case1. models without shear wall, case2. models with shear wall and case3. models with and without shear wall for models analysed as per IS 1893-2016.
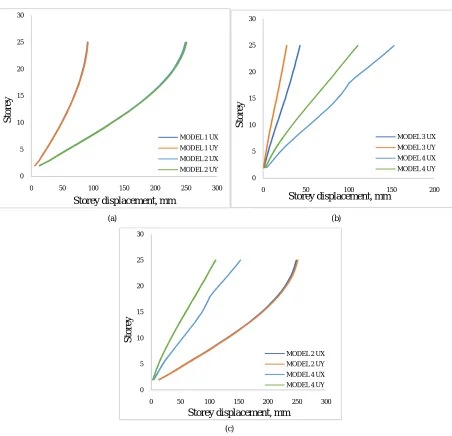
5.1.1 Storey Displacement
Case 1: Models without shear wall, the models analysed as per the codal provisions in IS 1893-2016 have higher values of storey displacement than the models analysed as per IS 1893-2002 and also exceed permissible limits, this is due to the higher factor of safety considered in IS 1893-2016.
(a) (b)
(c)
Fig. 2. Storey displacements (a) Model M1 and M2 (b) Model M3 and M4 (c) Model M2 and M4
Case 2: Models without shear wall, the models analysed as per the codal provisions in IS 1893-2016 have higher values of storey displacement than the models analysed as per IS 1893-2002 but both the values are within the limits, this is due to the higher factor of safety considered in IS 1893-2016.
Case 3: Models with and without shear wall analysed as per IS1893-2016, the inclusion of shear wall to the structure decreases displacement. On an average the decrease in displacement for models with shear wall compared to models
0 5 10 15 20 25 30
0 50 100 150 200 250 300
S
to
re
y
Storey displacement, mm
MODEL 1 UX MODEL 1 UY MODEL 2 UX MODEL 2 UY
0 5 10 15 20 25 30
0 50 100 150 200
S
to
re
y
Storey displacement, mm
MODEL 3 UX MODEL 3 UY MODEL 4 UX MODEL 4 UY
0 5 10 15 20 25 30
0 50 100 150 200 250 300
S
to
re
y
Storey displacement, mm
without shear wall is 36%. The storey displacement of the structure can be decreased and brought within the limits by adding shear wall to the structure.
5.1.2 Storey Drift Ratio
The allowable storey drift ratio is 0.004.
Case1: Models without shear wall,the models analysed as per the codal provisions in IS 1893-2016 have higher values of storey drift ratio than the models analysed as per IS 1893-2002 and exceed the permissible limit, this is due to the higher factor of safety considered in IS 1893-2016.
Case 2: Models without shear wall,the models analysed as per the codal provisions in IS 1893-2016 have higher values of storey drift ratio than the models analysed as per IS 1893-2002, but are within the permissible limits, this is due to the higher factor of safety considered in IS 1893-2016.
Case 3: Models with and without shear wall analysed as per IS1893-2016, the storey drift ratio for models without shear wall is higher than the models with shear wall and also exceed the permissible value. Hence, it can be concluded that the inclusion of shear wall to the models decreases storey drift ratio of the structure.
(a) (b)
0 5 10 15 20 25 30
0 0.001 0.002 0.003 0.004 0.005 0.006
S
to
re
y
Storey drift ratio
MODEL 1 DRIFTX MODEL 1 DRIFTY MODEL 2 DRIFTX MODEL 2 DRIFTY
0 5 10 15 20 25 30
0 0.001 0.002 0.003 0.004
S
to
re
y
Storey drift ratio
(c)
Fig. 3. Storey drift ratio (a) Model M1 and M2 (b) Model M3 and M4 (c) Model M2 and M4
5.2Time History Method
Model M5, M6, M7 and M8 are analysed using response spectrum method. M5 and M6 are models without shear wall and M7 and M8 are models with shear wall. Models M5 and M7 are analysed as per IS 1893-2002(1) and M6 and M8 are analysed as per IS 1893-2016(1).
The storey displacement and storey drift ratio are compared in three cases, case1 models without shear wall, case2 models with shear wall and case3 models with and without shear wall for models analysed as per IS 1893-2016.
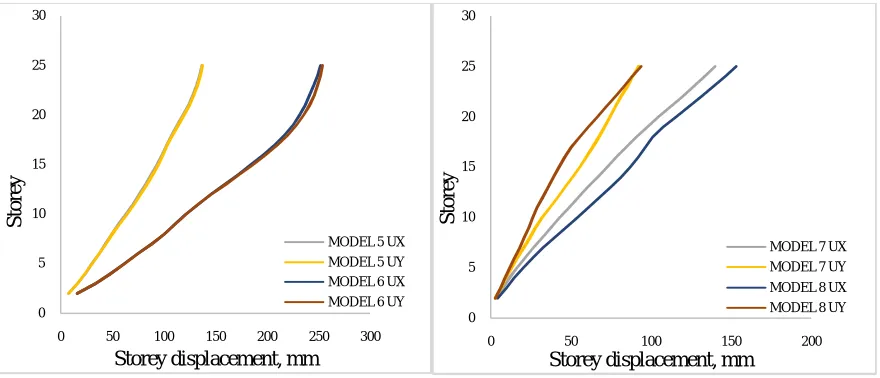
5.2.1 Storey Displacement
(a) (b)
0 5 10 15 20 25 30
0 0.002 0.004 0.006
S
to
re
y
Storey drift ratio
MODEL 2 DRIFTX MODEL 2 DRIFTY MODEL 4 DRIFTX MODEL 4 DRIFTY
0 5 10 15 20 25 30
0 50 100 150 200 250 300
S
to
re
y
Storey displacement, mm
MODEL 5 UX MODEL 5 UY MODEL 6 UX MODEL 6 UY
0 5 10 15 20 25 30
0 50 100 150 200
S
to
re
y
Storey displacement, mm
(c)
Fig. 4. Storey displacements (a) Model M5 and M6 (b) Model M7 and M8 (c) Model M6 and M8
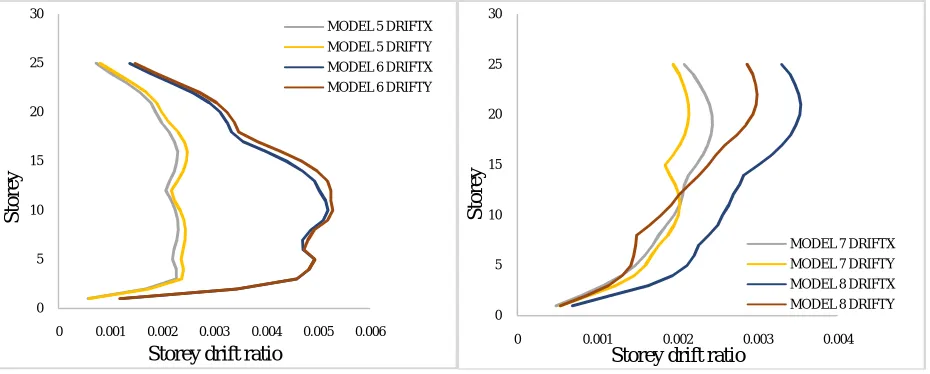
5.2.2 Storey drift ratio
(a) (b)
0 5 10 15 20 25 30
0 50 100 150 200 250 300
S
to
re
y
Storey displacement, mm
MODEL 6 UX MODEL 6 UY MODEL 8 UX MODEL 8 UY
0 5 10 15 20 25 30
0 0.001 0.002 0.003 0.004 0.005 0.006
S
to
re
y
Storey drift ratio
MODEL 5 DRIFTX MODEL 5 DRIFTY MODEL 6 DRIFTX MODEL 6 DRIFTY
0 5 10 15 20 25 30
0 0.001 0.002 0.003 0.004
S
to
re
y
Storey drift ratio
(c)
Fig. 5. Storey drift ratio (a) Model M5 and M6 (b) Model M7 and M8 (c) Model M6 and M8
The inclusion of shear wall to the structure decreases storey displacement and storey drift ratio. The storey displacement and storey drift ratio of the structure can be decreased and brought within the limits by adding shear wall to the structure.
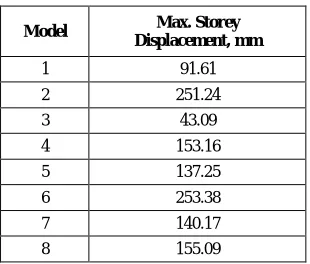
Table 1. Maximum storey displacement
Model Max. Storey Displacement, mm
1 91.61
2 251.24
3 43.09
4 153.16
5 137.25
6 253.38
7 140.17
8 155.09
Table 2. Maximum storey drift ratio
Model Max. Storey Drift Ratio
1 0.0019
2 0.005
3 0.0007
4 0.0028
5 0.0025
6 0.0053
7 0.0024
8 0.0035
0 5 10 15 20 25 30
0 0.001 0.002 0.003 0.004 0.005 0.006
S
to
re
y
Storey drift ratio
5.3 Time Period
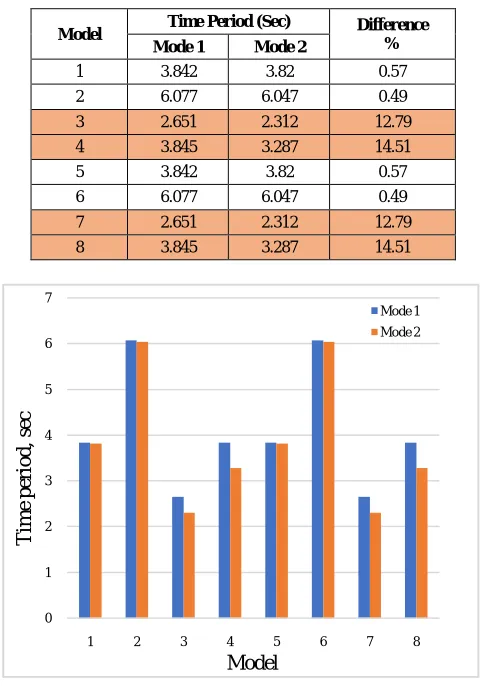
The time period values obtained from analysis as per IS 1893-2016 give higher values than the models analysed as per IS 1893-2002. The values of time period decrease with the inclusion of shear wall to the structure. The inclusion of shear wall increases stiffness and decreases flexibility due to which the time period decreases. The difference in the natural time period is less than 10% for models without shear wall, but as per the code IS1893-2016 and IS 16700-2017 it should be higher than 10% to avoid irregular modes of oscillation in 2-principal plan direction (vertical irregularity), by providing shear walls to the structure this can be controlled. It can be seen that the models with shear wall have the difference greater than 10%.
Table 3. Time period
Model Time Period (Sec) Difference % Mode 1 Mode 2
1 3.842 3.82 0.57
2 6.077 6.047 0.49
3 2.651 2.312 12.79
4 3.845 3.287 14.51
5 3.842 3.82 0.57
6 6.077 6.047 0.49
7 2.651 2.312 12.79
8 3.845 3.287 14.51
Fig. 6. Time period
5.4 Modal Mass Participation Ratio
The modal mass participation ratio for the models are obtained. The modes are decided in such a way that the sum of the modal mass participation ratio of all the modes should be greater than 90%. In these models it is attained at 12th mode. As per the code IS 1893-2016 and IS 16700-2017 the sum of first three modes should be greater than 65% and the sum of all the modes should be greater than 90%. All the models satisfy this for 12 modes. If the conditions are not
0 1 2 3 4 5 6 7
1 2 3 4 5 6 7 8
T
im
e
pe
ri
o
d,
s
ec
Model
satisfied then the modes should be increased until the conditions are satisfied. The modal mass participation for all the models are tabulated in table below.
Table 4. Modal mass participation ratio
Model
Modal Mass Participation Ratio Mode 3 Mode12 Sum ux Sum uy Sum ux Sum uy
1 82.07% 82.07% 96.15% 96.14%
2 81.02% 81% 97.63% 97.62%
3 73.11% 72.07% 97.12% 96.01%
4 70.73% 70.26% 97.75% 97.49%
5 82.07% 82.07% 96.15% 96.14%
6 81.02% 81% 97.63% 97.62%
7 73.11% 72.07% 97.12% 96.01%
8 70.73% 70.26% 97.75% 97.49%
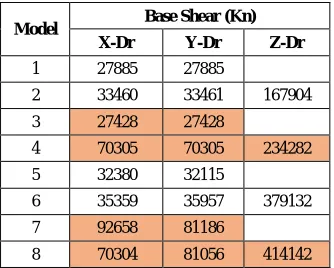
5.5 Base Shear
The base shear of the structure is the total design lateral force acting at the base of the structure. The base shear of all 8 models is tabulated in the table below. The models with shear wall are marked with red. The models analysed as per IS 1893-2016 have higher values of base shear than models analysed as per IS 1893-2002. When the models with and without shear wall analysed as per IS 1893-2016 are compared, the models with shear wall have higher values of base shear compared to models without shear wall. The base shear for vertical earthquake is computed to the models as per IS 1893-2016. According to this the 2/3rd of the lateral load acting on structure due to earthquake is considered as vertical load due to earthquake and analysed. The base shear obtained due to vertical earthquake are too less than the gravity loads and hence are ignored in design.
Table 5. Base shear
Model Base Shear (Kn) X-Dr Y-Dr Z-Dr
1 27885 27885
2 33460 33461 167904
3 27428 27428
4 70305 70305 234282
5 32380 32115
6 35359 35957 379132
7 92658 81186
Fig. 7. Base shear
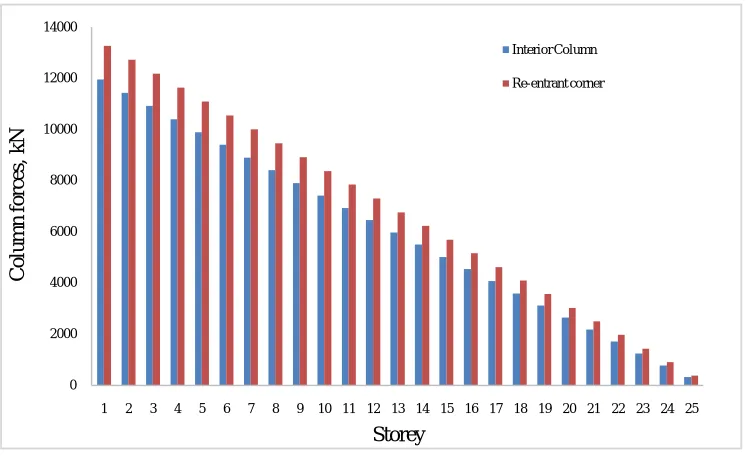
5.6 Column Forces
The column forces for an interior column and column at re-entrant corner are compared and plotted in figure below. An average for H shape model is taken and compared. The column force at the re-entrant corner is higher than the interior column.
Fig. 8. Column forces
0 10000 20000 30000 40000 50000 60000 70000 80000 90000 100000
1 2 3 4 5 6 7 8
B
a
se
s
h
ea
r,
kN
Model
X-Dr Y-Dr
0 2000 4000 6000 8000 10000 12000 14000
1 2 3 4 5 6 7 8 9 10 11 12 13 14 15 16 17 18 19 20 21 22 23 24 25
Co
lum
n
f
o
rc
es
,
kN
Storey
Interior Column
VI. CONCLUSIONS
i. The models analysed as per the codal provisions in IS 1893-2016 have higher values of storey displacement than the models analysed as per IS 2002, this is due to the higher factor of safety considered in IS 1893-2016.
ii. The inclusion of shear wall to the structure decreases displacement. On an average the decrease in displacement for models with shear wall compared to models without shear wall is 36%.
iii. The models without shear wall analysed as per the codal provisions in IS 1893-2016 have higher values of storey drift ratio than the models analysed as per IS 1893-2002 and exceed the permissible limit, this is due to the higher factor of safety considered in IS 1893-2016.
iv. The models with shear wall analysed as per the codal provisions in IS 1893-2016 have higher values of storey drift ratio than the models analysed as per IS 1893-2002, but are within the permissible limits, this is due to the higher factor of safety considered in IS 1893-2016.
v. The storey drift ratio for models without shear wall is higher than the models with shear wall and also exceed the permissible value. Hence, it can be concluded that the inclusion of shear wall to the models decreases storey drift ratio of the structure.
vi. The time period values obtained from analysis as per IS 1893-2016 give higher values than the models analysed as per IS 1893-2002 hence, the values of time period decrease with the inclusion of shear wall to the structure. The inclusion of shear wall increases stiffness and decreases flexibility due to which the time period decreases. The difference in the natural time period is less than 10% for models without shear wall, but as per the code IS1893-2016 and IS 16700-2017 it should be higher than 10% to avoid irregular modes of oscillation in 2-principal plan direction (vertical irregularity), by providing shear walls to the structure this can be controlled. It can be seen that the models with shear wall have the difference greater than 10%.
vii. The modal mass participation ratio of the models is according to the provisions in IS 1893-2016 and IS 16700-2017 when the modes are 12 for the analysis.
viii. The storey stiffness of the models increases with the inclusion of shear wall. The models analysed as per IS 1893-2002 have higher values of storey stiffness than the models analysed as per IS 1893-2016.
ix. The models analysed as per IS 1893-2016 have higher values of base shear than models analysed as per IS 1893-2002. When the models with and without shear wall analysed as per IS 1893-2016 are compared, the models with shear wall have higher values of base shear compared to models without shear wall.
x. The base shear for vertical earthquake is computed to the models as per IS 1893-2016. According to this the 2/3rd of the lateral load acting on structure due to earthquake is considered as vertical load due to earthquake and analysed. The base shear obtained due to vertical earthquake are too less than the gravity loads and hence are ignored in design.
xi. For models analysed as per the codal provisions in IS 1893-2002, the time history method gives higher values of storey displacement and storey drift ratio when compared with response spectrum method models. But for models analysed as per the IS 1893-2016 there is no much variation in the storey displacement and storey drift values.
xii. Time period, modal mass participation ratio and storey stiffness for the models analysed by both the methods (response spectrum method and time history method) gave the same values
xiii. The column force at the re-entrant corner is higher than the interior column.
ACKNOWLEDGEMENT
REFERENCES
[1] Bagheri B, E. S. Firoozabad and M. Yahyaei, “Comparative Study of the Static and Dynamic Analysis of Multi-storied Irregular Building”, International Journal of Civil and Environmental Engineering, Vol 6, No. 11, 2012, pp 1045-1049.
[2] Wakchaure M. R, A. Shirish, R. Nikam, “Study of Plan Irregularities on High-Rise Structures”, International Journal of Innovative Research and Development, Vol. 1, Issue 8, Oct-2012, pp 269-281.
[3] Rama Raju K, M. I. Shereef, N. R. Iyer, S. Gopalakrishnan, “Analysis and Design of RC Tall Building Subjected to Wind and Earthquake Loads”, The Eighth Asia-Pacific Conference on Wind Engineering, Dec-2013, pp 844-852.
[4] Guleria A. “Structural Analysis of a Multi-storeyed Building using ETABS for Different Plan Configurations”, International Journal of Engineering Research & Technology, Vol. 3, Issue 5, May-2014, pp 1481-1485.
[5] Prajapati P. B. and G. Vanza, “Influence of Plan Irregularity on Seismic Response of Buildings”, International Journal of Engineering Research and Applications, Vol. 4, Issue 6, June-2014, pp 85-89.
[6] Bele K. R. and S. B. Borghate, “Dynamic Analysis of Building with Plan Irregularities” Journal of Civil Engineering and Environmental Technology, Vol. 2, Issue 11, June-2015, pp 23-30.
[7] Manilal M. and S. V. Rajeeva, “Dynamic Analysis of RC Regular and Irregular Structures Using Time History Method”, International Journal of Research in Engineering and Technology, Vol 6, Issue 6, June-2017, pp 99-103.
[8] Bhattarai B. P. and Anjana A, N. Bhattarai, S. Mohare, “Analytical Study on Horizontal Irregularities in Building under Seismic Load with and without Shear Wall”, International Journal of Advances in Seintific Research and Engineering, Vol. 3, Issue 1, Aug-2017, pp 383-391. [9] Agarwal P. and M. Shirkhande, Earthquake Resistant Design of Structures, New Delhi, PHI learning private limited, Aug-2011. [10] Hosur V. Earthquake Resistant Design of Building Structures, New Delhi, Wiley India Pvt Ltd, 2013.
[11] Taranath B. S. Reinforced Concrete Design of Tall Building. Florida, CRC Press, Taylor and Francis Group, 2010.
[12] Smith B. S. and A. Coull, Tall Building Structures: Analysis and Design, A Wiley Interscience Publication, John Wiley & Sons Inc.
[13] IS 1893 (Part1): 2002, “Criteria for Earthquake Resistant Design of Structures”, Part 1 General Provisions and Buildings, Fifth Edition, Bureau of Indian Standards.
[14] IS 1893 (Part1): 2016, “Criteria for Earthquake Resistant Design of Structures”, Part 1 General Provisions and Buildings, Sixth Edition, Bureau of Indian Standards.