HIGHLIGHTED ARTICLE | INVESTIGATION
Stochasticity in the Genotype-Phenotype Map:
Implications for the Robustness and Persistence
of Bet-Hedging
Daniel Nichol,*,†,1Mark Robertson-Tessi,†Peter Jeavons,* and Alexander R.A. Anderson†,1 *Department of Computer Science, University of Oxford, OX1 3QD, United Kingdom, and†Department of Integrated Mathematical Oncology, H. Lee Moffitt Cancer Center and Research Institute, Tampa, Florida 33612
ABSTRACTNongenetic variation in phenotypes, or bet-hedging, has been observed as a driver of drug resistance in both bacterial infections and cancers. Here, we study how bet-hedging emerges in genotype–phenotype (GP) mapping through a simple interaction model: a molecular switch. We use simple chemical reaction networks to implement stochastic switches that map gene products to phenotypes, and investigate the impact of structurally distinct mappings on the evolution of phenotypic heterogeneity. Bet-hedging naturally emerges within this model, and is robust to evolutionary loss through mutations to both the expression of individual genes, and to the network itself. This robustness explains an apparent paradox of bet-hedging—why does it persist in environments where natural selection necessarily acts to remove it? The structure of the underlying molecular mechanism, itself subject to selection, can slow the evolutionary loss of bet-hedging to ensure a survival mechanism against environmental catastrophes even when they are rare. Critically, these properties, taken together, have profound implications for the use of treatment-holidays to combat bet-hedging-driven resistant disease, as the efficacy of breaks from treatment will ultimately be determined by the structure of the GP mapping.
KEYWORDSevolution; bet-hedging; genotype–phenotype map; bacterial persistence; drug resistance
T
REATMENT resistance in many diseases is driven by the pre-existence of resistant phenotypes within the popula-tion. Why such phenotypes coexist (with sensitive pheno-types), and persist in environments never exposed to drug treatment, remains a significant unanswered question. Phe-notypic heterogeneity has been observed within isogenic populations of a number of organisms, and at many scales (Balázsiet al.2011), from the unicellular—bacteria (Veeninget al.2008), fungi (Levyet al.2012), or cancer cells (Gupta
et al. 2011)—through insects (Danforth 1999; Hopper
1999), plants (Childset al.2010), and even aspects of human development (Tonegawa 1983). Importantly, this intercellu-lar variation has been observed even in homogeneous and constant environments, suggesting that aspects of organis-mal phenotype may be stochastically determined.
In environments thatfluctuate unpredictably, this phenom-enon can serve as a survival mechanism by increasing the likelihood that at least some offspring are well-adapted to future environments. Thus, nongenetic, nonenvironmentally-driven variation in phenotypes has been termedbet-hedging, as a species diversifies the phenotypes within the population in order to “hedge its bets”against environmental change [see Seger (1987) for justification of this naming, and de Jonget al.(2011) for a discussion of what evolutionary phe-nomena can be considered bet-hedging]. Oscillatory environ-ments are common in a range of ecological settings, including
fluctuating climates, immune–pathogen interactions, or cy-clic hypoxia within tumors, and the range of phenotypic traits that are thought to display stochastic determination is just as broad.
Bet-hedging can offer a survival mechanism in the event of rare catastrophic environmental change. An important clinical
Copyright © 2016 Nicholet al. doi: 10.1534/genetics.116.193474
Manuscript received July 6, 2016; accepted for publication October 6, 2016; published Early Online October 20, 2016.
Available freely online through the author-supported open access option.
This is an open-access article distributed under the terms of the Creative Commons Attribution 4.0 International License (http://creativecommons.org/licenses/by/4.0/), which permits unrestricted use, distribution, and reproduction in any medium, provided the original work is properly cited.
Supplemental material is available online athttp://www.genetics.org/cgi/content/ full/genetics.116.193474/DC1.
example is that of persister cells that arise stochastically within isogenic populations of infectious bacteria such as
Escherichia coli(Balabanet al.2004; Lewis 2006; Veening
et al.2008). These cells, which constitute a small fraction of the population [,1%;Lewis (2006)], have reduced metab-olism, and shut down nonessential cellular functions. In this dormant state, the persister cells are tolerant to the cyto-toxic effects of a number of antibiotic agents. Although dormant, these cells can retain the ability to proliferate (al-though at a drastically reduced rate), and, when antibiotic treatment ceases, persisters will proliferate, producing non-persisters and driving the re-emergence of the bacterial population. Hence, bet-hedging, by creating a small subpop-ulation impervious to those therapies that act on proliferat-ing cells, proves to be an effective survival mechanism against antibiotic treatment. Indeed, bacterial persisters are thought to be a contributing factor to multidrug resis-tance in a number of diseases (Keren et al. 2004; Lewis 2006; Nikaido 2009), and are implicated in the dormancy of chronic diseases, such as tuberculosis, which can be sup-pressed but not eradicated (Zhanget al.2012). Novel treat-ment strategies capable of effectively killing persister cells are desperately needed, and this need will continue to grow with the increasing incidence of resistance to our presently most effective antibiotics.
In cancer, bet-hedging has been minimally studied; how-ever, a number of aspects of disease course suggest that bet-hedging mechanisms may be important for understanding how tumors evade therapy. Significant regression of tumors post-therapy leads to a period of remission, followed by the regrowth of aggressive, therapy-resistant lesions. These dynamics can be explained by the clonal model of cancer (Greaves and Maley 2012), wherein recurring drug-resistant cells are those that have stochastically acquired resistance mechanisms through genetic mutation. However, the high frequency of tumor recurrence in many cancers suggests that therapeutic escape cannot be based solely on muta-tional“luck.”Experimental results have shown evidence of transitory resistance (Kurataet al.2004; Yanoet al.2005) indicative of the existence of a small drug-resistant sub-population that re-establishes a drug-sensitive cancer cell population. Recent experiments have identified the exis-tence of such populations of “cancer persister cells”in a cell line of EGFR+ nonsmall cell lung cancer (Sharma
et al. 2010), indicating that bet-hedging may play a role in the emergence of cancer drug resistance (Ramirezet al.
2016). Thus, an understanding of bet-hedging in normal and abnormal (e.g., cancer) cell function may help us un-derstand why certain types of therapies fail while others succeed.
Müller et al.(2013), as well as others (Thattai and Van Oudenaarden 2004; Kussell and Leibler 2005; Wolf et al.
2005), have demonstrated mathematically the selective advantage of bet-hedging strategies in stochastically fl uctu-ating environments. Showing thatfitness is maximized when the probability of individuals taking certain phenotypes
matches the likelihood of the environment selecting for that phenotype, provided that fluctuations are not sufficiently slow that adaptation through genetic mutation can occur, or so fast that no individuals of any phenotype can survive and reproduce. Further theoretical work by Botero et al.
(2015) considers when bet-hedging can offer a greaterfitness advantage than phenotypic plasticity, where phenotypes are modulated via the environmental variation (Via and Lande 1985). This previous work derives constraints on the cost of sensing, predictability of environmental fluctuations, and the fitness effects of environmental change to determine when bet-hedging, plasticity, or determinism offers a selec-tive advantage.
It has been suggested that drug-insensitive cells that arise stochastically in an isogenic population can facilitate the emergence of genetically driven resistance by providing a window of opportunity in which resistance conferring mu-tations can arise Brocket al.(2009). However, this window is not indefinite as drug-insensitive cells will revert to a sensitive state, and likely die in the presence of a drug. Charleboiset al.(2011) explored this phenomenon through a mathematical model that incorporates switching from a drug-insensitive to a drug-sensitive phenotype as the sto-chastic relaxation from a state of high to low gene expres-sion. This latter study demonstrated that the timescale of relaxation necessary to facilitate a high likelihood of genetic resistance is comparable to timescales measured for certain genes implicated in human cancers. In further work, Charleboiset al.(2014) introduced a model of a feed-forward transcriptional regulatory network to demonstrate that the network architecture can extend the time that drug-insensitive cells maintain their phenotype, and, thus, can increase the likelihood of therapeutic escape occurring through genetically driven mechanisms. This work high-lights that, to understand bet-hedging-driven drug resis-tance, it may be necessary to look beyond the genetic scale, and toward the gene–gene interactions that comprise genotype–phenotype (GP) mapping.
The mathematical results of Müller et al. (2013) and others (Thattai and Van Oudenaarden 2004; Kussell and Leibler 2005; Wolf et al. 2005) suggest a paradox when compared to clinical observations of bet-hedging, for exam-ple, bacterial persistence, as a survival mechanism against rare catastrophic events. Specifically, in hospitable environ-ments, bacterial persisters reproduce more slowly than cells with a proliferative phenotype, reducing population
The causes of bet-hedging
A number of causes of bet-hedging have been identified across different species, but in many cases the cause remains an open question. The difficulty in identifying the precise drivers lies in distinguishing between the variability (ornoise) introduced at different biological scales. For example, gene promoter, tran-scription, and translation dynamics are driven by inherently stochastic molecular interactions that result in the expression of gene products that vary both temporally and between isogenic individuals (Elowitzet al.2002; Kaernet al.2005; Blakeet al.2006; Raj and van Oudenaarden 2008). These gene products interact in nonlinear, molecular networks, of-ten forming feedback loops that have the poof-tential to sup-press (Becskei and Serrano 2000), or amplify, noise (Hasty
et al.2000), or induce oscillations in the concentrations of molecules (Cardelli and Csikász-Nagy 2012; Cardelli 2014). This intracellular system is further modulated by variability in environmental factors and intercellular signaling.
Current biological thought is that noise in the levels of specific intracellular proteins may drive nongenetic phenotype differentiation. Indeed, under certain regimes of promoter switching, transcription, and translation, protein abundance can follow a bimodal distribution (Kaernet al.2005), inducing two distinct phenotypes in a population. Further, theoretical modeling, coupled with experimental validation, has high-lighted how bistable autoregulatory genetic motifs can induce bimodal protein distributions (Hastyet al.2000; Becskeiet al.
2001; Isaacset al.2003).
The evolutionary origin of bet-hedging is unclear. It is not known whether bet-hedging emerged as an adaptation to unpredictable environments, or as a spandrel (Gould and Lewontin 1979), arising from the inherently stochastic na-ture of the biochemical reactions governing cellular behavior, and later co-opted as a survival mechanism. What is clear is that bet-hedging strategies, manifested as phenotypically heterogeneous populations, are subject to natural selection. Beaumontet al.(2009) demonstrated thede novoevolution of bet-hedging in the phenotypic trait of colony morphology of the bacterium Pseudomonasfluorescens by imposing sto-chasticallyfluctuating environments through replating. The genetic driver underpinning this switching behavior was par-tially elucidated by Gallie et al. (2015), who identified a single nucleotide change in the genecarBas responsible for the emergence of phenotype switching; however, identifying the precise molecular pathways through which this mutation acts to produce bet-hedging remains an open problem. Fol-lowing the recent development of persister isolation tech-niques, a number of genetic drivers thought to contribute to bacterial persistence in E. coli have been identified (Lewis 2006). However, while overexpression, or deletion, of these genes were shown to impact theproportionof bac-terial persisters within a population, none was found to completely inhibit the persister phenotype, suggesting that bet-hedging may arise from the interactions of multiple gene products.
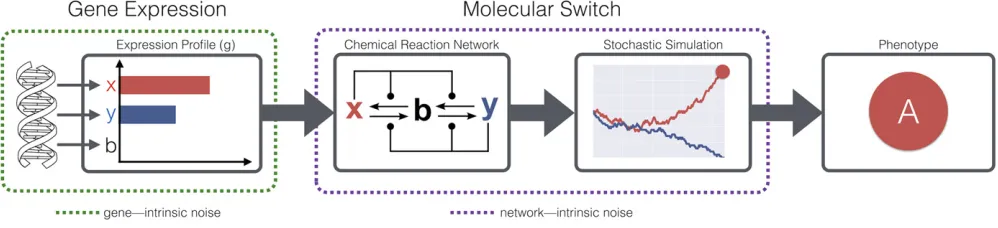
To address the difficulty in identifying genetic drivers of bet-hedging, we introduce a model GP mapping, wherein phenotypes emerge through the stochastic interactions of proteins in intracellular molecular pathways. Specifically, we simulate minimal interaction networks encoding bistable switches among two or three chemical species. The dynamics of these switches are implemented as chemical reaction networks (CRNs) simulated stochastically. Through this model we explore bet-hedging, which arises naturally, from the perspective ofnetwork intrinsic noise, as opposed to the
gene intrinsic perspective of previous modeling (Figure 1). Under this model, stable configurations of a reaction network are analogous to local minima in an epigenetic landscape [for example, as used by Huang (2009, 2012) to study phe-notypic heterogeneity in cancer].
There exist a number of regulatory motifs that induce bistable switching; however, the evolutionary implications of structural differences between these motifs have remained unexplored. Specifically, what properties of the molecular networks are likely to be selected for, and whether such properties can be exploited to identify potentially novel therapies, remain open questions. By considering simple, minimalistic models of bistable switches built from direct and indirect feedback mechanisms, we demonstrate that the structure of the networks governing phenotype differen-tiation can result in bet-hedging that is robust to major alterations. We argue that this robustness offers a potential explanation for the difficulty in identifying single genetic drivers of bet-hedging. Further, we demonstrate that network structure can alter the rate of evolutionary convergence to
fitness optima, reducing evolvability and preventing the loss of bet-hedging in fixed environments. This result suggests a solution to the apparent paradox of bet-hedging: how can it persist for long periods of time in environments where natural selection acts to remove it? Finally, we discuss the implications of this result for the design of treatments for diseases which display nongenetic phenotypic heterogeneity.
Materials and Methods
In this work we implement model GP mappings that stochas-tically determine one of two phenotypes,AorB, from a single genotype,g, encoding gene expression. The GP mapping can be considered to determine a genotype–dependent probability,
whereinpðgÞis determined fromgby a bistable CRN. Finally, we describe simulations of long-term evolution and drug ther-apy that form the basis of our results.
Population dynamics
Assume afixed GP map that determines a probability,p, of an individual with genotypeghaving phenotypeAat birth. This phenotype isfixed throughout the life of the individual. As we wish to study evolutionary loss of bet-hedging, we may as-sumep2 ð0;1Þ;as whenp¼1 we will end our simulations. We also assume afixed environment. A discrete time model is used to simulate the population dynamics as follows. Denote byxðtÞ ¼ ½xAðtÞ;xBðtÞ⊺the number of individuals of pheno-typeAandBat discrete timestept. We assume Wright-Fisher sampling, wherein each individual in the population at timet
can contribute any number of individuals to the population at time tþ1: Denote by wA (respectively, wB) the expected number of individuals in the population at time tþ1 that are descended from a single individual of phenotypeA (re-spectively, B) present in the population at t. We assume
wA;wB.0: Each new offspring takes phenotype A with probabilityp(andBwith probability 12p), wherepis de-termined by the genotype,g, and the GP mapping.
For afixed population size, the dynamics of the population can be modeled using mathematics from the theory of quasispecies that describe a population in mutation–selection balance (Wilke 2005). Specifically, if the average number of individuals at timetþ1 produced by a single individual at timetis given byhwi, the population dynamics are governed by the projection matrix,
P¼ 1 hwi
wAp wBp wAð12pÞ wBð12pÞ
: (1)
The population distribution after one discrete time step is given byxðtþ1Þ ¼PxðtÞ:Asp2 ð0;1Þ, the matrixPis pos-itive, and the Perron-Frobenius theorem (Cushing 1998; Li and Schneider 2002) tells us that the normalized eigenvector corresponding to the dominant eigenvalue of P gives the long-term stationary distribution of the two phenotypes A
andB. As we have only two phenotypes, we can easily de-termine this dominant eigenvalue as
0¼ jP2Ilj ¼ wAp hwi2l
wBp hwi wAð12pÞ
hwi
wBð12pÞ hwi 2l
¼
wAp hwi2l
wBð12pÞ hwi 2l
2wAwBpð12pÞ hwi2 ¼l
l2wAp hwi2
wBð12pÞ hwi
:
Thus,l¼ 1
hwi½pwAþ ð12pÞwBIt is easy to verify then that x*¼ ðp;12pÞis the normalized eigenvector corresponding to this eigenvalue as
P
p
12p
¼ 1 hwi
"
p2w
Aþpð12pÞwB
pð12pÞwAþ ð12pÞ2wB
#
(2)
¼ 1
hwi½pwAþ ð12pÞwB
p
12p
(3)
¼l
p
12p
(4)
Note that this is also the distribution of phenotypes in the case where the population grows without bound (when the factor of 1=hwiis omitted). From this stationary distribution, we can derive hwi ¼pwAþ ð12pÞwB: This phenotype equilibrium will be used in the next section to determine the invasion probability of a different (i.e., mutant) bet-hedging popula-tion into an existing one.
In reality, the valueswAandwBare dependent on a number of stochastic processes, most importantly reproduction and death. Later, we will consider the effect of an increased death rate associated with drug treatment, so it is informative to consider the relationship between parameters governing the explicit processes of birth and death, and the offspring num-berswAandwB:Suppose individuals of typeA(respectively,
B) die with probabilitydA (respectively,dB) over each time step. Further, suppose that individuals of phenotype A
(respectively, B) that survive reproduce with probability fA (respectively,fB) over the timestep. In this case
wi¼ ð12diÞð1þfiÞ for i2 fA;Bg: (5)
Note that multiple pairs of values forfianddican yield the same
wi:The population dynamics we present here, and the invasion dynamics presented below, are identical for all such pairs.
Invasion dynamics
Our aim is to determine the long-term evolutionary dynamics of bet-hedging populations endowed with differing GP–maps. It is intractable to determine these trajectories through ex-plicit simulation alone. Instead we derive an analytic solution for the probability of a mutant genotype invading an existing isogenic population. Consider a largefixed-size population, and assume that mutation is sufficiently rare (explicitly that the mutation rate m and population size N satisfy
NmlogN1) that we may consider strong-selection weak mutation (SSWM) evolutionary dynamics (Gillespie 1983, 1984). Under these assumptions, we can assume that the population is isogenic, and that each time a new mutant appears in the population it eitherfixes as the new population genotype or becomes extinct before another can arise.
Suppose a single mutant of genotypeg9arises in an iso-genic population of genotypegand denote bypðg9Þ, the prob-ability that this mutant reaches fixation as the population genotype. This probability is dependent on the phenotype of this initial mutant, and is given by
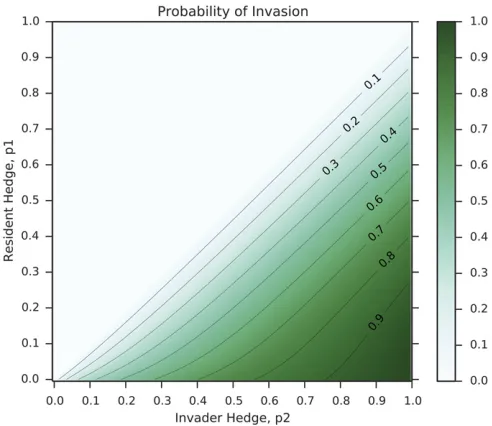
pg9¼pg9pg9Aþh12pg9ipg9B: (6) Denotep¼ ½pðg9AÞ;pðg9BÞ, and suppose that the popula-tion size,N, is sufficiently large that we may approximate it by the limitN/N:As we assume Wright-Fisher sampling for reproduction, the value of p can be determined from the theory of branching processes. In particular,pcan be calcu-lated numerically as the solution to the equation
12p¼e2Pp (7) where P is the matrix governing the population dynamics defined above.
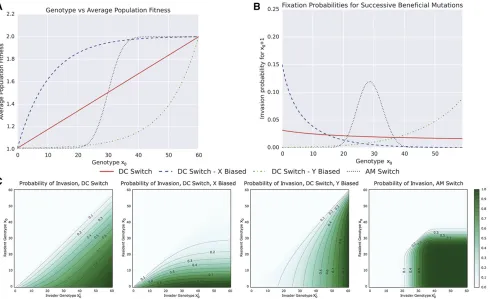
A proof of this identity, modified from the theory of viral quasispecies (Wilke 2003), is presented in Supplemental Material,File S1. As the value ofhwican be calculated from the population dynamics described above, this equation can solved numerically. Figure 2 shows an example heatmap of in-vasion probability for an invader with genotype corresponding to probabilityp2of phenotypeAinto a resident population with probabilityp1:The parameters arewA¼2:0 andwB¼1:01:
CRNs as a model GP map
To study the evolution of bet-hedging, we consider the genetic drivers of changes to the probability,p, of an individual having phenotypeA. We implement a model GP mapping in which phenotypes emerge with proportions that are determined from the interactions of expressed gene products. In this model, the genotype,g, is represented in an abstracted way,
as the numbers of chemical species, labeledxandy, that are present in the cell at birth. Thus,g¼ ðx0;y0Þ 2ℕ2:
The model relies on the stochastic resolution of a CRN through the Gillespie algorithm (Gillespie 1977, 2001) to determine a phenotype from the genotype g. CRNs are
de-fined by a collection of labeled chemical species and a list of reactions, with associated rates, between these species. The Gillespie algorithm determines a stochastic progression of reactions within a CRN, and returns the sequence of reactions that occur, along with the times at which they occur. We consider the class of CRNs that encode bistable switches (Cardelli and Csikász-Nagy 2012), wherein the sequence of reactions will almost surely (in the probabilistic sense) ter-minate in one of two stable configurations (see Figure 3). These differentfinal configurations can be considered differ-ent states of a stochastic switch, and to represdiffer-ent the confi g-urations that ultimately result in different phenotypes,Aand
B. The probability that the CRN progresses to a specific switch state is dependent on the initial conditions for the network. Thus, we can define a model GP mapping according to
g/GP A; if the simulation progresses to stable state 1 B; if the simulation progresses to stable state 2:
(8)
context of bacteria, the developmental perspective is less ap-propriate, and the model can be justified by considering gene expression bursts that are cell-cycle dependent (specifically, bursts that occur at the start of the G1 phase).
Note that the genotypeg corresponding to a stable gene expression profile is the sole heritable determinant of pheno-type in this model. The state of the molecular switch,i.e., the phenotype, of a parent individual has no influence on the phenotype of the offspring. This assumption can be justified as follows. The bistable switches we discuss may represent only a small subnetwork of the complex and dynamic interac-tion network governing the GP mapping. Thus, we can expect the chemical species comprising the molecular switch,xandy, to be further transformed, or consumed, in additional unmod-elled reactions that determine phenotype. Further, even when this is not the case, we can expect the xandymolecules to
decay over time. Thus, the omission of epigenetic inheritance of switch state can be considered an assumption that the time scale of molecular decay is much faster than that of cellular division. Weakening this assumption, and permitting epige-netic inheritance, represents a potential extension of the model that is briefly explored in ourDiscussion.
Finally, we assume that the series of chemical reactions that result in a stable configuration for the network all occur within a sufficiently short time period (in comparison to the cell cycle) that we may take them to have all occurred instanta-neously. This assumption permits us to ignore the timing information provided by the Gillespie algorithm. As such, the abscissas of allfigures showing stochastic simulations of CRNs presented in this work measure time discretely, in terms of the number of reactions that have occurred, instead of continuously. The time between successive reactions in the Figure 3 Example molecular switches as GP maps. Each column shows the characteristics of one of the four switches (DC, DCx, DCy, and AM) introduced in the main text. Thefirst row shows the name, CRN structure, and precise definition of each switch. The second row shows stochastic trajectories of the number of molecule xin the system for four different simulations of each switch. The starting condition in all simulations is
Gillespie algorithm is dependent on a propensity function that accounts for reaction rates and the volume of the container (i.e., cell cytoplasm). As we are only interested in the proba-bility offinding each stable configuration, and not the precise time taken to reach this configuration, we may set the volume to be an arbitrary constant, say 1.0 mm3, and also normalize the reaction rates such that at least one reaction has rate 1:0 sec21:
Four model bistable switches that can serve as model GP maps are shown in Figure 3, along with examples of stochas-tic realizations of the switches (second row), and heatmaps showing p½ðx0;y0Þ ¼ℙ½g/GPA for x0;y02 f0;. . .;60g (third row). The value ofp½ðx0;y0Þis required to determine the population and invasion dynamics as described above. Estimating this value numerically through multiple samples of the Gillespie algorithm is prohibitively slow. Instead, the value can be determined analytically for the DC, DCx, and DCy switches as they correspond to the classical“drunkard’s walk”of probability theory. For the AM switch, no such ana-lytic solution is possible. To determinep½ðx0;y0Þin this case, we construct the Markov chain on the space of possible
con-figurations ofðx;y;bÞand numerically solve forp½ðx0;y0ÞThe details are provided inFile S1.
Simulating evolutionary loss of bet-hedging
To investigate the impact of GP mapping on the evolutionary loss of bet-hedging, we implement a stochastic simulation of mutation and selection. We consider mutations to a genotype
g¼ ðx0;y0Þ as changes to the initial abundancesx0 andy0: The possible mutations are thus modeled by
m½ðx0;y0Þ ¼ fðx061;y061Þj provided x0þy0¼gmaxg: (9)
Note that we have restricted mutations such that total ex-pression is conserved, and the genotype is determined entirely by the value x0ðy0¼gmax2x0Þ: For the remainder of this work, we omit reference toy0, and equategwithx0:Owing to the computational complexity of our simulations, we take
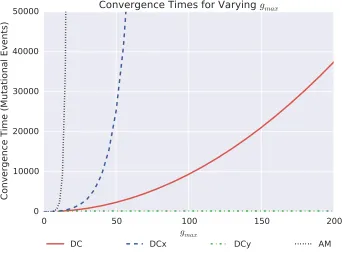
gmax¼60:Changes to the value ofgmax do not change the qualitative results, but will change them quantitatively as the time of evolutionary convergence to a nonhedging strategy increases asgmaxis increased (seeFile S1).
The mutations defined by Equation 9 differ from previous network models of the GP mapping; for example, the models of Huang (2009) or Gerlee and Anderson (2009), as they modify the initial conditions of a network-defined dynamical system, as opposed to the system itself. This choice of muta-tion is appropriate to the level at which genotypes are mod-eled. For example, the phenotypes of the gene regulatory network model studied by Huang (2009) are stable gene expression profiles. By contrast, in our model, expression profiles are taken as the genotypes, the initial expression levels ofxandy. This notion of genotype is chosen to allow us to investigate the impact of network-intrinsic noise on the evolution of bet-hedging (see Figure 1).
As discussed above, we assume a large asexually reproduc-ing bet-hedgreproduc-ing population exists under SSWM dynamics (Gillespie 1983). Our evolutionary simulation proceeds by repeatedly generating a mutant of the population genotype
gaccording to Equation 9, computing the probabilitypthat this mutantfixes as the new population genotype according to Equation 7, and then stochastically deciding whether the mutation fixes [by sampling qUnifð0;1Þ and comparing the value to p]. The simulation terminates when the geno-type satisfiesx0¼gmax, and the total number of mutations that are sampled in the simulation (including those that do notfix) is returned as a proxy for the time until evolutionary loss of the bet-hedging. The initial population genotype,g0;is chosen such thatpðg0Þ 0:5:
Simulating treatment holidays
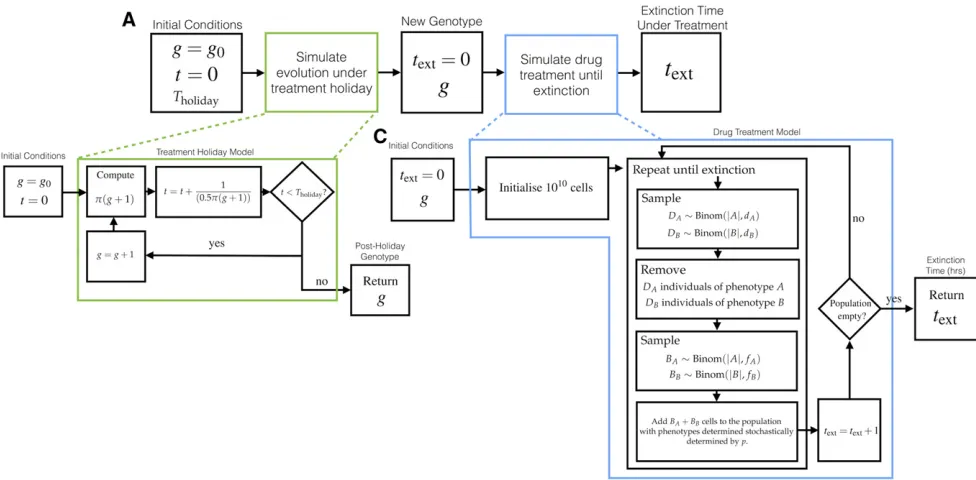
To explore the clinical impact of treatment holidays on treat-ing disease with bet-hedgtreat-ing driven resistance, we imple-mented a simulation comprising two parts. In the first, an evolutionary simulation similar to the one described above is performed to determine the population genotype following a treatment holiday. From an initial genotype g0 with
pðg0Þ 0:5, the expected population genotype gfollowing a treatment holiday of length T (measured in mutational events) is computed. The expected time, in mutational events, taken for the genotype gþ1 to arise by mutation andfix in the population is 1=½0:5pðgþ1Þ:Here, the factor of 0.5 arises as only half of mutations are beneficial (g/g21 is not). Using this fact, an expected postholiday genotype can be easily determined by repeatedly incrementing g, while keeping a sum of the expected number of mutational events required for that newgtofix in the population. This process is terminated when this number of events exceedsT.
Using this postholiday genotype, and the associated GP-map-dependent hedging probability pðgÞ; a stochastic death–birth process without mutation was performed to de-termine an approximate time to extinction. A population of size 1010was initialized with a proportionpðgÞof phenotype
Aand½12pðgÞof phenotypeB. The simulation proceeds as depicted in Figure 4, and is terminated when the population is extinct, or 20,000 simulated hr has elapsed. Each time step corresponds to 1 hr. Unlike the simulation of evolutionary timescales, the treatment simulation is dependent on the parameters of per-hour probability of death,ddrugi ;and repro-ductionfidrug;for individuals of each phenotype in the drug-treated environment. This environment is different to the hospitable environment taken for evolutionary simulation.
This simulation was performed 2000 times for each treat-ment holiday lengthT2(0, 3000, 5000, 50,000, and 100,000), and each molecular switch from Figure 3. The extinction times were collated to form the histograms shown in Figure 8.
Data availability
Results
We have implemented a model GP mapping in which pheno-types emerge with proportions that are determined from a genotype and molecular switch. It is infeasible to explicitly model the full array of chemical interactions comprising the translation from genes to phenotypes. However, investigation of smaller network motifs can provide insight into the prop-erties of the full molecular network. A similar approach was taken by Cardelli (2014), who studied emulation between CRNs, the phenomenon where one network is capable of reproducing the exact mass-action kinetics of another. Iden-tifying emulations provides a method to extend results gained from studying of simple CRN motifs to larger molec-ular pathways.
We consider four different bistable switches that can serve as model GP mappings. These switches are constructed from minimal interaction encoding direct and indirect feed-back among two or three chemical species, and represent the simplest possible implementations of bistable networks. The switches, along with examples of their dynamics, are pre-sented in Figure 3. TheDirect Competition(DC) switch (along with DCx, DCy) consists of a pair of autocatalytic reactions. The Approximate Majorityswitch, studied by Angluinet al.
(2008) and later Cardelli and Csikász-Nagy (2012), consists of two catalytic and two autocatalytic reactions. A biological implementation of the AM switch is presented by Doddet al.
(2007) as a potential mechanism for epigenetic cell memory. By picking appropriate genotypes (i.e., initial conditions for the molecular network), any switching probability, and,
equivalently, any ratio of phenotypesAandB, can be closely approximated using any of the switches (Figure 3, Row 3). It follows that bet-hedging can arise solely from network-intrinsic noise introduced by the stochastic interactions among as few as two chemical species. Here, we explore how the topology of simple stochastic networks influences the evolutionary fate of bet-hedging.
Robustness and redundancy in molecular switches
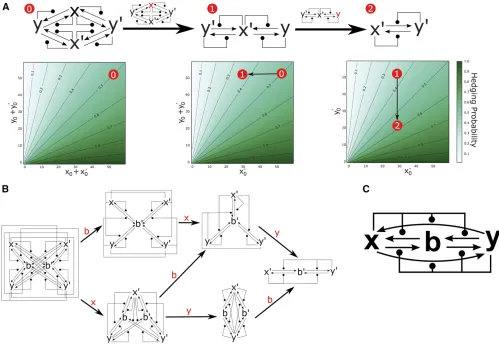
By introducing redundancy, we demonstrate how bet-hedging can be robust to major perturbations to the underlying net-work. Figure 5A shows a version of the DC switch from Figure 3 in which the speciesxandyare duplicated. In this network, which we call DCdup, the set of stable configurations are determined byxþx9¼0 oryþy9¼0:If we associate the phenotypes AandB with these two configurations, respec-tively, then the switching probability on initial conditions
ðx0;x90;y0;y90Þis identical to the switching probability of DC with initial conditionsðx0þx09;y0þy09Þ(a simple mathemat-ical argument to establish this proceeds by symmetry and relabeling the species). The potential benefit of DCdup is that it maintains its switching properties, even if chemical species are removed. Figure 5A shows numerical solutions for the CRN switching probability when the species x is deleted (middle network), and then when bothxandyare deleted (right hand network). These induced CRNs maintain switch-ing behavior similar to the original network DCdup. The net-work induced by deleting x (or by symmetry y) behaves precisely as DCdup with initial condition ðx0;0;y0;y90Þ [by
symmetryðx0;x90;0;y90Þ]. Further, removing bothxandyfrom DCdup creates a version of the DC switch in the speciesx9and
y9that behaves precisely as the DCdup switch on initial con-ditionsð0;x09;0;y09Þ:It follows that deletion of chemical spe-cies will change the likelihood of switching (and thus the proportion of phenotypes AandB) if initial numbers of all other proteins remainfixed. An example is shown by the red circles in Figure 5A, where deletion of chemical species shifts the switching probability, but does not inhibit bet-hedging entirely. Hence, the DCdup switch is robust to the removal of chemical species—a mutational event that, in our model, can be interpreted as deletion or downregulation of a gene. Reversing this argument, the switching behavior of the CRNs in Figure 5A demonstrate how bet-hedging is robust to gene duplications or upregulating mutations.
A similar redundant implementation of the AM molecular switch is shown in Figure 5B, and is robust to the removal of species,x,y, andbin any order. As with the DCdup network, the removal of any chemical species will change the switch-ing probability, and shift the proportions of phenotypes in the population, but will not inhibit one phenotype entirely.
Fur-ther, we note that the switching is not only robust to muta-tions that remove chemical species, but also to alteramuta-tions in the rates of reaction between them. For example, each of the switches presented in Figure 3 can be derived from the larger network shown in Figure 5C by inhibition of specific reac-tions. Removal of the autocatalytic reactions xþy/xþx
andxþy/yþyyields the AM switch. Alternatively, remov-ing the four reactions involvremov-ing the chemical speciesbyields the DC switch.
Evolutionary loss of bet–hedging
Forfixed gene expression, the specific switching mechanism responsible for producing multiple phenotypes is irrelevant, as the proportion of phenotypes remains fixed. However, over longer timescales, the structure of the molecular switch has a significant impact on the evolution of bet-hedging. Throughout the remainder of this work, we take the two phenotypesAandBto correspond to a highfitness, prolif-erative phenotype, and a lowfitness, slow proliferating phe-notype, respectively, mirroring the phenomenon of bacterial persistence.
The invasion probability is computed independently of the (assumed to be large) population size, and is dependent only on the (stable) distribution of phenotypes in the population at equilibrium. This distribution can be computed from the values
wAandwB:We parametrize the model determined as follows. The discrete timesteps are taken to bet¼60mins, mirroring an expected division time ofE. coli. The time from birth until reproduction for a phenotypeAindividual is distributed expo-nentially, with rate parameterlA¼1:0 per 60 min. The num-ber of reproductions of a single individual is then Poisson distributed with parameterlA¼1:0:Hence, on average, each phenotypeAindividual present at timetreproduces once in the 60 min, and produces two individuals at timetþ1 (itself and its offspring). It follows,wA¼2:0:The reproductive rate of persister-type cells is unknown. To match their behavior qualitatively, we take our persister-like phenotype B cells to have an expected reproduction time 100 times slower than phenotype A individuals, at 6000 min. Thus, reproduction time for phenotype B cells is distributed exponentially with rate parameterlb¼0:01 per 60 min. The expected number of reproductions over the 60 min timestep is then 0.01 and
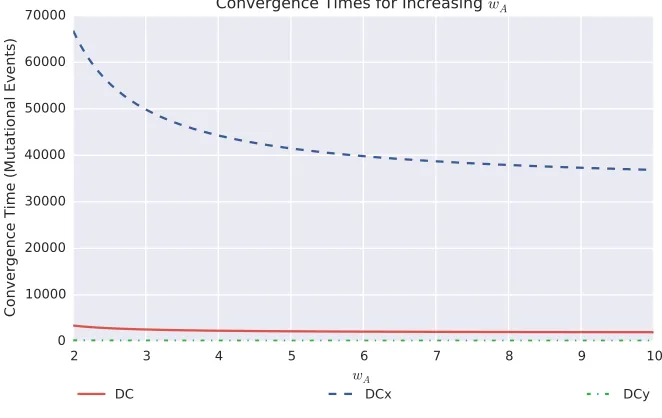
wB¼1:01: The environment remainsfixed (wA;wB are un-changed) throughout the evolutionary simulation. Although this parametrization is only an approximation, it is sufficient as an illustrative model demonstrating the importance of the structural properties of GP mapping. The effects of changing
wAandwBare discussed inFile S1.
Figure 6A shows how changes in the population genotype manifest themselves as changes in the average population
fitness. The expected populationfitness increase associated with a mutation fromx0tox0þ1 is not constant, and instead is dependent on the underlying molecular switch. As a result, invasion probabilities are dependent on both the population genotype, invading genotype, and the form of the molecular network. Figure 6C shows the probability of a single mutant genotype,x90, invading a resident population of genotypex0: Note that only mutations that increase the proportion of phe-notypeAare beneficial, and, hence, as our invasion probabil-ities are determined from the theory of branching processes, are the only mutations that can fix. Figure 6B shows the probability of successive beneficial mutations,x0þ1; invad-ing a resident population of genotypex0:In thisfigure, we see the impact of the GP map on the evolutionary dynamics. For the DC, DCx, and AM switches, the probability of the next beneficial mutationfixing reduces for each successive muta-tion. The magnitude of this decrease is dependent on the switch, and, in the case of DCx and AM, approaches zero. Conversely, for the DCy switch, each successive mutation is more likely tofix.
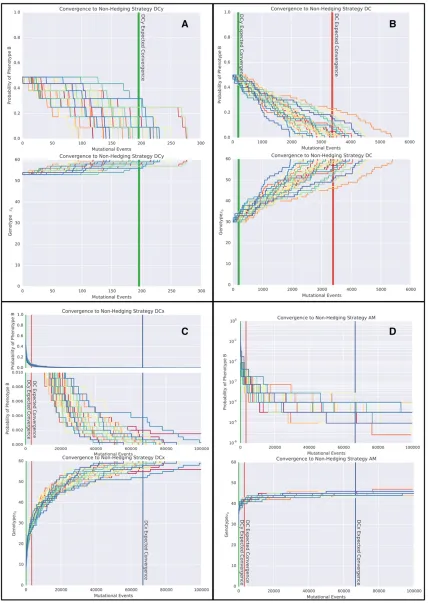
Consider the evolutionary trajectories of phenotype propor-tions determined by each of the molecular switches from an initial gene expression profile corresponding closely to a pop-ulation consisting of50% of each phenotype. As the DC and AM switches are symmetric, the genotype corresponding to a 0.5 hedging probability isx0¼30:For DCx, the closest geno-type to a 50% hedge isx0¼7, which corresponds to a
prob-ability of 0.49. For DCy, the closest genotype to a 0.5 hedging probability is x0¼53, and corresponds to a probability of 0.51. As deleterious and neutral mutations cannot fix under our model of population dynamics, the population genotype will be periodically incremented untilx0¼60, at which point the bet-hedge is lost. Figure 7 shows the evolutionary trajec-tories toward this loss of bet-hedging, highlighting consider-ably different convergence dynamics. For the DC, DCx, and DCy switches, the expected convergence times can be deter-mined as the expectation of a sum of nonidentical independent geometric distributions. Wefind that the expected number of mutational events required for a complete loss of bet-hedging, as highlighted in Figure 7, are given by
E½time to loss of bet-hedgejDCy switch;x0¼53 ¼195:8 E½time to loss of bet-hedgejDC switch;x0¼30 ¼3382:8 E½time to loss of bet-hedgejDCx switch;x0¼7 ¼68;000:1 E½time to loss of bet-hedgejAM switch;x0¼30 ¼N In the case of the AM network, each subsequent mutation provides a diminishing increase infitness until mutations are approximately neutral. The probability of neutral mutations
fixing within our model of invasion dynamics, which models the population size as tending to infinity, is zero. In reality, the actual convergence times in the AM will depend on the population size. For large populations, as is our assumption, the timescales will be sufficiently long that we take it as equivalent to the evolutionary trajectory never converging. (This assumption can be justified by the observation that over these time scales either unmodelled mutations [such as mu-tations to the GP map itself, to other genes governing the phenotypesAandB, or to other aspects of the phenotype], or unmodelled changes in the environment or ecosystem, will occur, rendering our model unsuited to the situation.)
Simulation of therapeutic intervention
To demonstrate the importance of the underlying molecular switch on the efficacy of treatment holidays for diseases with bet-hedging-driven resistance, we performed a two-part sim-ulation. First, a treatment holiday was simulated through an evolutionary simulation in a hospitable environment to de-termine a postholiday population genotype. A nonspatial, individual-based model was then used to simulate drug treatment. The parameter values used in the evolutionary simulation of treatment holidays were chosen to coincide with the values w¼ ½whospA ;w
hosp
B ¼ ½2:0;1:01used in our simulation of evolutionary loss of bet-hedging. For the sim-ulation of treatment, explicit values of fidrug and d
drug i (for
i2 fA;Bg) are required. First, we determined the values for the nondrug environment that correspond to those used in the evolutionary simulation. For the hospitable environ-ment, we assumed a fixed death probability for both As andBs ofdhospA ¼dhospB ¼0:005:The per-hour likelihood of reproduction for the surviving individuals was taken as
fAhosp¼1:0 andf hosp
h
whospA ;whospB
i
¼h12dhospA
1þfAhosp
;12dhospB
31þfBhosp
i
½2:0;1:01:
We consider three regimes of drug–environment parameter sets corresponding to a purely cytostatic drug, affecting only
fA;a purely cytotoxic drug, affecting onlydA, and a drug that is a mixture of the two, affecting bothfAanddAintermediately. In the following discussion the“drug”superscript is omitted for readability.
For each regime we assume that the parameters for phe-notypeB, mirroring a drug-impervious persister-like pheno-type, are unchanged. Consider a fixed drug parameter set. For each switching network, the expected postholiday population genotype, g, was calculated for each treatment holiday length T 2 (0, 3000, 5000, 50,000, 10,000) from initial genotypeg0 chosen, as before, to correspond closely to an equal proportion of each phenotype. From eachg, we then performed 2000 simulations of drug treatment to de-termine a distribution of extinction times. Where simulation time exceeded 20,000 hr, the simulation was halted and ex-tinction was determined to not occur. A standard course of antibiotic treatment lasts between 7 and 10 days. Using this period as a guide, we defined extinction times of,240 hr as corresponding to a potentially successful course of therapy, and thus, a viable treatment holiday strategy. The extinction
time histograms lying within this period are shaded green and marked by a * in the histograms. Mutations were not modeled during the simulations of therapy.
The cytostatic drug parameter set was taken to correspond to a substantial reduction in the proliferative rate of phenotype
A individuals. We note that extinction will almost surely never occur if
D
wdrug
E
¼pðgÞwdrugA þ ½12pðgÞwdrugB ¼pðgÞð12dAÞ
3ð1þfAÞ þ ½12pðgÞð12dBÞð1þfBÞ$1:
Asð12dBÞð1þfBÞ.1:0;it follows that a cytostatic drug can only drive extinction in this case ifð12dAÞð1þfAÞ,1:0:As
dA¼0:005;this occurs only iffA,0:99521210:005:For our simulation of cytostatic drug treatment, we assume that the drug is entirely effective at inhibiting reproduction,
fA¼0:For this parameter, wefind that extinction never oc-curs within the 240 hr time period, indicating that, regard-less of the underlying switching mechanism, no length of treatment holiday will result in complete cure with a cyto-static drug. The histograms of extinction times, where extinc-tion does occur, are presented in Figure 3 ofFile S1.
necessary for a successful (,240 hr) follow up course of therapy varies by orders of magnitude depending on the un-derlying switch. It follows that the efficacy of treatment hol-idays as a potential therapeutic intervention for a disease with bet-hedging-driven resistance is dependent on the un-derlying driver of bet-hedging.
To test the robustness of this result, we considered an intermediate parameter set of dA¼0:4 and fA¼0:5 as a trade-off between cytostasis and cytotoxicity. The histograms of extinction times in this simulation are presented in Figure 4 of File S1. We find that, although the specific extinction times change, the qualitative results remain the same. Spe-cifically, those combinations of treatment holiday, T, and switching mechanism that resulted in an effective follow-up treatment with a cytotoxic drug (Green, Figure 8) also permit effective treatment under this mixed parameter set. The con-verse is also true, with the blue (extinction but not within 240 hr) and gray (no extinction with 20,000 hr) histograms from Figure 8 being preserved.
Discussion
We have introduced a model for the GP map that uses minimal networks of stochastic interactions to determine phenotypes. Other models of nongenetic phenotypic heterogeneity have utilized deterministic interaction networks, for example, the models of Gerlee and Anderson (2007) or Huang (2009, 2012), or stochastic simulation of empirically derived molec-ular pathways, for example Charlebois et al. (2014). The model presented here differs as we investigate minimal sto-chastic instances of switching behavior. These networks, like those investigated by Gerlee and Anderson or Huang, are, at present, hypothetical. However, this work could be readily extended to empirically observed reaction networks in future work.
Remarkably simple network motifs have been demon-strated to implement switching behavior that can produce populations in which different proportions of cells, deter-mined by the initial conditions of the network, take on dif-ferent phenotypes. While abstract in its representation of reactions within a network, the reactions in our model are closely related to the physical mechanisms that govern in-tracellular regulatory networks, providing valuable insight into the impact of network architecture on the stochastic determination of phenotypes.
We have demonstrated how redundancy, a common fea-ture of many biological systems, can result in bet-hedging that is robust to the addition or removal of chemical species. This redundancy, which can arise initially through neutral or nearly-neutral mutations of network structure, can ensure that bet-hedging is not lost through gene deletions or dupli-cations. Critically, this observation may explain the failure to identify genes responsible for bacterial persistence. For ex-ample, Lewis (2006) highlights mutations to the geneshipA,
rmf, sulA, and toxin–antitoxin (TA) loci relBE, dinJ and
mazEFas possible drivers of bacterial persistence. However,
deletion of rmf,relBE ormazEF has been demonstrated to have no effect on the phenomenon of persistence, owing possibly to redundancy in TA modules, while deletion or over expression of hipA can change the proportion of bacterial persisters but not eradicate them. This is consistent with our results that indicate deletion of a single species in the CRN will not inhibit phenotypic heterogeneity but may alter phenotype proportions (Figure 5). The conclusion to be taken from the results reviewed by Lewis (2006) need not be that the factors identified are not the ones driving bacterial per-sistence, but instead it may be that the search for a single genetic factor responsible for bet-hedging is doomed to fail. It may be that bet-hedging emerges from the interactions of a collection of genetic factors in the sense of the epigenetic landscape studied by Brock et al. (2009) and Huang (2009). If this is the case, then to identify the biological mechanisms responsible for bet-hedging, we need to move beyond a gene-centric perspective, and to identify those net-works of interactions governing the determination of phenotypes.
Mutations in cancer have often been associated with their direct effect on phenotypes—the concept of a driver mutation being that it induces a novel adaptive phenotype leading to clonal expansion (McFarlandet al.2014). However, our re-sults suggest another phenomenon, wherein mutations do not induce novel phenotypes, but rather alter frequencies of pre-existing phenotypes within the population. This change in phenotypic ratio can have implications for cancer progres-sion—a phenomenon previously explored by Charleboiset al.
(2011). Consider the phenomenon of tumorigenic cells, where it is thought that only cells of a certain phenotype can form a growing tumor mass (Pardalet al.2003; Ricci-Vitiani et al.2007; Meacham and Morrison 2013). Genetic heterogeneity can explain the existence of a tumorigenic sub-population if certain driver mutations are responsible for the tumorigenic phenotype. However, an alternative mechanism is that stem-like tumor cells give rise to a population of het-erogeneous phenotypes. In the traditional stem cell model, a hierarchy exists where the stem cells produce a range of tu-mor cell phenotypes (Reya et al. 2001). Cancer stem cells divide to produce either more cancer stem cells (self-renewal) or cells with nonstem phenotypes down the hierarchy. This cellular decision is often taken to be stochastic (an example of bet-hedging), and our results highlight the potential for mutations to alter the probabilities of self-renewal or differ-entiation that have been shown to have significant impact on many aspects of tumor progression (Enderling et al.
2013).
the heterogeneity of marker expression was recapitulated by most tumorigenic cells, regardless of the starting pattern of expression. Such a mechanism would have different implica-tions from the stem cell model presented above, as poten-tially sensitive cells would be more difficult to define. However, our predictions remain the same: that genetic mu-tations could shift the frequency of tumorigenic phenotypes and profoundly impact cancer progression.
Our results further demonstrate that the structure of the network governing phenotypic differentiation also has impor-tant implications for the evolutionary loss of bet-hedging. By considering mutations to the expression levels of genes, we
find that the time taken for a two-phenotype bet-hedge to be lost, in an environment favorable to only one of the pheno-types, can vary by orders of magnitude depending on the network structure. If bet-hedging serves as a survival mech-anism in the event of rare catastrophic environmental change (e.g., drug treatment), then the GP mapping can prevent loss of this survival mechanism over the long timescales in which catastrophe does not occur. For example, if bet-hedging is driven by a network such as the AM network (Figure 3), then each successive mutation toward a one–phenotype strategy induces a diminishing increase in the probability of
generat-ing that phenotype, and, thus, a diminishgenerat-ing increase in expectedfitness. Eventually mutations become (essentially) neutral, and unable to fix in a large population. It is the structure of the molecular switch that substantially slows evolutionary convergence. This result provides a possible so-lution to the apparent paradox of bet-hedging,i.e., how can bet-hedging persist in environments where natural selection acts to remove it? The structure of the molecular mechanism, itself subject to natural selection, can slow the loss of bet-hedging strategies to ensure a survival mechanism, even where environmental catastrophes are very rare.
are, in the short term, remarkably effective; however, the effects are rarely durable. Mutations that abrogate the effects of targeted therapies quickly emerge during treatment, driv-ing resistance, and, ultimately, mortality. The results of our chemical reaction model shed light on this Darwinian adap-tation, and suggest that targeted therapies to prevent bet-hedging may either be impossible, or, where they do exist, prone to fail due to the re-emergence of bet-hedging through evolution. More precisely, the discovery of a single “magic bullet”genetic factor (Strebhardt and Ullrich 2008), which, when targeted, can switch off multi-drug resistant dormant phenotypes, is unlikely, owing to redundancy in the network architecture. However, we should not rule out the potential of targeted therapies entirely. It may be possible to identify multiple targets for which simultaneous inhibition prevents bet-hedging. Alternatively, targets may be identified that shift the proportion of resistant or dormant individuals within a population to a manageable level, either permitting treatment with other cytotoxic agents, or driving the disease into a dormant state.
A second theoretical treatment strategy suggested to com-bat resistance in cancers and resistant infections (Bigger 1944) is the introduction of treatment holidays. The tradi-tional doctrine for therapy is one ofmaximal dose-density,i.e., that we should treat diseases using the most potent drug with the highest tolerable dose for the longest possible time until the disease is cured, the therapy ceases to be effective, or the drugs become too toxic. Mathematical models of disease pro-gression assuming genetically driven resistance indicate that this approach could drive the emergence of resistance through an ecological principle called competitive release
(Alto et al. 2013; Adkins and Shabbir 2014). Before treat-ment, cells compete with one another for limited resources within a spatially constrained population. In a nontreated environment, pre-existing resistant cells are often lessfit than sensitive ones, and, thus, owing to competition, do not grow to large numbers within the population. Selective pressures, for example within a growing tumor, are often not sufficiently strong for clonal sweeps (the fixation of a single genetic clone) to occur (Robertson-Tessi and Anderson 2015; Sottorivaet al.2015) and the population contains a hetero-geneous mix of phenotypes. When this population is exposed to a maximum dose-density therapy, the sensitive cells are killed, allowing the rapid outgrowth of the previously small and resistant population. This population then drives the re-currence of drug-resistant disease. Treatment holidays have been suggested as a potential therapeutic strategy to avoid drug resistance driven by competitive release (Enriquez-Navaset al.2016).
Here, we implemented an individual-based model of the dynamics of a bet-hedging population under treatment to explore the efficacy of treatment holidays in combating bet-hedging-driven resistance. Coupled with a long-term evolu-tionary simulation, we explored the impact of the mechanism driving bet-hedging on the efficacy of treatment holidays. Our model suggests that it is the GP map, and, in particular, how it
hinders or promotes the rate of evolution, that determines the efficacy of treatment breaks in reversing drug resistance. If the mechanism driving bet-hedging permits evolutionary loss in a short-to-medium timescale, then treatment holidays may drive the loss of bet-hedging and re-establish drug sensitivity. However, if instead, the driving mechanism slows the evolu-tionary loss of bet-hedging, then a treatment break is unlikely to re-establish drug sensitivity in a time frame relevant to disease progression. We note that interfering with the mech-anism driving bet-hedging through targeted therapy could alter the switching to allow the fast evolutionary loss of bet-hedging where previously this would not occur.
In this paper, we have taken the initial conditions of our reaction networks to be genetically determined and stable, allowing us to explore the implications of the structure of the network on the evolution of bet-hedging. The model we present could also be used to study additional aspects of nongenetic heterogeneity other than those presented here. For example, the model could be extended to directly account for the dynamics of gene expression [for example using the model presented by Kaernet al.(2005) or the GRN model presented by Huang (2009)]. We have assumed that the chemical species comprising the reaction networks are en-tirely depleted before reproduction and determination of the next phenotype. Omitting this assumption to permit the epigenetic inheritance of molecular switch state represents an extension of our model to account for phenotypic memory or carry-over. Alternatively, the initial conditions could be taken to be environmentally determined, and the network itself to be genetically determined. In this case the model would give a GP map similar to the neural network model used by Gerlee and Anderson (2007) and Gerleeet al.(2015) to study phenotypic plasticity. However, our model would differ in that the determination of phenotypes would be sto-chastic, permitting the study of environment-dependent bet-hedging strategies.
represents a potential step toward this goal, but importantly offers something more than previous models that have set out along this path: an attempt to account for the role of chance.
Acknowledgments
D.N. thanks the Engineering and Physical Sciences Re-search Council (EPSRC) for generous funding for doctoral studies (ref: OUCL/DN/2013). M.R.T. and A.R.A.A. ac-knowledge the National Cancer Institute funded Physical Science Oncology Center grant, U54CA193489.
Literature Cited
Adkins, S., and A. Shabbir, 2014 Biology, ecology and manage-ment of the invasive parthenium weed (Parthenium hysteropho-rusL.). Pest Manag. Sci. 70: 1023–1029.
Alto, B. W., R. L. Lampman, B. Kesavaraju, and E. J. Muturi, 2013 Pesticide-induced release from competition among com-peting Aedes aegyptiandAedes albopictus(Diptera: Culicidae). J. Med. Entomol. 50: 1240–1249.
Angluin, D., J. Aspnes, and D. Eisenstat, 2008 A simple popula-tion protocol for fast robust approximate majority. Distrib. Com-put. 21: 87–102.
Balaban, N. Q., J. Merrin, R. Chait, L. Kowalik, and S. Leibler, 2004 Bacterial persistence as a phenotypic switch. Science 305: 1622–1625.
Balázsi, G., A. van Oudenaarden, and J. J. Collins, 2011 Cellular decision making and biological noise: from microbes to mam-mals. Cell 144: 910–925.
Beaumont, H. J., J. Gallie, C. Kost, G. C. Ferguson, and P. B. Rainey, 2009 Experimental evolution of bet hedging. Nature 462: 90– 93.
Becskei, A., and L. Serrano, 2000 Engineering stability in gene networks by autoregulation. Nature 405: 590–593.
Becskei, A., B. Séraphin, and L. Serrano, 2001 Positive feedback in eukaryotic gene networks: cell differentiation by graded to binary response conversion. EMBO J. 20: 2528–2535.
Bigger, J., 1944 Treatment of staphylococcal infections with pen-icillin by intermittent sterilisation. Lancet 244: 497–500. Blake, W. J., G. Balázsi, M. A. Kohanski, F. J. Isaacs, K. F. Murphy
et al., 2006 Phenotypic consequences of promoter-mediated transcriptional noise. Mol. Cell 24: 853–865.
Botero, C. A., F. J. Weissing, J. Wright, and D. R. Rubenstein, 2015 Evolutionary tipping points in the capacity to adapt to environmental change. Proc. Natl. Acad. Sci. USA 112: 184– 189.
Brock, A., H. Chang, and S. Huang, 2009 Non-genetic hetero-geneity––a mutation-independent driving force for the somatic evolution of tumours. Nat. Rev. Genet. 10: 336–342.
Cardelli, L., 2014 Morphisms of reaction networks that couple structure to function. BMC Syst. Biol. 8: 84.
Cardelli, L., and A. Csikász-Nagy, 2012 The cell cycle switch com-putes approximate majority. Sci. Rep. 2: 656.
Charlebois, D. A., N. Abdennur, and M. Kaern, 2011 Gene expres-sion noise facilitates adaptation and drug resistance indepen-dently of mutation. Phys. Rev. Lett. 107: 218101.
Charlebois, D. A., G. Balázsi, and M. Kærn, 2014 Coherent feed-forward transcriptional regulatory motifs enhance drug resis-tance. Phys. Rev. E Stat. Nonlin. Soft Matter Phys. 89: 052708. Childs, D. Z., C. Metcalf, and M. Rees, 2010 Evolutionary bet-hedging in the real world: empirical evidence and challenges revealed by plants. Proc. Biol. Sci. 277: 3055–3064.
Cushing, J. M., 1998 An Introduction to Structured Population Dy-namics, Vol. 71, SIAM, Philadelphia, PA.
Danforth, B. N., 1999 Emergence dynamics and bet hedging in a desert bee, Perdita portalis. Proc. R. Soc. Lond. B Biol. Sci. 266: 1985–1994.
de Jong, I. G., P. Haccou, and O. P. Kuipers, 2011 Bet hedging or not? A guide to proper classification of microbial survival strat-egies. BioEssays 33: 215–223.
Dodd, I. B., M. A. Micheelsen, K. Sneppen, and G. Thon, 2007 Theoretical analysis of epigenetic cell memory by nucleo-some modification. Cell 129: 813–822.
Elowitz, M. B., A. J. Levine, E. D. Siggia, and P. S. Swain, 2002 Stochastic gene expression in a single cell. Science 297: 1183–1186.
Enderling, H., L. Hlatky, and P. Hahnfeldt, 2013 Cancer stem cells: a minor cancer subpopulation that redefines global cancer features. Breast 11: 200.
Enriquez-Navas, P. M., Y. Kam, T. Das, S. Hassan, A. Silva et al., 2016 Exploiting evolutionary principles to prolong tumor con-trol in preclinical models of breast cancer. Sci. Transl. Med. 8: 327ra24.
Gallie, J., E. Libby, F. Bertels, P. Remigi, C. B. Jendresen et al., 2015 Bistability in a metabolic network underpins the de novo evolution of colony switching inPseudomonasfluorescens. PLoS Biol. 13: e1002109.
Gerlee, P., and A. R. Anderson, 2007 An evolutionary hybrid cel-lular automaton model of solid tumour growth. J. Theor. Biol. 246: 583–603.
Gerlee, P., and A. R. Anderson, 2009 Modelling evolutionary cell behaviour using neural networks: application to tumour growth. Biosystems 95: 166–174.
Gerlee, P., E. Kim, and A. R. Anderson, 2015 Bridging scales in cancer progression: mapping genotype to phenotype using neu-ral networks. Semin. Cancer Biol. 30: 30–41.
Gillespie, D. T., 1977 Exact stochastic simulation of coupled chemical reactions. J. Phys. Chem. 81: 2340–2361.
Gillespie, D. T., 2001 Approximate accelerated stochastic simula-tion of chemically reacting systems. J. Chem. Phys. 115: 1716– 1733.
Gillespie, J. H., 1983 A simple stochastic gene substitution model. Theor. Popul. Biol. 23: 202–215.
Gillespie, J. H., 1984 Molecular evolution over the mutational landscape. Evolution 38: 1116–1129.
Gould, S. J., and R. C. Lewontin, 1979 The spandrels of San Marco and the Panglossian paradigm: a critique of the adaptationist programme. Proc. R. Soc. Lond. B Biol. Sci. 205: 581–598. Greaves, M., and C. C. Maley, 2012 Clonal evolution in cancer.
Nature 481: 306–313.
Gupta, P. B., C. M. Fillmore, G. Jiang, S. D. Shapira, K. Taoet al., 2011 Stochastic state transitions give rise to phenotypic equi-librium in populations of cancer cells. Cell 146: 633–644. Hasty, J., J. Pradines, M. Dolnik, and J. J. Collins, 2000
Noise-based switches and amplifiers for gene expression. Proc. Natl. Acad. Sci. USA 97: 2075–2080.
Hopper, K. R., 1999 Risk-spreading and bet-hedging in insect pop-ulation biology 1. Annu. Rev. Entomol. 44: 535–560.
Huang, S., 2009 Non-genetic heterogeneity of cells in develop-ment: more than just noise. Development 136: 3853–3862. Huang, S., 2012 The molecular and mathematical basis of
Wad-dington’s epigenetic landscape: a framework for post-Darwinian biology? BioEssays 34: 149–157.
Isaacs, F. J., J. Hasty, C. R. Cantor, and J. J. Collins, 2003 Prediction and measurement of an autoregulatory genetic module. Proc. Natl. Acad. Sci. USA 100: 7714–7719.
Keren, I., D. Shah, A. Spoering, N. Kaldalu, and K. Lewis, 2004 Specialized persister cells and the mechanism of multi-drug tolerance inEscherichia coli. J. Bacteriol. 186: 8172–8180. Kurata, T., K. Tamura, H. Kaneda, T. Nogami, H. Uejima et al., 2004 Effect of re-treatment with gefitinib (‘Iressa’, ZD1839) after acquisition of resistance. Ann. Oncol. 15: 173–174. Kussell, E., and S. Leibler, 2005 Phenotypic diversity, population
growth, and information in fluctuating environments. Science 309: 2075–2078.
Levy, S. F., N. Ziv, and M. L. Siegal, 2012 Bet hedging in yeast by heterogeneous, age-correlated expression of a stress protectant. PLoS Biol. 10: 952.
Lewis, K., 2006 Persister cells, dormancy and infectious disease. Nat. Rev. Microbiol. 5: 48–56.
Li, C.-K., and H. Schneider, 2002 Applications of Perron–Frobenius theory to population dynamics. J. Math. Biol. 44: 450–462. McFarland, C. D., L. A. Mirny, and K. S. Korolev, 2014 Tug-of-war
between driver and passenger mutations in cancer and other adaptive processes. Proc. Natl. Acad. Sci. USA 111: 15138– 15143.
Meacham, C. E., and S. J. Morrison, 2013 Tumour heterogeneity and cancer cell plasticity. Nature 501: 328–337.
Müller, J., B. Hense, T. Fuchs, M. Utz, and C. Pötzsche, 2013 Bet-hedging in stochastically switching environments. J. Theor. Biol. 336: 144–157.
Nikaido, H., 2009 Multidrug resistance in bacteria. Annu. Rev. Biochem. 78: 119.
Pardal, R., M. F. Clarke, and S. J. Morrison, 2003 Applying the principles of stem-cell biology to cancer. Nat. Rev. Cancer 3: 895–902.
Pigliucci, M., 2010 Genotype–phenotype mapping and the end of the‘genes as blueprint’metaphor. Philos. Trans. R. Soc. Lond. B Biol. Sci. 365: 557–566.
Quintana, E., M. Shackleton, H. R. Foster, D. R. Fullen, M. S. Sabel
et al., 2010 Phenotypic heterogeneity among tumorigenic mel-anoma cells from patients that is reversible and not hierarchi-cally organized. Cancer Cell 18: 510–523.
Raj, A., and A. van Oudenaarden, 2008 Nature, nurture, or chance: stochastic gene expression and its consequences. Cell 135: 216–226.
Ramirez, M., S. Rajaram, R. J. Steininger, D. Osipchuk, M. A. Roth
et al., 2016 Diverse drug-resistance mechanisms can emerge from drug-tolerant cancer persister cells. Nat. Commun. 7: 10690.
Reya, T., S. J. Morrison, M. F. Clarke, and I. L. Weissman, 2001 Stem cells, cancer, and cancer stem cells. Nature 414: 105–111.
Ricci-Vitiani, L., D. G. Lombardi, E. Pilozzi, M. Biffoni, M. Todaro
et al., 2007 Identification and expansion of human colon-cancer-initiating cells. Nature 445: 111–115.
Robertson-Tessi, M., and A. Anderson, 2015 Big bang and con-text-driven collapse. Nat. Genet. 47: 196–197.
Seger, J., 1987 What is bet-hedging? Oxford Surveys in Evolution-ary Biology 4: 182–211.
Sharma, S. V., D. Y. Lee, B. Li, M. P. Quinlan, F. Takahashiet al., 2010 A chromatin-mediated reversible drug-tolerant state in cancer cell subpopulations. Cell 141: 69–80.
Sottoriva, A., H. Kang, Z. Ma, T. A. Graham, M. P. Salomonet al., 2015 A big bang model of human colorectal tumor growth. Nat. Genet. 47: 209–216.
Strebhardt, K., and A. Ullrich, 2008 Paul Ehrlich’s magic bullet concept: 100 years of progress. Nat. Rev. Cancer 8: 473–480. Thattai, M., and A. Van Oudenaarden, 2004 Stochastic gene
ex-pression influctuating environments. Genetics 167: 523–530. Tonegawa, S., 1983 Somatic generation of antibody diversity.
Na-ture 302: 575–581.
Veening, J.-W., W. K. Smits, and O. P. Kuipers, 2008 Bistability, epigenetics, and bet-hedging in bacteria. Annu. Rev. Microbiol. 62: 193–210.
Via, S., and R. Lande, 1985 Genotype-environment interaction and the evolution of phenotypic plasticity. Evolution 39: 505–522. Wilke, C. O., 2003 Probability offixation of an advantageous
mu-tant in a viral quasispecies. Genetics 163: 467–474.
Wilke, C. O., 2005 Quasispecies theory in the context of popula-tion genetics. BMC Evol. Biol. 5: 1.
Wolf, D. M., V. V. Vazirani, and A. P. Arkin, 2005 Diversity in times of adversity: probabilistic strategies in microbial survival games. J. Theor. Biol. 234: 227–253.
Yano, S., E. Nakataki, S. Ohtsuka, M. Inayama, H. Tomimotoet al., 2005 Retreatment of lung adenocarcinoma patients with gefi -tinib who had experienced favorable results from their initial treatment with this selective epidermal growth factor receptor inhibitor: a report of three cases. Oncol. Res. 15: 107–111. Zhang, Y., W. W. Yew, and M. R. Barer, 2012 Targeting persisters
for tuberculosis control. Antimicrob. Agents Chemother. 56: 2223–2230.
Supplementary Materials
Proof of the Identity for
π
Here we provide a brief proof of the identity
1
−
π
=
e
−Pπ(1)
where
P
=
1
h
w
i
w
Ap
w
Bp
w
A(1
−
p)
w
B(1
−
p)
.
(2)
The proof is modified from the theory of viral quasispecies and was originally presented by Wilke
[2003].
Under Wright–Fisher sampling the probability that a randomly chosen individual in the next
generation is the offspring of a given individual of phenotype
i
∈ {
A, B
}
in the current generation is
wi
hwiN
. Thus, the probability that an individual is the offspring of a particular parent of phenotype
i
and genotype
g
and also has phenotype
r
is
ξ
r=
w
iP
(g
GP→
r)
h
w
i
N
(3)
as not all offspring will have phenotype
r. It follows that the probability that a given individual
of phenotype
i
has precisely
k
roffspring of phenotype
r
in the next generation is given by
p(k
r|
i) =
N
k
rξ
krr
(1
−
ξ
r)
N−kr(4)
We can extend this argument to both phenotypes. The probability that an individual of
phe-notype
i
has
k
Aoffspring of phenotype
A
and
k
Boffspring of phenotype
B
is
p(k
A, k
B|
i) =
N
!
k
A!k
B!(N
−
k
A−
k
B)!
ξ
kAA
ξ
kBB
(1
−
ξ
A−
ξ
B)
N−kA−kB(5)
=
N
!
k
A!k
B!(N
−
k
A−
k
B)!
P
i1N
kA
P
i2
N
kB
×
1
−
P
i1N
−
P
i2N
N−kA−kB(6)
where the second equality follows from the definition of
P
. Assume now that the population
size,
N
, is sufficiently large that we may approximate
p(k
A, k
B|
i) by taking the limit as
N
→ ∞
.
This limit is a bivariate Poisson distribution
p(k
A, k
B|
i) =
P
kAi1
k
A!
×
P
kB
i2