IRIS_2012 BENCHMARK – PART I: OVERVIEW AND SUMMARY OF
THE RESULTS
Nebojsa Orbovic1, Francois Tarallo2, Jean-Mathieu Rambach3 and Andrei Blahoianu4 1
Technical Specialist, CNSC-CCSN, Ottawa, ON, Canada ([email protected])
2
Civil Engineering Expert, IRSN, France ([email protected])
3
Dr-Engineer, Civil Engineering Expert, IRSN, France
4
Director, CNSC-CCSN, Ottawa, ON, Canada
ABSTRACT
A benchmark of numerical simulations of projectile impacts on reinforced concrete (RC) slabs has been launched in the frame of OECD/NEA/CSNI research program under the acronym IRIS. The goal of the research program is to simulate RC structural, flexural and punching, behavior under soft and hard missile impact. The first phase the IRIS_2010 was a blind prediction of the tests performed ant VTT facility in Espoo, Finland. The results showed significant scatter of the results for both flexural and punching simulation. The IRIS_2012 is the second, post-test, phase of the benchmark with the goal to improve simulations and reduce the scatter of the results. Based on the IRIS_2010 recommendations and to better calibrate concrete constitutive models, a series of tri-axial tests as well as Brazilian tests ware performed as a part of the IRIS_2012 benchmark. 25 teams from 11 countries took part in this exercise. Majority of participants were part of the IRIS_2010 benchmark. Participants showed significant improvement in reducing epistemic uncertainties in impact simulations. Several teams presented both FE and simplified analysis as per recommendations of the IRIS_2010. The improvements were at the level of simulation results but also at the level of understanding of impact phenomena and its modeling. However, due to the complexity of the physical phenomena and its simulation (high geometric and material non-linear behavior) and inherent epistemic and aleatory uncertainties, the scatter remains important especially comparing to conventional, linear structural engineering analysis. The next goal is to further reduce the scatter and to concentrate on impact induced structural vibrations.
INTRODUCTION
Simulation of reinforced concrete structures under medium velocity hard and soft missile impact, including simulation of the perforation of the impacted structure, is a relatively new type of analysis. There is a need to present a current state-of-the-art on this topic and to provide some guidance for practitioners doing or reviewing this type of simulations. A benchmark of numerical simulations of projectiles impacts on reinforced concrete (RC) slabs has been launched in the frame of OECD/NEA/CSNI under the acronym IRIS. The IRIS_2012 is the second phase of the benchmark, organized as the first phase in collaboration of CNSC and IRSN with the workshop chaired and hosted by CNSC in Ottawa in October 2012. The first phase, IRIS_2010, deals with blind prediction of flexural and punching tests and is presented in a series of five papers: Rambach et al. (2011), Vepsa et al. (2011), Orbovic et al. (2011), Berthaud et al. and Tarallo et al. (2011). IRIS_2012 is a post-test simulation, a follow-up of IRIS_2010. This is the first in a series of two papers related to this new exercise. The second one, on lessons learned and recommendations, is presented in Tarallo et al. (2013).
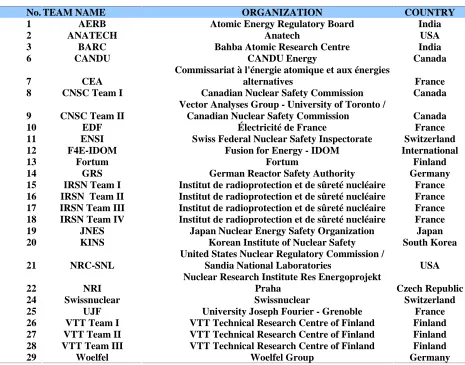
Table 1: List of the IRIS_2012 participants
No. TEAM NAME ORGANIZATION COUNTRY
1 AERB Atomic Energy Regulatory Board India
2 ANATECH Anatech USA
3 BARC Bahba Atomic Research Centre India
6 CANDU CANDU Energy Canada
7 CEA
Commissariat à l'énergie atomique et aux énergies
alternatives France 8 CNSC Team I Canadian Nuclear Safety Commission Canada
9 CNSC Team II
Vector Analyses Group - University of Toronto /
Canadian Nuclear Safety Commission Canada
10 EDF Électricité de France France
11 ENSI Swiss Federal Nuclear Safety Inspectorate Switzerland 12 F4E-IDOM Fusion for Energy - IDOM International
13 Fortum Fortum Finland
14 GRS German Reactor Safety Authority Germany 15 IRSN Team I Institut de radioprotection et de sûreté nucléaire France 16 IRSN Team II Institut de radioprotection et de sûreté nucléaire France 17 IRSN Team III Institut de radioprotection et de sûreté nucléaire France 18 IRSN Team IV Institut de radioprotection et de sûreté nucléaire France 19 JNES Japan Nuclear Energy Safety Organization Japan 20 KINS Korean Institute of Nuclear Safety South Korea 21 NRC-SNL
United States Nuclear Regulatory Commission /
Sandia National Laboratories USA 22 NRI
Nuclear Research Institute Res Energoprojekt
Praha Czech Republic
24 Swissnuclear Swissnuclear Switzerland
25 UJF University Joseph Fourier - Grenoble France 26 VTT Team I VTT Technical Research Centre of Finland Finland 27 VTT Team II VTT Technical Research Centre of Finland Finland 28 VTT Team III VTT Technical Research Centre of Finland Finland
29 Woelfel Woelfel Group Germany
RECALL OF IRIS_2010 RESULTS, LESSONS LEARNED AND RECOMMENDATIONS
Subsequently, the recommended input for the IRIS_2012 benchmark is:
- a single set of concrete material properties (unconfined concrete strength, tensile strength)
- tri-axial and Brazilian tests to calibrate concrete constitutive models
Moreover, it is recommended to perform:
- sensitivity studies to improve existing models for flexural and punching simulations
- analysis using simplified models along with complex FE simulations for sanity checks.
The type and complexity of simplified models were left to the choice of participants.
Table 2: Software (with the number of teams) used in the IRIS_2010 and 2012 benchmarks
IRIS_2010 IRIS_2012 6 ABAQUS 9 ABAQUS
9 Ls-Dyna 6 Ls-Dyna 2 Autodyn 2 Autodyne 2 Europlexus 2 Europlexus
Radioss Radioss V11
SofiStik SofiStik
SAP VecTor2-VecTor3
EMU BARC in-house
ULCA Sierra/SM2012 2D Simplified PENTABLOC Simplified
Simplified VTT team II Simplified VTT Team III
IRIS_2012 TEST INPUT
Tri-axial and Brazilian tests
Based on the conclusions of the IRIS_2010, the data of tri-axial tests were provided to the IRIS_2012 participants. The Tri-axial tests were performed at the University Josef Fourier in Grenoble, France and were provided courtesy of IRSN. The tri-axial tests were performed for confining pressure of 0 MPa, 12.5 MPa, 25 MPa 47 MPa and 100 MPa. The tests specimens after the tests and the tests results in terms of stress-strain curves for the confinement pressure of 47 MPa and 100 MPa are presented in Figures 1 and 2. The increase in concrete compressive strength and ultimate strains are significant comparing to unconfined conditions. Moreover, the rupture mechanism changes from vertical cracks (unconfined condition), inclined cracks (47 MPa confinement) to horizontal cracks (100 MPa confinement). A Brazilian test was performed by VTT giving concrete tensile strength of 4.04 MPa.
Figure 2: Stress-strain curves for tri-axial tests with confinement of 47 MPa and 100 MPa
Flexural and punching tests
The details regarding the flexural and the punching tests for the IRIS_2010 tests are presented in Vepsa et al. (2011). Flexural test was performed launching a 0.25 m diameter soft missile (mass 50 kg and V=110 m/s) against 2 m X 2 m X 0.15 m slab. Punching test was performed launching a 0.168 m diameter hard missile (mass 47 kg and V=135 m/s) against 2 m X 2 m X 0.15 m slab. A single set of input data for each test was provided to the participants: unconfined compressive strength of 55.2 MPa+/- 1.26 (cube 29 days 63.9 MPa) and tensile strength 3.71 MPa+/-0.15, for flexural test and unconfined compressive strength 60.0 MPa+/- 1.16 (cube 29 days 67.6 MPa), tensile strength 4.04 MPa+/-0.177 for punching test.
IRIS_2012 Results
Flexural test results
IRIS_2012
flexure
displacement
time
‐
history
w1
‐120
‐100
‐80
‐60
‐40
‐20
0 20
0 10 20 30 40 50 60 70 80 90 10
time (ms)
di
sp
la
ce
m
e
n
t
(mm)
0
1 2 6 8 9 11 12 14 15
16 17 18 19 21 22 24 25 26
27 29 exp
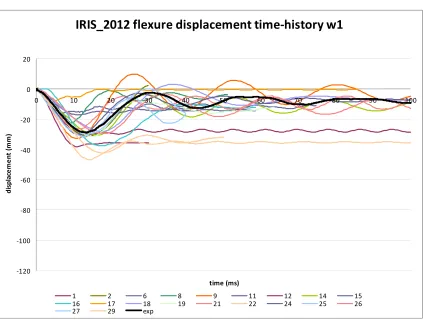
Figure 3: Maximum displacement time history: all simulations and the test results in black
The maximum displacement time history from all flexural simulations and the test measurements is presented in Figure 3. The plot clearly shows that, globally, simulations capture relatively well the maximum displacement. However, the induced vibrations, the damping and the residual displacement are more difficult to simulate. These three parameters represent induced damage due to the impact and this damage is difficult to simulate, especially if the model is calibrated to capture maximum displacement.
IRIS_2010 flexure maximum displacement w1 (mm)
0 20 40 60 80 100 120
1 2 3 4 5 6 7 8 9 10 11 12 13 14 15 16 17 18 19 20 21 22 23 26 27
maximum displacement mean mean ‐ sde mean + sde experimental
IRIS_2012 flexure maximum displacement w1 (mm)
0 20 40 60 80 100 120
1 2 6 8 9 11 12 14 15 16 17 18 19 20 21 22 25 26 27 28 29
maximum displacement mean mean ‐ sde mean + sde experimental
Figure 4: Maximum displacement simulation results in IRIS_2010 and IRIS_2012
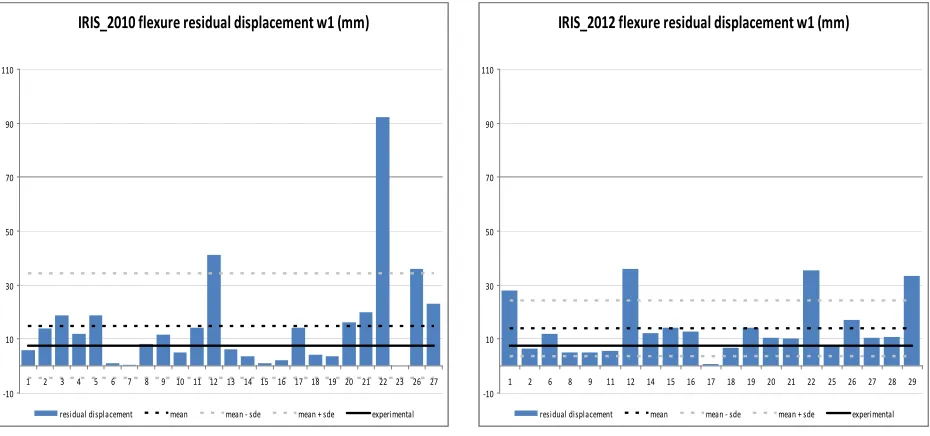
Figure 5 present residual displacements and here we can quantify the observation from the Figure 3 regarding the difficulty to capture the damage of the reinforced concrete element under soft missile impact (impulsive type of loading). The COV in the IRIS_2010 was 132% and in the IRIS_2012 the COV was 75%. The improvement in the IRIS_2012 is significant but the COV of 75 % is very high. There is a need to improve concrete constitutive models to better capture the concrete damage.
IRIS_2010 flexure residual displacement w1 (mm)
‐10 10 30 50 70 90 110
1 2 3 4 5 6 7 8 9 10 11 12 13 14 15 16 17 18 19 20 21 22 23 26 27
residual displacement mean mean ‐ sde mean + sde experimental
IRIS_2012 flexure residual displacement w1 (mm)
‐10 10 30 50 70 90 110
1 2 6 8 9 11 12 14 15 16 17 18 19 20 21 22 25 26 27 28 29
residual displacement mean mean ‐ sde mean + sde experimental
Figure 5: Residual displacement simulation results in IRIS_2010 and IRIS_2012
Punching test simulation results
The most reliable information regarding the punching test, with slab perforation, similar to deflections in the flexural test, are: missile residual velocity, slab displacements and the concrete damage at the rear face of the specimen. In this paper the test results are presented in terms of missile residual velocities and slab displacements.
IRIS_2010 punching residual missile velocity (m/s)
‐50
‐30
‐10 10 30 50 70 90 110 130
1 2 3 4 5 6 7 8 9 10 11 12 13 14 16 17 18 19 20 21 22 23 24 25 26 27
residual velocity mean mean ‐ sde mean + sde experimental
IRIS_2012 punching residual missile velocity (m/s)
‐50
‐30
‐10 10 30 50 70 90 110 130
1 2 3 6 8 9 10 11 12 13 14 15 16 17 19 25 27 29
residual velocity mean mean ‐ sde mean + sde experimental
Figure 6: Residual velocities the IRIS_2010 and IRIS_2012
Regarding the missile residual velocities it is difficult to apply the same statistic as in the flexural case taking into account that some teams got negative residual velocity (rebound). However, based on the results shown in Figure 6, it can be easily noticed significant improvement comparing to the IRIS_2010 results. The main issue during the IRIS_2010 exercise related to punching behavior was the simulation of the missile perforation. To allow the missile to perforate the slab the disintegrated concrete should be removed from the model in terms of its stiffness but conserving its mass. The modeling and removing of the disintegrated concrete is done in most of the codes using ‘Erosion” routine. The parameters used in this routine have no physical meaning. In some codes this routine is incorporated in the concrete constitutive model and sensitive to some physical input parameters like concrete tensile strength but without providing how this routine is implemented. In the IRIS_2010 only 8 out of 21 teams achieved the missile perforation. In the IRIS_2012 15 out of 18 teams simulated successfully missile perforation with the residual velocity close to the test residual velocity (continuous black line in Figure 6).
IRIS_2010 punching displacement time‐history w4
‐120
‐100
‐80
‐60
‐40
‐20 0 20 40
0 10 20 30 40 50 60 70 80 90 10
time (ms)
di
spl
ac
e
m
e
nt
(m
m
)
0
1 2 3 4 5 6 7 8 9 10 11
12 13 14 16 17 18 19 20 21 22 23
24 25 26 exp
IRIS_2012 punching displacement time‐history w4
‐120
‐100
‐80
‐60
‐40
‐20 0 20 40
0 10 20 30 40 50 60 70 80 90 10
time (ms)
di
spl
ac
e
m
e
n
t
(mm)
0
1 2 3 6 8 9 11
12 13 14 15 16 17 19
20 25 29 exp
Figure 7: Time history of slab displacements in IRIS_2010 and IRIS_2012
Simplified models
Although the use of simplified models was strongly encouraged based on the first phase IRIS_2010, only five teams presented simplified approaches. The level of simplification was not specified by the IRIS Organizing Committee. Therefore the presented simplified approaches were very different, from analytical approached presented in Excel sheet, to simplified FE models.
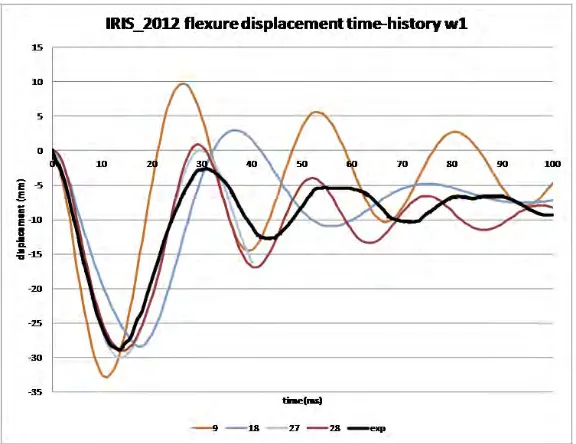
Figure 8: Time history of slab displacements in the IRIS_2012simplified flexural simulation
Due to the complexity of simulated phenomena, there is a need to have at least two different and independent approaches. The results of flexural test simulations presented in Figure 8 show that simplified models can capture well the chosen parameter (slab maximum displacement in this case).
CONCLUSIONS
The results of second phase of the OECD/NEA/CSNI research program IRIS_2012 presented in this paper show significant improvement in simulation capabilities compared to the previous IRIS_2010 phase. The improvement in understanding of impact phenomena can be seen at the level of the results but also at the level of technical discussions among participants during the workshop held in Ottawa in October 2012.
The first step in the IRIS_2012, based on recommendation of IRIS_2010, was the simulation of tri-axial and Brazilian tests. Most of the teams modeled these tests. However, it is not always stated whether or not the results of these simulations are used for calibration of constitutive models utilized for simulation of flexural and punching test. Some participants concluded inadequacy of static tri-axial tests for dynamic high strain-rate impactive loading performed in flexural and punching tests. Moreover, they concluded that it was not possible to calibrate constitutive models in commercially available software using these tests. The modeling of a Brazilian test ended up with similar conclusion as tri-axial tests.
The calibration of a constitutive model is strongly dependent of the type of loading case for which it is calibrated and it doesn’t mean that it will give satisfactory results for another type of loading case (
tri-axial, Brazilian, flexural and punching). However, the general finding is
that different software,
or/and different concrete models within the same software, can be calibrated to get similar results
which are close to results for two different tests (flexural and punching).
Knowing in advance the test results helped participants to tune existing models and for new participants to develop calibrated models. However, in most cases, the teams do not provide the main reason for the improvement. It looks like that the main model geometry and mash refinement was not significantly modified. The main modifications are in concrete constitutive laws.Simplified models, used mainly for simulation of flexural tests, are very useful tolls for the analysis of one single parameter (such as maximum displacement and perforation velocity) and should be used in parallel with complex FE models that are able to model the whole structural impact phenomenon. The results obtained from simplified models in IRIS_2012 exercise are very similar to the results obtained from complex models for a given parameter.
The IRIS_2012 results show that the main simulation issues identified in the IRIS_2010 still remain because of the complexity of the problem. One example of these issues is the influence of physical parameters (e.g. concrete compressive and tensile strength) versus non-physical parameters (e.g. concrete erosion) in constitutive models on overall simulation results. Another example is the simulation of residual displacements. The simulation of residual displacements includes the simulation of structural damage (damping, frequency shift). Residual displacements and structural damage are much more difficult to capture than maximum displacements. Concrete constitutive models should be improved to better simulate concrete damage. Further conclusions and recommendations of the IRIS_2012 can be found in Tarallo et al. (2013).
REFERENCES