Design of Impulse Turbine for Energy
Regeneration from Kinetic Energy of
Exhaust Gas
Saurabh D. Burde1, Ashoksingh M.Baghel2
B.E. Student, Department of Mechanical Engineering, Sinhgad Institute, Pune, India1
B.E. Student, Department of Mechanical Engineering, Sinhgad Institute, Pune, India 2
ABSTRACT: As we know efficiency of any Diesel engine is only 40% remaining 60% of energy got waste. This waste energy carried away by cooling water or coolant use in engine to maintain temperature of I C engine, unaccounted source like friction in moving components in the system, leakages of air fuel mixture etc. And through exhaust gases which carry 400ºC to 500ºC amount of heat energy up to 7 bar of pressure energy.
Waste energy carried away by cooling water and unaccounted source we cannot control because cooling of engine cylinder is necessary to avoid deformation and engine seizing also we can’t control waste energy from unaccounted source, mechanical joints, linkages always create friction and high pressure in I.C. engine always have leakages because piston in cylinder is moving part. So here our concerns are with exhaust which carry away 30-35% ofenergywhichcontainupto4-7barpressureat450-550ºC.Thispressureenergycanutilize by turbocharger but in turbocharger reaction turbine is used which work on mostly pressure energy of fluid and turbocharger only have 70-75% of efficiency so remaining 25-30% of energy still gets waste which is in the form of kinetic energy at nearly 400ºC temperature. This waste energy also controllable by saving this kinetic energy using impulse tur bine.
KEYWORDS:Waste Exhaust Energy, Exhaust Energy Regeneration, Waste EnergyAfterTurbocharging, Axial Impulse Turbine, EN24, Impulse Turbine Design, CFD on Impulse Turbine, Static Structural Analysis of T ur bin e.
I. INTRODUCTION
After the exhaust stroke burnt gases contain up to 4-7 bar pressure at 450 to 550ºC temperatureas per Vincenzo De Bellis et.al. [1] represents 1D simulation and experimental analysis of a turbocharger turbine for automotive engine under steady and unsteady flow conditions.So, considering all losses in valve, pipes bent losses, at the inlet of the turbocharger it has 3-5 bar pressure. This assumption taken usingM. S Chiong et.al. [3] paper presentsnon-adiabatic pressure loss boundary condition for modelling turbo charger turbine pulsating flow and M.H. Padzillah et.al. [2] which presents influence of speed and frequency towards the automotive turbocharger turbine performance under pulsating flow condition. A simplified methodology of pulse flow turbine modelling. Turbocharger utilize that pressure by using reaction turbine to run the compressor which use to compresses inlet air charge in C.I engine. At outlet of turbo charger pressure is fall up to nearly 1bar because of reaction turbine which mostly work on pressure energy of fluid, but burnt gases still contain kinetic energy nearly 140 m/s of velocity and nearly 0.1-0.2 kg/s of mass flow rate. So, this kinetic energy can utilize by implementing Impulse turbine.The term impulse means sudden force act to bring desire change. It denotes as product of force and time interval for which it acts.Impulse turbine works on the same principle, i.e. it works on the kinetic energy of fluid [7] [10]. This impulse turbine rotates the shaft attached to it and rotational energy can be converted into electrical energy using alternator. Electrical energy can use to charge the battery of automobile. This is the research-based project so we built up the conceptual model and aim is to find out how much power it can produce. Figure-1 shows the labelled diagram for our model.
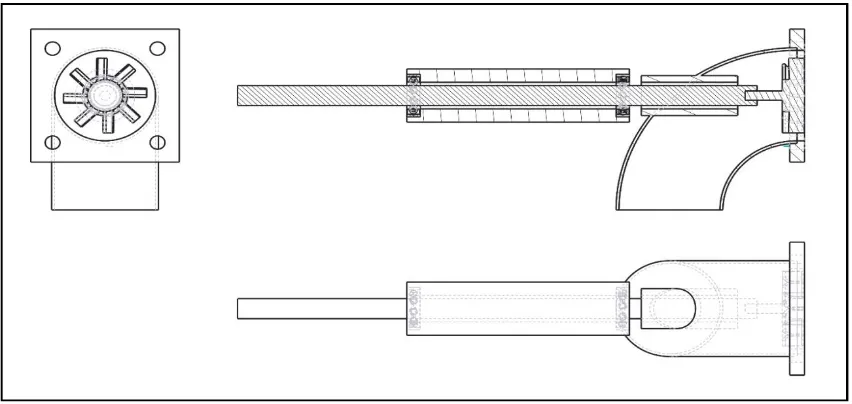
Diagram shows the inlet to the turbocharger at 5 to 3 bar pressures. It is use to run turbocharger turbine which is reaction turbine of efficiency 70-75%. At outlet the pressure reduces to the 2 to1 bar. Inlet to our model to save kinetic energy using impulse turbine. To see the exact half section view of our project figure 2 shows the wireframe diagram for our project.
Figure 2 Wireframe diagram and half sectional view of project model
Objectives
•
To preventwastage of energy from exhaustgases.•
Find how much p o w e r this conceptual model can produce.•
To use energy from exhaust gases to charge battery in automobiles so there are no frictionlosses.•
Maximize use of engine fuelpower.•
Compare conceptual model working with actual model calculation.II. DESIGN CALCULATION
For design calculation we selected the truck model TATA Tipper which is according to availability and capacity of truck. Following are the design calculation
1 Calculation for waste Kinetic Energy
Model TATA 1613 Tipper (engine 697 tcic) Capacity – 5883 cc
So, for mass flowrate,
Let’s assume engine running at 1500 rpm Also 1500 rpm = rps = 25 rps
There are two rotations required to complete 1 cycle in 4 stroke IC engine i.e.
First rotation – suction and compression stroke
Second rotation – expansion and exhaust stroke So, for total no. of strokes per second
= 25×2
= 50 strokes per second
But for mass of air at inlet we only consider suction strokes i.e. = 12.5 suction strokes per second
So, capacity of engine 5.883 liters So 12.5× 5.883 = 73.5625 liters/second i.e. 73.5625 liters/second ↔ 0.073565 m3 /s
we know that, d = … [8]
i.e. density = mass/volume density of air = 1 kg/m3
property of diesel considers negligible because very small amount of diesel is added in air fuel mixer therefore 1 = .
⸫ m = 0.073565 kg/sec
With application of turbocharger fresh air charge compressed from 1 bar to 2-3 bar at the inlet of engine cylinder
So, the volumetric efficiency of engine cylinder will be twice
⸫ m = 0.073565×2
⸫ m = 0.14713 kg/sec
We know that,
P v = m R T … [6]
where,
p = pressure in N/m2
v = volumetric flow rate in m3/sec m= mass flow rate kg/sec
R= gas constant (0.287 kpa.m3/kg.k) T= temperature in ºK (400ºC+273=673 ºK) 1×10⁵×v = 0.14713×0.287×673
Figure3Representation of Area of Flow Rate Using Turbocharger Gasket
Now we know the volumetric flow rate of the exhaust to calculate the velocity of gas we need the area at the outlet of the turbine, by using the gasket dimension we can have the outlet dimension of turbocharger. So, we can easily design turbine shroud diameter and hub diameter which is equal to shroud diameter of turbocharger turbine and hub of turbocharger turbine. Figure s3 show the diagram for area of flow using turbocharger outlet gasket.
Flow area(A) = (Blade tip diameter - Hub diameter) - (thickness of turbocharger turbine blade × height of turbocharger turbine blade × number of turbocharger turbine blade)
A = × 0.056 − × 0.024 − (0.00025 × 0.032 × 12)
A = 1.914619298 ×
For velocity,
v = A × Ve … [5]
⸫ 0.2841830663 = 1.914619298×10 ×Ve ⸫ Ve = 156.2630874 m/sec
For kinetic energy,
K.E. = × mVe … [6]
⸫ × 0.14713 ×156.2630874
⸫ K.E. = 1796.321337 watt
1.2 Calculation for turbine design For max. efficiency (ɳb-max) = cos2α Consider α = 10º
Inlet vel. = Ve = V1=156.2630874 m/sec
⸫Vb = ( ) V1
⸫ Vb = ( ) × 156.2630874 ⸫ Vb = 76.9445499 m/s
1.2.1 Calculation for inlet velocity triangle
Velocity of flow at inlet is 90º so the inlet angle is taken 90º as no guide blade are provided in this conceptual model.
i.e. α = θ = 90º
Vw1 = V1cos α = 156.2630874 × cos 90º
Vw1 = 0
Vf1 = V1sin α = 156.2630874 × sin 90º
Vf1 = 156.2630874 m/s
BD = Vw1 - Vb = 156.2630874 m/s
Vr1 = = √156.2630874
Vr1 = 156.2630874 m/s
1.2.2 Calculation for outlet velocity triangle
For maximum possible degree of outlet angle 10º outlet angle is selected. Also, Vr1 = Vr2 = 156.2630874 m/s
Vf2 = V1 sin ϕ = 156.2630874 × sin 10º
Vf2 = 27.13480036 m/s
AB = Vr2 cos ϕ = 156.2630874 × cos 10º
AB = 153.8891 m/s
Vw2 = AB – Vb = 153.8891 – 76.9445499
Vw2 = 76.9445499 m/s
β = tan-1 ( ) = tan-1 ( .. )
β = 19.4254º
V2 = = .
.
V2 = 81.5887759 m/s
1.3 For power output of turbine Poutput = m × (Vw1 + Vw2) Vb
Poutput = 0.14713× (0 + 76.9445499) × 76.9445499
Poutput = 871.0778329 watt
1.4 For turbine efficiency
ɳimpturb=
. . ɳimpturb= ..
By using all calculation of inlet and outlet tringle following is the representation of velocity diagram for turbine blade.
Figure 4Inlet and Outlet Blade Velocity Tringle of turbine blade
above calculation give the theoretical result for turbine which is turbine of our conceptual model can produce power up to 871.0778329 watt. which have theoretical efficiency of 48.49%. Now, next we find out how it works experimentally. To build up actual model we start from proper martial selection according to type of loading acting on various components and surrounding working environment of our model.
III.MATERIAL SELECTION
At turbine power plant for temperature between 400 ºC to 600 ºC Stainless steel ‘304/304L’ is use. This project also works under same temperature ranges. Alternative to Stainless steel ‘304/304L’ ‘EN24-alloy steel’ also can use in this temperature range. For selection of material Phillip Downson et.al. [4] represents selection of material and material related process for centrifugal compressor and steam turbine in the oil and petrochemical Industry.In our project high tensile force act on the turbine blade due to centrifugal force. Crushing force is act on the bolted area of plate so high strength properties are required. Alloy steel EN24 steel is a high tensile alloy steel renowned for its wear resistance properties and also where high strength properties are required. EN24alloy is nearly half of the price of Stainless steel ‘304/304L’ which is Rs 80-100 /- kg. and easily available.Heat treatment on alloy steel: -
In hardening processof EN24 heat uniformly to 823/850°C until heated through. Quench in oil.
Then foe tempering steel heat uniformly and thoroughly at the selected tempering temperature, up to 660°C and hold at heat fortwo hours per inch of total thickness. Tempering between 250-375°C in not recommended as this can seriously reduce the steels impact value.
Figure 5 Properties edited in Ansys for analysis of various component of project
IV.COMPONENTS AND DIMENSIONS
According to model TATA 1613 turbocharger exhaust we have to design our project so following are the reasons for selecting appropriate size of each components.
1 Plate
Figure 6
Plate dimensionsin centre of diameter 68 mm. It also bore with 72 mm diameter up to 5 mm Height concentric to 68 mm diameter hole. 1mm×4 holes are provided for bolting it with turbocharger outlet. Thickness is considered of 1mm which is very strong to carry overall weight of the model project. For safety plate analysis also done by using Ansys software which shows design is safe for the plate Figure 6 show the dimension of plate
.
2 Elbow Pipe
Elbow shape pipe selected because it separates the alternator and bearings from exhaust gases, which can damage it. Material selection for pipe is EN24 which is good to use 450 to 550ºC. Its inner and outer diameter is 68mm and 72mm respectively. Pipe is welded to the plate for strong structural joint. Pipe also has a hole of diameter 30mm concentric to the inlet pipe hole. One cylindrical pipe is welded in that hole of length 65mm with inner diameter 20mm which can prevent critical speed of turbine shaft, obviously it is for safety precaution. Figure 7 shows the detention of elbow pipe.
Figure 7Elbow pipe dimensions
3 Bearing Support
Bearing support is supports the bearing which constrain the turbine shaft and only provide one translation and rotation along x-axis.
Bearing supports design according to bearing dimensions. Figure 8 shows the detention of bearing support. Its Outer diameter is 40mm and inner diameter is 20mm. to support the bearing at both end it has 32mm diameter which is the outer diameter of bearing.
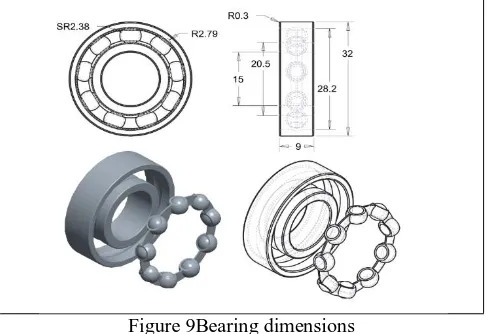
4 Bearings
Two deep grove ball bearing is used for supports made up of stemless steel. It can be used for up to 32000 rpm with outer and inner diameter 15mm and 32mm respectively, thickness 9mm. Figure 9 shows the detention of bearings.
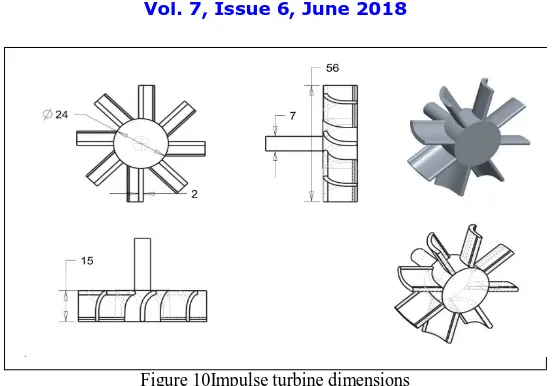
Figure 9Bearing dimensions 5 Impulse Turbine
Turbine dimension and Number of blades
Outer and hub dimension of turbine shroud is decided by considering outlet diameter of turbocharger turbine blades.
i.e. Outer diameter of impulse turbine = Outer diameter of turbocharger turbine D = 0.056 m = 56 mm
Also, Hub diameter of impulse turbine = Hub diameter of turbocharger turbine d = 0.024 m = 24 mm
⸫Blade height = D – d = 0.056 – 0.024 ⸫Blade height = 0.032 m = 32 mm
By taking the blade thickness 2 mm
Total number of blades: -
Number of blades of turboturbine = Number of blades of regenerator turbine Now, Flow area = × – area occupied by blade
And, Area occupied by blade = Thickness of blade × Height of blade × Number of blade 1.818619298 ×10 = × 0.056 – (0.002 ×0.032× Number of blade)
⸫Number of blade= 8.56 ≈ 8 number of blades
Figure 10Impulse turbine dimensions
Above CAD Figure 10 shows the dimensions of impulse turbine. By using CAD
diagram, the actual concept model turbine figure 11 shows the actual we manufacture manufactured part of turbine.
Figure 11 Actual picture of turbine
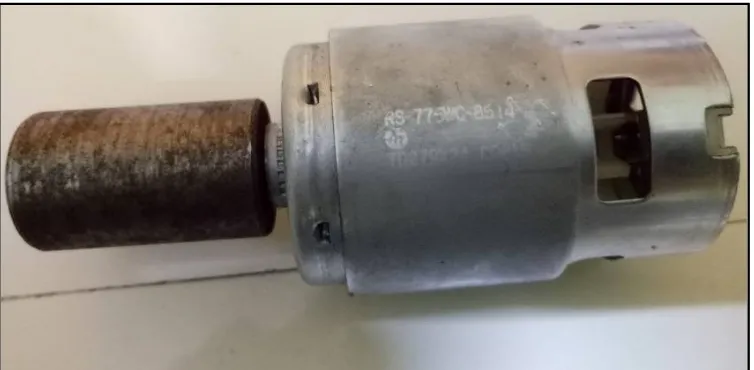
6 Alternator
For calculating actual power of turbine, we refer the following graph we know the current and torque of the generator by using following relationship chart we find the rpm
of the generator figure 13 shows Efficiency, current, speed relationship with torque of motor.
Figure 13Efficiency, current, speed relationship with torque of RS-755WC-8514
For the assembly between rod and alternator we manufacture connector between shaft and alternator. Fix this connector it with the alternator as per shown in figure 14 which is actual picture of alternator.
7 Multimeter
Multimeter is use for measuring the current, voltage and resistance of circuit. Figure 15 show the actual picture of multimeter.
Figure 15Multimeter
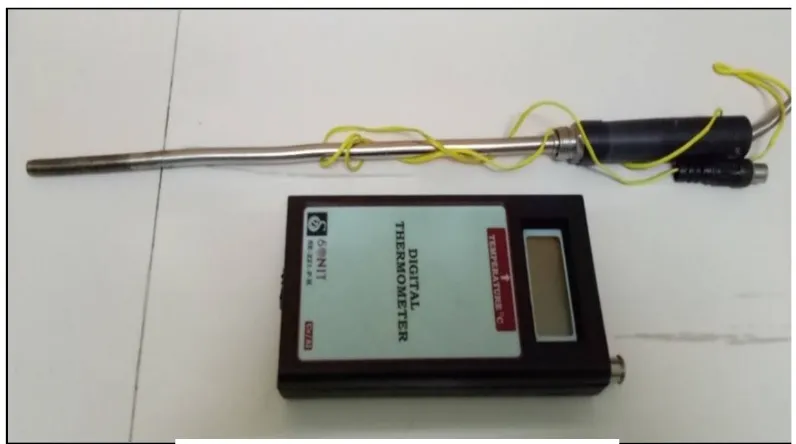
8 Digital Thermometer
By using digital thermometer, we calculate the temperature every 5 minutes for total 20 minutes so the following observation for the temperature we get.
Table1 shows the observation of temperature of exhaust gas.
Sr no. Time(0-5min) Temperature
1 Initial level 89.7 ºC
2 After 5 min 136.4ºC
3 After 10 min 206.7ºC
4 After 15 min 248.5ºC
5 After 20 min 253.2ºC
Table1Observation table of temperature of exhaust gas
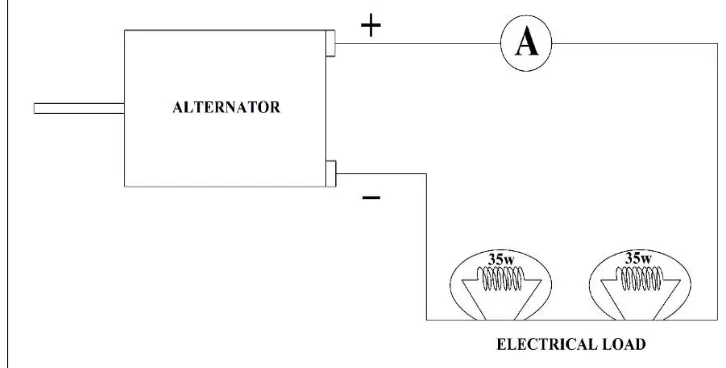
9 Circuit
Hereelectric circuit require to generate load on the alternator. So, we provided two bulbs of 35watt connect it
with the motor and two probes of multimeter. Measured resistance of circuit is 32.5 Ω. Figure 17 shows the circuit diagram.
Figure 17Electric circuit
V. ANALYSIS OF PROJECT
After deciding the design dimensions, it is important to check that design is safe for working environment and working loads. So, following are the CAE and CFD analysis of the component under load.
1 Turbine analysis
For the analysis of turbine, we first perform the CFD (Computational fluid dynamics) on the turbine, from which we get the total pressure and forces on the turbine for static analysis of turbine.
1.1 CFD on turbine
following fig shows the pressure contours over turbine and turbine blade in which the maximum pressure reach on the turbine is up to 35650 Pa.
Figure 18Pressure contours on the turbine
How pressure acts through the overall flow over the blade shown in the following figure 19 which shows pressure contour around the blade of turbine.
Figure 19Pressure contours around the turbine blade
For the velocity over the turbine figure 20 shows the velocity contour over the turbine.
To see the velocity of flow over the turbine blade figure 21 shows velocity contour over the turbine blade.
Figure 21Velocity contours over the turbine blade
After computing we get the following results.
Force on turbine blade = 51.0152 N Max pressure on the turbine blade = 36600.2 Pa Torque on the turbine = 0.852723 Nm Power output of turbine at 5000 rpm = 446.484 J Power output of turbine at 7000 rpm = 625.078 J
Above result we can compare with our result calculated by analytical method and experimental method to validate our work as the concept design work properly. Above parameter like pressure and force on the turbine also use for structural analysis of the turbine. To find out design of turbine is safe or unsafe under the working condition and environment.
1.2 Static structural analysis of turbine
We use the maximum force on the turbine calculated by the CFD analysis for the static structural analysis of turbine.
Following figure 22 shows the boundary conditions we applied on the turbine for the structural analysis of turbine.
Working environmental temperature, we give as 400 ºC. fig 6.6 shows the diagram for given temperature environment for the turbine.
Figure 23Boundary condition applied over the turbine
After applying all the boundary conditions and solving above analysis we get the total deformation of turbine. Figure 24 shows the total deformation for the turbine.
Figure 26Stresses on the turbine blade
1.3 Centrifugal force on the blade of the turbine
Centrifugal force generated to the blades of turbine during rotation of turbine at high rpm. Which creates tensile force on the blade.
Force = ρ A ω2 . . … [6]
Where, ρ = Density of material kg/m3
A = Blade cross-sectional area m2 × number of blade (3.0039 × 10⁻⁵ m2 calculated from Ansys) ω = Rotational velocity = × rad/s
N = Speed rpm
Maximum rpm can be calculated by using blade speed Vb =
× ×
76.9445499 × 0.4849231 = × . × … (48.49% efficiency) N = 12725.18448 rpm
F = 7840 × 3.0039 × 10-5 × 8 × × . × . . F = 4282.396746 N
From force we can find the tensile stress Stress = = .
. ×
Stress = 142561228.6 N/m2 = 142.5612286 N/mm2
Factor of safety Fs =
Where yield stress of Alloy Steel EN24 is 290 N/mm2 at 400º temperature Fs =
.
1.4 Tensile stress in blade on Ansys
Turbine is the most important part of this project and for our design. Which design should be the safest at operating temperature. So, to cross verify above calculation we also analyze the centrifugal force on turbine blade by using Ansys software at static structural type.
Following figure 27 shows the total deformation of the turbine blade under centrifugal force.
Figure 27Total Deformation of blade under tensile load
Following figure 28 shows the Equivalent stress over turbine blade under centrifugal force.
Figure 28Stresses on blade under tensile load
2 Stresses and deformation on plate
Maximum stresses are generated near bolted area because of the overall weight of the project carried by plate. And plate bolted to the outlet of turbocharger. So, this is important to analyse. This checked by using Ansys software where the structural analysis type is used. Following figure 30 shows the equivalent stresses on the plate.
Figure 30Stresses on the plate
Figure 31 shows static structural analysis in which factor of safety of the plate is 2.1406 which make the design is safe.
Figure 31Factor of safety for plate
3 Critical speed of shaft
Figure 32Total deformation of rod under critical speed of shaft
Figure 33 shows transient analysis of shaft in which the Stresses on rod under critical speed of shaft.
Figure 33Stresses on rod under critical speed of shaft
VI.EXPERIMENTAL SETUP
In experimental setup we connect our project setup to the outlet at the turbocharger of TATA 1613 model. As alternator we use DC motor RS-775WC-8514 brush motor from Mabuchi Motors use it as a generator, which motor to generator power conversion factor is 15. This motor connects to the impulse turbine shaft. Between turbine and motor distance maintain as exhaust gases should not affect the generator. To calculate the power output, we measure current from multimeter. For this measurement we design a small circuit which measured resistance is 32.5 Ω which is constant
with respect to time. The experiment is measured on the engine during its ideal condition means no load on the truck engine. Figure 35 shows the actual setup of the project.
Figure 35Experimental setup of project
Figure 36 shows the actual picture of our project model which we had attached to the turbocharger outlet.
1 Experimental readings
Following are the readings of current generated by generator in Ampere. It varies time to time because of pulsating flow of exhaust gas and according to acceleration to the engine.
Following figure 38 shows the reading of resistance in circuit. Resistance is given to the circuit to generate torque to the alternator.
Figure 38Readings of resistance in circuit
2 Calculation of power output using experimental values Observation: -
Resistance (R) = 32.5 Ω
Max Current (I) = 1 A Avg. Current (I) = 0.85 A
Motor to Generator Conversion factor = 15
For power output
Pmax = I2 R = 12 × 32.5 = 32.5 watt
Pavg = I2 R = 0.852 × 32.5 = 23.48125 watt
It will give two values, Motor to Generator Conversion factor is 15 Max power of motor = 487.5 watt
Avg power of motor = 352.21875 watt
So, by using torque of motor we can find rpm. Following relation can be used to find rpm P = × ×
Therefore, while experiment turbine rotates in range of 5127.74 rpm to 7097.22391 rpm. And maximum and average power output is 487.5 watt and 352.2185 watt respectively.
VII. CALCULATION FOR ACTUAL TURBINE EFFICIENCY
For examine the results of this project we use concept model. Which saved lot of money and give fine results. But actual model is different which consist of slightly different turbine design. For actual model we will provide stator blades between turbocharger and impulse turbine. Which will give velocity inlet angle at 30º. So, we will keep blade inlet angle also at 30º angle. Following are the calculation for actual turbine.
1 Calculation for turbine design
For max. efficiency (ɳb-max) = cos2α … [6]
Consider α = 10º
Inlet vel. = Ve = V1=156.2630874 m/sec
Speed ratio (s) = = cosα /2 ⸫Vb = ( ) V1
⸫ Vb = ( ) × 156.2630874 ⸫ Vb = 76.9445499 m/s
1.1 Calculation for inlet velocity triangle
Velocity of flow at inlet is 30º so the inlet angle is taken 30º according to guide blade will be provided in actual model.
i.e. α = θ = 30º
Vw1 = V1cos α = 156.2630874 × cos 30º
Vw1 = 135.3278034 m/s
Vf1 = V1sin α = 156.2630874 × sin 30º
Vf1 = 78.1315437 m/s
CD = Vw1 - Vb = 135.3278034 - 76.9445499
CD = 58.3832531 m/s
Vr1 = + = √78.1315437 + 58.3832531
Vr1 = 97.53533905 m/s
θ= tan-1( )
θ= tan-1( .
. )
θ= 53.23133159º
1.2 Calculation for outlet velocity triangle
For maximum possible degree of outlet angle 30º is selected. Also, Vr1 = Vr2 = 97.53533905 m/s
Vw2 = AB – Vb = 84.46808138 – 76.9445499
Vw2 = 7.523531484 m/s
Vf2 = Vr2 sin ϕ = 97.53533905 × sin 30º
Vf2 = 48.76766953 m/s
β = tan-1 ( ) = tan-1 ( .. )
β = 84.4154º
V2 = = .
.
V2 = 77.31080193 m/s
By using all calculation of inlet and outlet tringle following figure 39 representation of velocity diagram for turbine blade
Figure 39Inlet and Outlet Blade Velocity Tringle For actual turbine
2 For power output of turbine Poutput = m × (Vw1 - Vw2) Vb
Poutput = 0.14713× (135.3278034 – 7.523531484) × 76.9445499
3 For turbine efficiency
ɳimpturb=
. . ɳimpturb= .
.
ɳimpturb=0.8054 = 80.54%
VIII. RESULTS
Maximum power output from concept model at ideal condition = 487.5 watt
Average power output from concept model at ideal condition = 352.21875 watt
Maximum rpm of the turbine of conceptual model at ideal condition = 7097.22391 rpm
Average rpm of the turbine of conceptual model at ideal condition = 5127.74 rpm
Percent of efficiency of actual turbine more than conceptual model is = 80.54 - 48.49 = 32.05 %
Maximum power output actual turbine can produce at ideal condition 487.5 × 0.3205 = 156.24375 watt
⸫ Max power =156.24375 + 487.5
⸫ Max power = 643.74375 watt
Average power output actual turbine can produce at ideal condition 352.21875 × 0.3205 = 112.88610938 watt
⸫ Avg power = 112.88610938 + 352.21875
⸫ Avg power = 465.10485938 watt
CFD results for the turbine power output Power of turbine at 5000rpm = 446.484 watt Power of turbine at 7000rpm = 625.078 watt
IX.CONCLUSION
After completion of this project we concluded that our project can produce maximum power output of 487.5 watt at ideal condition which turbine efficiency is 48.49%. after compare its calculation with actual turbine we found that maximum power output at ideal condition increase up to 643.74375watt as it 80 % efficiently work.
At theoretical calculation concept model and actual model power output are 871.0778329 watt and 1446.853195 watt which is double than the experimental results this is because power losses in 6 mm gap between turbine tip and casing which we keep for safety purpose to avoid critical speed of shaft. And second reason is that experiment is only conducted in ideal condition i.e. when there is no load on engine. When there is load on the engine is more, more amount of fuel is added for combustion which increase the pick pressure inside the engine cylinder results into more amount of kinetic energy after turbocharging. So, it will increase the power output. And to by using actual designed turbine it will easily generate the required amount of electrical energy to charge the battery of automobile vehicles.
By considering above all parameter and results we can save the sufficient amount of energy from exhaust gases which can easily replace the alternator which is directly attached to the engine shaft which can improve the efficiency of engine and Save the exhaust gas waste kinetic energy.
REFERENCES
[1] Vincenzo De Bellis, Silvia Marelli, Fabio Bozza, Massimo Capobianco – “1D simulation and experimental analysis of a turbocharger turbine for automotive engine under steady and unsteady flow conditions”. Energy Procedia 45 (2014), Elsevier, pp. 909-918.
[2] M.H. Padzillah, S. Rajoo, R.F. Martinez- Botas – “Influence of speed and frequency towards the automotive turbocharger turbine performance under pulsating flow condition”. Energy conversion Management 80 (2014), Elsevier, pp. 416-428.
[3] M.S Chiong, A.Romagnoli, A.W Costall – “Non-Adiabatic pressure loss boundary condition for modelling turbo charger turbine pulsating flow”. Energy conversion Management 93 (2015), Elsevier, pp. 267-287.
[4] Phillip Downson, Derrick bauer, Scot laney – “Selection of material and material related process for centrifugal compressor and steam turbine in the oil and petrochemical Industry”. Turbomachinery symposium Vol. 92 (2011), pp. 190-209.
[5] Dr.R.K. Bansal, “Fluid Mechanics and Hydraulic Machinery”, Ninth Edition, laxmi publication (p) ltd. 2014. [6] R.S.Khurmi and J.K.Gupta , “Thermal Engineering”, S.Chand and company pvt. Ltd. 2012.
[7] Hari Singh and Pradeep Kumar – “Mathematical models of tool Life and surface roughness for turning operation through response surface methodology”. Journal of science & research Vol. 66 (2017), pp 220-226.
[8] Natalia Fonseca González, Jesús Casanova Kindelán, José María López Martínez- “Methodology for instantaneous average exhaust gas mass flow rate Measurement”.Case Studies in Thermal Engineering 4 (2014), pp. 99-112.
[9] Shengqiang Bai, Hongliang Lu, Ting Wu, Xianglin Yin, Xun Shi, Lidong Chen – “Numerical and experimental analysis for exhaust heat Exchangers in automobile thermoelectric generators”. Flow Measurement and Instrumentation 49 (2016), pp. 52-62.