| INVESTIGATION
Sharing of Genes and Pathways Across Complex
Phenotypes: A Multilevel Genome-Wide Analysis
Hongsheng Gui,*,†,1Johnny S. Kwan,‡,1Pak C. Sham,*,‡,§Stacey S. Cherny,*,‡,§,2and Miaoxin Li*,‡,**,2 *Center for Genomic Sciences,‡Department of Psychiatry, and§The State Key Laboratory of Brain and Cognitive Sciences, University of Hong Kong, Hong Kong, SAR, China,†Center for Health Policy and Health Services Research, Henry Ford Health System, Detroit, Michigan 48202, and **Department of Medical Genetics, Center for Genome Research, Zhongshan School of Medicine, Sun Yat-sen University, Guangzhou, 510275 China ORCID ID: 0000-0002-0460-7446 (H.G.)
ABSTRACTEvidence from genome-wide association studies (GWAS) suggest that pleiotropic effects on human complex phenotypes are very common. Recently, an atlas of genetic correlations among complex phenotypes has broadened our understanding of human diseases and traits. Here, we examine genetic overlap, from a gene-centric perspective, among the same 24 phenotypes previously investigated for genetic correlations. After adopting the multilevel pipeline (freely available athttp://grass.cgs.hku.hk/limx/kgg/), which includes intragenic single nucleotide polymorphisms (SNPs), genes, and gene-sets, to estimate genetic similarities across phenotypes, a large amount of sharing of several biologically related phenotypes was confirmed. In addition, significant genetic overlaps were also found among phenotype pairs that were previously unidentified by SNP-level approaches. All these pairs with new genetic links are supported by earlier epidemiological evidence, although only a few of them have pleiotropic genes in the GWAS Catalog. Hence, our gene and gene-set analyses are able to provide new insights into cross-phenotype connections. The investigation on genetic sharing at three different levels presents a complementary picture of how common DNA sequence variations contribute to disease comorbidities and trait manifestations.
KEYWORDSGWAS; gene-based; complex diseases; genetic sharing; pleiotropy
G
ENOME-WIDE association studies (GWAS) fall short ofexplaining most phenotype heritability, and their reported intergenic hits usually cannot link clearly to biological function (Manolioet al.2009; Soet al.2011). Nevertheless, the ever-increasing numbers of GWAS datasets actually pro-vide a rich resource for conducting secondary analyses, such as meta-analysis, epistasis analysis, and gene/gene-set anal-ysis (Cantoret al.2010; Califanoet al.2012). These analyses are capable of uncovering small-to-moderate genetic ef-fects hidden in previous GWAS by increasing sample size or leveraging external knowledge, for instance, genes or
biolog-ical pathways, protein–protein interaction networks (Liet al. 2012a), as well as DNA regulatory machinery elements (Barabasiet al.2011). Since common associated SNPs with moderate effect on complex phenotypes tend to cluster in the same gene, or set of genes, that exert the same key biological function, gene and gene-set analyses tend to in-crease power (Ramanan et al.2012). Such analyses have been applied successfully to several complex phenotypes, and have led to the discovery of additional disease-gene connections (Eleftherohorinou et al. 2009; Chen et al. 2010; O’Dushlaineet al.2011; Chenet al.2014).
More recently, pleiotropic effects and cross-phenotype (CP) associations have been identified by joint analysis of GWAS findings or resources from multiple phenotypes (Solovieff et al.2013). Pleiotropy occurs when a gene or genetic variant affects.1 phenotypic trait, and is gradually gaining recognition as a universal property of genetic var-iants contributing to human phenotypic variation (Solovieff et al.2013; Gratten and Visscher 2016). In an even broader manner, pleiotropy could be explained by single variants or multiple variants in a gene, region, or pathway, or multiple Copyright © 2017 by the Genetics Society of America
doi:https://doi.org/10.1534/genetics.116.198150
Manuscript received November 10, 2016; accepted for publication April 20, 2017; published Early Online May 8, 2017.
Supplemental material is available online atwww.genetics.org/lookup/suppl/doi:10. 1534/genetics.116.198150/-/DC1.
1These authors contributed equally to this work.
2Corresponding authors: Centre for Genomic Sciences, The Hong Kong Jockey Club
associations scattered through the genome. So far, 4.6% of SNPs and 16.9% of genes have been observed to be associ-ated with .1 trait in the GWAS Catalog (Welter et al. 2014). Risk score profiling and coheritability estimation revealed non-negligible genome-wide sharing across neu-ropsychiatric diseases (International Schizophrenia Con-sortium 2009; Cross-Disorder Group of the Psychiatric Genomics Consortium 2013). Recently, an atlas of genetic correlation across human complex diseases and traits has been provided in a study by Bulik-Sullivanet al.(2015), which revealed several correlated phenotype pairs that had never been identified before. However, relatively few individual SNPs or genes have been associated with those pairs of genetically correlated phenotypes (Cross-Disorder Group of the Psychiatric Genomics Consortium 2013; Parkes et al. 2013). GWAS gene/gene-set analyses may have the potential to identify more susceptibility genes or pathways that contribute to multiple genetically comor-bid or correlated phenotypes (Zhernakova et al. 2009; Solovieffet al.2013).
Hence, in this study, we utilized our previously devel-oped gene-based approach, GATES (Liet al.2011), and its extension on a pathway level, to identify genetic associa-tions shared among complex phenotypes. In addition, we compared the genetic sharing revealed at gene or gene-set levels to that inferred from individual SNP association and overall genetic correlations so as to determine what additional knowledge could be gained from gene-centric approaches.
Materials and Methods
Real data resources
We included the same 24 phenotypes (full names and ab-breviations listed in Table 1; detailed information given in Supplemental Material,Table S1and Text S3 inFile S1) as used in Bulik-Sullivanet al.(2015) These phenotypes are all complex traits or diseases for which large-scale GWAS meta-analyses have been done on Caucasian populations.
Raw data (GWAS summary statistics) were downloaded, and thenfiltered by the script“munge_sumstats.py”provided by linkage disequilibrium score (LDSC) online resource (https://github.com/bulik/ldsc/wiki). In brief, variants not covered by the HapMap3 panel, with the estimated imputa-tion“info”score,0.9 if imputed, with mislabeled reference/ alternative alleles, with extreme P-values (.1, or #0), or with small effective sample size (,0.67 times the 90th per-centile of sample size) were excluded in following analyses. After thisfiltering, all 24 datasets contain similar amount of SNPs (1 million per phenotype;Table S1) as inputs for the following gene-wise analyses.
Gene and gene-set mapping
SNPs passing abovefiltering were mapped to genes (defined by UCSC human RefGene database) when located within a gene, or within a region of 10 kb up or downstream of the gene, according to their coordinates from human genome build 19 (hg19). In addition, to prevent our gene/gene-set results from being mainly driven by genetic variations in the
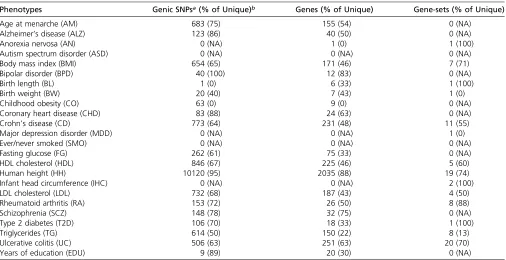
Table 1 Summary of associated genic SNPs, genes and gene-sets per phenotype
Phenotypes Genic SNPsa(% of Unique)b Genes (% of Unique) Gene-sets (% of Unique)
Age at menarche (AM) 683 (75) 155 (54) 0 (NA)
Alzheimer’s disease (ALZ) 123 (86) 40 (50) 0 (NA)
Anorexia nervosa (AN) 0 (NA) 1 (0) 1 (100)
Autism spectrum disorder (ASD) 0 (NA) 0 (NA) 0 (NA)
Body mass index (BMI) 654 (65) 171 (46) 7 (71)
Bipolar disorder (BPD) 40 (100) 12 (83) 0 (NA)
Birth length (BL) 1 (0) 6 (33) 1 (100)
Birth weight (BW) 20 (40) 7 (43) 1 (0)
Childhood obesity (CO) 63 (0) 9 (0) 0 (NA)
Coronary heart disease (CHD) 83 (88) 24 (63) 0 (NA)
Crohn’s disease (CD) 773 (64) 231 (48) 11 (55)
Major depression disorder (MDD) 0 (NA) 0 (NA) 1 (0)
Ever/never smoked (SMO) 0 (NA) 0 (NA) 0 (NA)
Fasting glucose (FG) 262 (61) 75 (33) 0 (NA)
HDL cholesterol (HDL) 846 (67) 225 (46) 5 (60)
Human height (HH) 10120 (95) 2035 (88) 19 (74)
Infant head circumference (IHC) 0 (NA) 0 (NA) 2 (100)
LDL cholesterol (LDL) 732 (68) 187 (43) 4 (50)
Rheumatoid arthritis (RA) 153 (72) 26 (50) 8 (88)
Schizophrenia (SCZ) 148 (78) 32 (75) 0 (NA)
Type 2 diabetes (T2D) 106 (70) 18 (33) 1 (100)
Triglycerides (TG) 614 (50) 150 (22) 8 (13)
Ulcerative colitis (UC) 506 (63) 251 (63) 20 (70)
Years of education (EDU) 9 (89) 20 (30) 0 (NA)
aOnly SNPs, genes, or gene-sets withP-value significant after Bonferroni correction were counted. Average numbers of genic SNPs, genes, and gene-sets being tested are
583619, 23616, and 2653, respectively.
extended major histocompatibility complex (MHC) region (Chr6: 27.533.5 Mb), we only considered non-MHC genic SNPs in all our subsequent analyses. After this mapping, on average, 581,619 genic SNPs were retained and mapped to 23,616 human genes (Table S1).
Various of gene-sets were collected from Molecular Signatures Database version 5.0 (MsigDB; http://software. broadinstitute.org/gsea/msigdb/index.jsp), which included 1330 canonical pathways, and 1454 Gene Ontology gene-sets. After restricting gene-set size at 5–300 genes, a total of 2660 sets that cover 10,483 unique human reference genes was retained. To estimate crosstalk effects between different gene-sets, Jac-card distance (JD) was calculated for each pair of gene-sets by formula A\B/A[B, while A and B are the sizes of gene-sets in terms of gene counts. Gene-sets with Jaccard distance,0.2 are treated as independent sets (Jiaet al.2011; Donatoet al.2013), which includes in total 979 different gene-sets.
Linkage disequilibrium attenuated rank-sum test (LDRT)
We developed a new gene-set-based association test, LDRT, to combine gene-levelP-value statistics calculated from our pre-vious gene-based association test, GATES (Liet al.2011), into gene-sets. Under a competitive null hypothesis for a given gene-set (Guiet al.2011), we assume that GATESP-values for genes in this gene-set follow the same distribution as P-values for all other genes in the genome. A nonparametric Wilcoxon rank-sum test was then used to examine whether the given set of genes was more highly ranked in an ordered list of all genes than would be expected by chance. When multiple genes within a gene set were on the same chromo-some, we sorted these genes according to their gene-based P-values and checked the LD between the GATES key SNPs of the genes. If two key SNPs from two different genes were in high LD (r2 . 0.5 as default setting), the key SNP in the
gene with largerP-value were removed. After removing all redundant key SNPs, the gene-basedP-values were recalcu-lated by GATES. Hence the new gene-based P-values were nearly independent of each other, and can be used in a Wilcoxon rank-sum test for gene-set association analysis. A recent powerful approach,“MAGMA,”that also handles polygenic traits was chosen for comparison (de Leeuwet al. 2015) with LDRT (Text S1 and Figure S1 inFile S1), using the same SNP-level summary statistics and gene-set data-base as input.
Intraphenotype genetic association
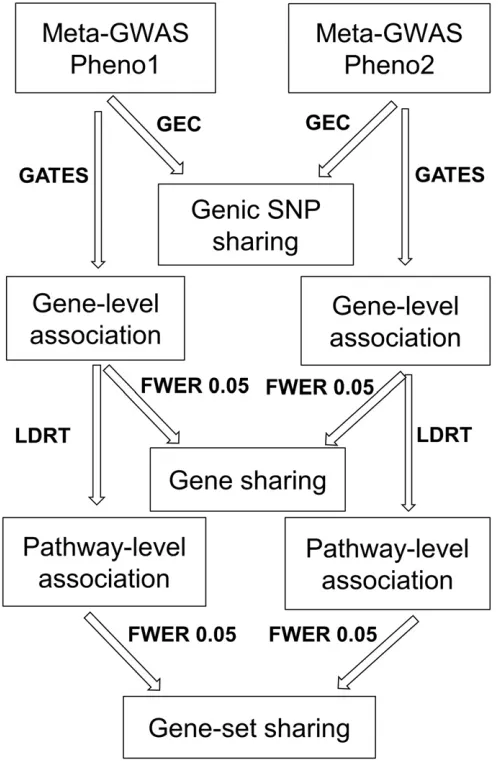
We identified three levels of genetic associations with biolog-ical interest: genic SNPs, genes, and gene-sets. The complete multilevel pipeline was illustrated as shown in Figure 1.
Genic SNP level: Using the 1000 Genome Caucasian (CEU) population as the LD reference, the Genetic type I error calculator (GEC) was used to estimate the effective number (N1) of genic SNPs across genome (Liet al.2012b), and then to determine the significance cut-off at family wise error rate 0.05 (Bonferroni correction). Genic SNPs withP-values
smaller than the cut-off (0.05/N1; N1 = 272,852) were se-lected for each phenotype.
Gene level:For a given gene, its SNP-level summary statistics were combined to generate gene-basedP-value using GATES (Liet al.2011), which adjusts correlations among neighbor-ing markers by considerneighbor-ing the LD structure in 1000 Genomes CEU population. Genes with GATESP-values significant after Bonferroni correction (0.05/N2; N2 = number of genes with$1 SNPs, with mean at 23,616) were retained for each phenotype.
Gene-set level: For each gene-set containing$5 genes with nonmissing GATESP-values, LDRT was adopted to conduct
gene-set-based association for each phenotype, with the same 1000 Genome CEU population to correct for LD be-tween genes in the same gene set. Gene-sets with LDRT P-values below 0.05/N3 (N3 = 979 number of independent gene-sets with JD , 0.2) were declared significant, which controlled the same family-wise error rate as that for genic SNPs or genes.
The protocol of running KGG software for above gene/ gene-set association is provided in Text S2 ofFile S1.
Interphenotype genetic sharing
The genetic similarity between a pair of phenotypes was then estimated by counting the number of overlapping genic SNPs, genes or gene-sets that were significantly associated with each member of the pair in the abovementioned genetic associa-tion analysis. We performed hypergeometric tests to calcu-late P-values of the overlap at each level using R function “1-phyper(k-1, K, N-K, n)” when k $ 1, or “dhyper(k, K, N-K,n)”whenk = 0, with four parameters N,K,n, andk corresponding to total count (N, referring toN1,N2, orN3 in the sectionGene-set levelabove), count of significant items in phenotype 1 (K), count of significant items in phenotype 2 (n), and count of overlapping items (k), respectively. False discovery rate (FDR) was set at 5% to define significance so as to correct for multiple testing in 276 pairs of phenotypes. Specifically, a two-step approach was adopted to evaluate gene-level sharing given the existence of LD dependency between genes (de Leeuwet al.2015). First, the overlapping genes between any pair of phenotypes were tested against hypergeometric distribution, with observed gene counts for each phenotype and their overlap. For phenotype pairs with significant gene-overlap at the first step, their gene counts were recalculated after merging those with genetic distance,1 cM; accordingly, hypergeometric test and FDR was used to examine the significance of the new counts. Only phenotype pairs with significant overlapping (FDR, 0.05) at both steps were considered with gene-level sharing.
To compare cross-phenotype patterns from above genetic sharing with that from previous genetic correlation on the same 24 phenotypes, we retrieved the pairwise genetic correlation coefficients (denoted as r), and corresponding P-values computed by LDSC from Bulik-Sullivan et al. (2015). The same FDR threshold (5%) was used to define nonzero genetic correlation for each pair of phenotypes. In addition, we performed an average linkage hierarchical cluster analysis of those 24 phenotypes using 12r2as the
distance measure. Cross-phenotype genetic sharing at gene/gene-set levels was projected on these clusters to examine how they distributed within or across different phenotype clusters.
GWAS catalog replication
To provide biological interpretations for overall cross-pheno-type patterns we observed, the shared SNPs, genes, or gene-sets underlying phenotypes with significant genetic sharing were scrutinized for representative functional genes. To that
end, genes carrying significant shared intragenic SNPs, sig-nificant shared genes, and genes with GATESP-value,0.05 in significant shared gene-sets, were extracted and cross-checked for replication evidence in GWAS Catalog. GWAS findings (in terms of genes) for 24 studied phenotypes were collected from GWAS Catalog in November 2015 (Welter et al. 2014). Susceptibility genes for each phenotype were recorded only if the gene (610 kb) contains$1 SNP reported withP-value,5 3 1028in at least one Caucasian population.
The intersections of reported gene lists for the corresponding 24 phenotypes were assessed to look up genes with pleiotro-pic effects, and their overlapping was also evaluated by the same hypergeometric tests as previously stated.
Data availability
GWASP-values analyzed here can be accessed at the URLs given in Table S1. KGG software that implemented GATES and LDRT is available online at the following URL:http:// grass.cgs.hku.hk/limx/kgg/. GEC software is available online at URL:http://grass.cgs.hku.hk/gec/.
Results
Multilevel survey per phenotype
Total numbers of identified significant genic SNPs, genes, and gene-sets for each phenotype are shown in Table 1. Only ASD and SMO have no genetic risk factors found at all three levels. Human height (HH) is associated with 10,120 SNPs, 2035 genes, and 19 gene-sets, having more associations than any of the other 23 phenotypes. With respect to gene-set association, the results of our LDRT approach overlap sig-nificantly with the results of the MAGMA (Table S2 and Table S3 in File S1). Numbers of identified SNPs, genes, and gene-sets are significantly correlated across phenotypes (Spearman correlation coefficients for SNP/gene, gene/ gene-set and SNP/gene-set at 0.96, 0.51, and 0.5, respec-tively; Bonferroni corrected P-values ,0.05). Apparently, far fewer gene-sets are identified than SNPs or genes, even for those phenotypes with relatively large number of signif-icant SNPs or genes (e.g., SCZ, CHD, ALZ, and FG). As expected, when considering genetic associations (SNP, gene, or gene-set) that are unique to any of the 24 phenotypes, we find a smaller proportion of associated genes than the propor-tion of associated SNPs (one-sided paired Wilcoxon rank-sum testP-value,0.05; Table 1).
Genetic sharing across phenotypes
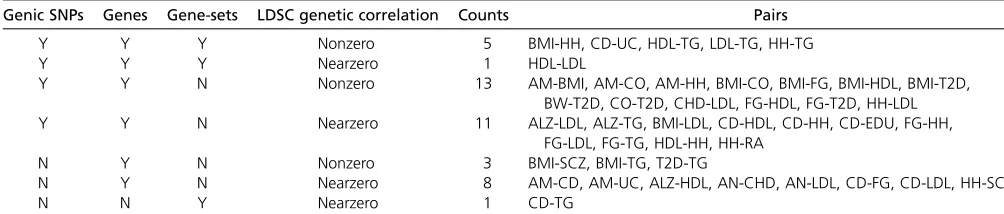
18 different phenotypes, are found to have significant higher amount of overlapping genes or gene-sets. In order to compare thesefindings to SNP-based evidence, the pat-terns of cross-phenotype sharing are tabulated, as shown in Table 3. Accordingly, four cross-phenotype patterns (Y-Y-Y, Y-Y-N, N-Y-N, and N-N-Y;“Y”or“N”for share or not share at the genic SNP, gene, or gene-set level, respectively) are observed when considering all three levels of sharing. Gene/gene-set analyses provide significant genetic shar-ing for 12 out of 42 pairs that are not detected by genic SNP analysis (Table 3). When comparing with pairwise genetic correlation from Bulik-Sullivan et al. (2015), our cross-phenotype analyses identify fewer pairs with close ge-netic relationship (42 vs. 74; one-sided Fisher exact test P-value,0.01); however, it is more likely to identify signif-icant gene or gene-set sharing among those phenotypes with nonzero genetic correlation than those with nearzero genetic correlation (21/74 vs. 21/202, one-sided Fisher exact testP-value,0.001).
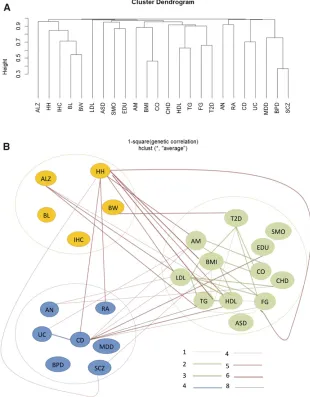
On the basis of reported genetic correlations in the study of Bulik-Sullivan et al. (2015), three big phenotype clusters were formed (Figure 2A). The clusters are largely consistent with the EBI ontology classification included in Table S1: with cluster 1 containing anthropometric traits, cluster 2 containing cardiometabolic traits or diseases, and cluster 3 containing autoimmune or psychiatric diseases. To further demonstrate how multiple phenotypes ($3) related to each other through genetic sharing, a network was constructed to connect those phenotypes from the same or different clus-ters, with edges representing significant molecular sharing
at different levels (Figure 2B). Overall, genetic sharing for phenotypes within the same cluster is significantly higher than sharing across clusters (Fisher exact test P-value ,0.001). Interestingly, traits or diseases within the same cluster (e.g., CD-UC and HDL-LDL-TG) tend to share genetic hits at all three levels; however, those from different clusters (e.g., CD-TG and HH-SCZ) are more prone to have sharing at advanced level only (genes or gene-sets). Moreover, pheno-type pairs prioritized by both our pipeline and LDSC genetic correlation are mainly from within-category phenotypes (15 out of 21 pairs), while those pairs found only by our pipeline are more likely from cross-category phenotypes (17 out of 21 pairs). Noticeably, among all 42 phenotype connections, 25 are comprised by those seven cardiometa-bolic traits (HDL, LDL, TG, FG, T2D, CO, and CHD) and/or five anthropometrical measurements (BMI, HH, IHC, BL, and BW) that have apparent epidemiological correlation (Sorensen et al.1999) or clinical comorbidity. Their closer relationships have also been detected by cross-phenotype ge-netic correlations, GWAS Catalog overlapping analyses, and several previous lines of evidence showing their genetic in-terconnections (Global Lipids Genetics et al. 2013; Locke et al.2015).
Annotation for cross-phenotype patterns
All 12 phenotype pairs with significantly shared genes or gene-sets but not genic SNPs were further annotated by epidemi-ology literature, LDSC genetic correlation, and GWAS Catalog (Table 4). All these novel pairs we found have epidemiolog-ical evidence supporting their relationship (Bregenzeret al.
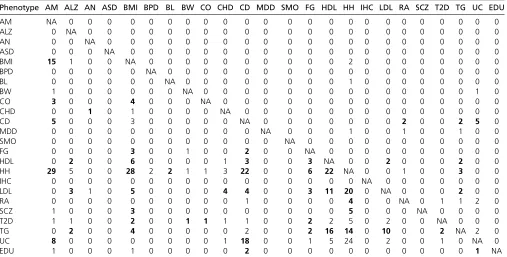
Table 2 Cross-phenotype gene and gene-set sharing
Phenotype AM ALZ AN ASD BMI BPD BL BW CO CHD CD MDD SMO FG HDL HH IHC LDL RA SCZ T2D TG UC EDU
AM NA 0 0 0 0 0 0 0 0 0 0 0 0 0 0 0 0 0 0 0 0 0 0 0
ALZ 0 NA 0 0 0 0 0 0 0 0 0 0 0 0 0 0 0 0 0 0 0 0 0 0
AN 0 0 NA 0 0 0 0 0 0 0 0 0 0 0 0 0 0 0 0 0 0 0 0 0
ASD 0 0 0 NA 0 0 0 0 0 0 0 0 0 0 0 0 0 0 0 0 0 0 0 0
BMI 15 1 0 0 NA 0 0 0 0 0 0 0 0 0 0 2 0 0 0 0 0 0 0 0
BPD 0 0 0 0 0 NA 0 0 0 0 0 0 0 0 0 0 0 0 0 0 0 0 0 0
BL 0 0 0 0 0 0 NA 0 0 0 0 0 0 0 0 1 0 0 0 0 0 0 0 0
BW 1 0 0 0 0 0 0 NA 0 0 0 0 0 0 0 0 0 0 0 0 0 0 1 0
CO 3 0 0 0 4 0 0 0 NA 0 0 0 0 0 0 0 0 0 0 0 0 0 0 0
CHD 0 0 1 0 1 0 0 0 0 NA 0 0 0 0 0 0 0 0 0 0 0 0 0 0
CD 5 0 0 0 3 0 0 0 0 0 NA 0 0 0 0 0 0 0 2 0 0 2 5 0
MDD 0 0 0 0 0 0 0 0 0 0 0 NA 0 0 0 1 0 0 1 0 0 1 0 0
SMO 0 0 0 0 0 0 0 0 0 0 0 0 NA 0 0 0 0 0 0 0 0 0 0 0
FG 0 0 0 0 3 0 0 1 0 0 2 0 0 NA 0 0 0 0 0 0 0 0 0 0
HDL 0 2 0 0 6 0 0 0 0 1 3 0 0 3 NA 0 0 2 0 0 0 2 0 0
HH 29 5 0 0 28 2 2 1 1 3 22 0 0 6 22 NA 0 0 1 0 0 3 0 0
IHC 0 0 0 0 0 0 0 0 0 0 0 0 0 0 0 0 NA 0 0 0 0 0 0 0
LDL 0 3 1 0 5 0 0 0 0 4 4 0 0 3 11 20 0 NA 0 0 0 2 0 0
RA 0 0 0 0 0 0 0 0 0 0 1 0 0 0 0 4 0 0 NA 0 1 1 2 0
SCZ 1 0 0 0 3 0 0 0 0 0 0 0 0 0 0 5 0 0 0 NA 0 0 0 0
T2D 1 1 0 0 2 0 0 1 1 1 1 0 0 2 2 5 0 2 0 0 NA 0 0 0
TG 0 2 0 0 4 0 0 0 0 0 2 0 0 2 16 14 0 10 0 0 2 NA 2 0
UC 8 0 0 0 0 0 0 0 0 1 18 0 0 1 5 24 0 2 0 0 1 0 NA 0
EDU 1 0 0 0 1 0 0 0 0 0 2 0 0 0 0 0 0 0 0 0 0 0 1 NA
2006; Zammitet al.2007; Lockeet al.2015). Among them, three pairs had significant genetic correlations in Bulik-Sullivan et al. (2015), and two other pairs had enriched overlapping genes in GWAS Catalog database. When zooming into the genes underlying these 12 phenotype pairs, a list of 62 different genes was generated (Table S5 in File S1). Among them, 33 genes contribute to two pairs of phenotypes, showing they are involved in three or four unique phenotypes. However, most of those implicated (51 out of 62) have already been reported as pleiotropic genes to the studied 24 phenotypes in the GWAS Catalog. Except two well-known genes from ALZ-HDL (TOMM40/APOC1in Table 4), the remaining nine genes were reported as pleiotropic but for different phenotype pairs (Table S5 inFile S1). Further larger-scale cross-phenotype GWAS stud-ies are needed to confirm their importance in our reported pairs.
Discussion
Our study follows up the recent report (Bulik-Sullivanet al. 2015) on genetic correlations among complex phenotypes by focusing on genic variants of those phenotypes. We demon-strate that gene and gene-set analysis may provide new in-sights on cross-phenotype connections through integration of three complementary analyses that involved SNPs, genes, and gene-sets on the same dataset. The complete investiga-tion on genetic sharing enables us to form a better picture of how common biological elements contribute to disease comorbidities and trait manifestations.
Genetic correlations that reflect genetic relationship between different phenotypes can be estimated by earlier family-based study design in behavior genetics, whole genome-wide SNP genotypes, and, most recently, GWAS summary statistics (Gratten and Visscher 2016). The potential causes can be as-cribed to real biological pleiotropy, mediated phenotype path-ways, genetic heterogeneity and spurious bias from study designs (shared controls or ascertainment bias) (Solovieff et al. 2013). Our estimation of the genetic overlaps at three different levels, using GWAS summary statistics only, reflects a portion of overall biological pleiotropy among multiple pheno-types, hence provides only partial explanation to the genetic correlation observed in Bulik-Sullivanet al.(2015). In contrast to previous cross-phenotype genetic evidence from overall coheritability or genetic correlation estimations (International Schizophrenia Consortium 2009; Cross-Disorder Group of the
Psychiatric Genomics Consortium 2013; Parkes et al. 2013), our study gives more specific biological clues (in terms of genes and pathways) to shared disease etiologies. Though joint GWAS analyses across multiple phenotypes have enabled find-ing susceptibility loci, genes, and gene-sets that affect different related phenotypes (Ramanan and Saykin 2013; Network and Pathway Analysis Subgroup of Psychiatric Genomics Consortium 2015), all of these studies employed close-related phenotypes in the same disease category, for instance, psychi-atric disorders and autoimmune disorders. Inspired by the find-ings of Bulik-Sullivanet al.(2015),i.e., that widespread and unexpected genetic correlation exists across 24 phenotypes with different pathogenicity mechanism, our multilevel gene-centric pipeline has confirmed significant genetic sharing for those well-connected phenotypes pairs (lipid traits and inflam-matory bowel diseases) (Leeset al.2011; Global Lipids Genet-ics et al. 2013); more importantly, our analyses gave new insights on how these phenotypes link to each other through genetics. This new knowledge gained from our systematic adoption of gene/gene-set approaches provides a new perspec-tive to explain complex disease etiologies (Elberset al.2009; Manolioet al.2009; Solovieffet al.2013). Usually for polygenic traits that involve many genetic hits with small effect size, disease connections could be due mainly to contribution of multiple different SNPs in one gene or multiple genes in a gene-set. Under this scenario, the advantage of our GWAS gene or gene-set analyses, which combine original SNPs with mar-ginal statistical evidence in the same biological unit, are expected to be fully expressed (Wang et al.2010; Ramanan et al.2012). In addition, our new gene-set association approach “LDRT,”adopting a cut-off free competitive test (de Leeuwet al. 2016), can analyze all genic SNPs together, and hence provide additional information that may lose in traditional gene-set enrichment analyses as implemented in DEPICT (Pers et al. 2015), from which we observed unbalanced numbers (ranging from 0 to 927) of significant gene-sets within each phenotype and only significant sharing between HDL and TG, or CD and RA across those 24 phenotypes (Table S6 inFile S1).
On the other hand, our pipeline has generated a few un-expected results. We are missing some well-known genetically correlated phenotypes in psychiatric diseases (such as SCZ-BPD and AN-SCZ) (International Schizophrenia Consortium et al.2009; Bulik-Sullivan et al. 2015). This could be due to information loss when retrieving only genic SNPs (see
Table 3 Comparison of multilevel genetic sharing and correlation
Genic SNPs Genes Gene-sets LDSC genetic correlation Counts Pairs
Y Y Y Nonzero 5 BMI-HH, CD-UC, HDL-TG, LDL-TG, HH-TG
Y Y Y Nearzero 1 HDL-LDL
Y Y N Nonzero 13 AM-BMI, AM-CO, AM-HH, BMI-CO, BMI-FG, BMI-HDL, BMI-T2D, BW-T2D, CO-T2D, CHD-LDL, FG-HDL, FG-T2D, HH-LDL Y Y N Nearzero 11 ALZ-LDL, ALZ-TG, BMI-LDL, CD-HDL, CD-HH, CD-EDU, FG-HH,
FG-LDL, FG-TG, HDL-HH, HH-RA
N Y N Nonzero 3 BMI-SCZ, BMI-TG, T2D-TG
N Y N Nearzero 8 AM-CD, AM-UC, ALZ-HDL, AN-CHD, AN-LDL, CD-FG, CD-LDL, HH-SCZ
N N Y Nearzero 1 CD-TG
Table S2 in File S1for details) from overall genome-wide association studies, which contained more noncoding vari-ants important to both phenotypes at a regulation or epige-netic level (Tsankovaet al.2007; Mauranoet al.2012). The
missing of other correlated phenotypes can be ascribed to false negative factors in our pipeline, including too stringent a cut-off for selecting significant genes or gene-sets, limited numbers of pathways used, and incomplete coverage of
Table 4 Annotation of 12 novel phenotype pairs
Phenotype pair Total genes (levels)a Epidemiological evidence LDSC evidenceb Catalog evidencesc
ALZ-HDL 3 (Gene) Casserly and Topol (2004) F; across clusters 6*;TOMM40,APOC1
AN-CHD 1 (Gene) Casiero and Frishman (2006) F; across clusters 0; NA
AN-LDL 1 (Gene) Weinbrenneret al.(2004) F; across clusters 0; NA
AM-CD 18 (Gene) Ballingeret al.(2003) F; across clusters 1; 0
AM-UC 24 (Gene) Ballingeret al.(2003) F; across clusters 2; 0
BMI-SCZ 6 (Gene) Zammitet al.(2007) T; across clusters 2; 0
BMI-TG 11 (Gene) Lockeet al.(2015) T; within cluster 1; 0
CD-FG 5 (Gene) Bregenzeret al.(2006) F; across clusters 1; 0
CD-LDL 8 (Gene) Agouridiset al.(2011) F; across clusters 1; 0
CD-TG 8 (Gene-set) Agouridiset al.(2011) F; across clusters 2; 0
HH-SCZ 8 (Gene) Zammitet al.(2007) F; across clusters 9*; 0
T2D-TG 2 (Gene) Lockeet al.(2015) T; within cluster 1; 0
aGene-sets was considered by counting genes in gene-sets with GATESP,0.05; cells with gene-set sharing were underscored. bF, for near-zero genetic correlation; T, for nonzero genetic correlation; within clusters or cross clusters was given in Figure 2.
cOverlapping genes were counted from GWAS Catalog reported genes for each phenotype pair, with“*”showing significance after multiple testing; only hits replicated at
both phenotypes in Catalog were given. NA, not applicable.
Figure 2 Cross-phenotype clustering and linking. Phenotypes were clustered and linked according to different levels of sharing: (A) hierarchical clustering of phenotypes with genetic correlation (r) as distance measurement (12r2). (B) phenotypes were connected
human genes in the gene-set collection. In addition, we re-port a few phenotype pairs that have inconsistent evidence from LDSC genetic correlation analyses or the GWAS Cata-log record. Though they are subjected to possible false pos-itives arising from our methodology (insufficient correction of gene-level dependence), there are other explanations for this inconsistency. Some phenotype pairs (for instance HDL– LDL) originated from the difference on how to handle effect direction at SNP level—LDSC correlation considered both positive and negative effects (Bulik-Sullivan et al. 2015), but we treat them equally with no signs. For the newly found seven pairs of phenotype: the link between AM and inflammatory bowel diseases (CD and UC) have been estab-lished previously through epidemiological survey (Ballinger et al.2003), hormone change (Khaliliet al.2012), or can-didate gene study (Yanget al.2007). CD-LDL and CD-TG have also been reported with significant genetic sharing by another study using a different approach (Andreassen et al. 2015), while CD-FG may also reflect the connection between inflam-mation and metabolic traits; AN-CHD and AN-LDL sharing were driven by the same ABO gene, which was recently reported as an important element to multiple phenotypes (Pickrell et al.2015). These connections may have not been captured by genetic correlation analyses, and wait confirmation by future cross-phenotypefindings in GWAS Catalog.
The effectiveness and new perspective provided from our GWAS gene or gene-set investigation can serve as proof-of-principle for future cross phenotype studies. Genetic sharing among those 24 phenotypes provided new clues that a com-bination of gene-wise P-values of two related disorders, or even distinct two types of diseases or traits, could greatly increase power for susceptibility gene identification (Barabasiet al.2011; Ramanan and Saykin 2013). Since only summary statistics are needed, our gene or gene-set analyses can easily extend to rare variants from next generation se-quencing (Cirulli and Goldstein 2010; Gudbjartsson et al. 2015), which would generate another set of gene-level sum-mary statistics that can be combined with those from common variants targeted by GWAS (Curtis 2012; Luo et al. 2012). Without doubt, more genetic knowledge on complex disorders will be gained when adopting this strategy on larger-scale datasets in the future. Ultimately, advanced gene/gene-set analyses based on complete variant-level information will play a key role in precision medicine by providing biological guidance on drug development and clinical diagnosis for one disease, or one category of diseases (Barabasi et al. 2011; Ramanan and Saykin 2013; Solovieffet al.2013).
Acknowledgments
We acknowledge Lambert et al., Boraska et al., Stahl et al., Jostins et al., Locke et al., van der Valk et al., Horikoshi et al., Woodet al., Taalet al., Bradfieldet al., Schunkertet al., Manninget al., Teslovichet al., Morriset al., Perryet al., Rietveld et al.(see Text S3 for a detailed reference list), International Inflammatory Bowel Disease Genetics Consortium, Psychiatric
Genomics Consortium, GIANT Consortium, EGG Consortium, DIAGRAM Consortium, TAG Consortium, IGAP Consortium, and the Abecasis laboratory at the University of Michigan, who publish and make their GWAS summary statistics available online for public usage. We thank Christiaan de Leeuw for help running MAGMA, the anonymous reviewer for running DEPICT, and Benjamin Neale for insightful comments on LDSC analyses for genetic correlation. This research is funded by two Health and Medical Research Fund (HMRF) grants from the Food and Health Bureau of the Hong Kong SAR Government (HMRF 02132236 and HMRF 01121436to M.L.) and two small project fundings from the University of Hong Kong (HKU SPF 201309176244S to J.S.K. and HKU SPF 201409176131 to H.G.). The authors declare that they have no competing interests.
Literature Cited
Agouridis, A. P., M. Elisaf, and H. J. Milionis, 2011 An overview of lipid abnormalities in patients with inflammatory bowel disease. Ann. Gastroenterol. 24: 181–187.
Andreassen, O. A., R. S. Desikan, Y. Wang, W. K. Thompson, A. J. Schorket al., 2015 Abundant genetic overlap between blood lipids and immune-mediated diseases indicates shared molecu-lar genetic mechanisms. PLoS One 10: e0123057.
Ballinger, A. B., M. O. Savage, and I. R. Sanderson, 2003 Delayed puberty associated with inflammatory bowel disease. Pediatr. Res. 53: 205–210.
Barabasi, A. L., N. Gulbahce, and J. Loscalzo, 2011 Network med-icine: a network-based approach to human disease. Nat. Rev. Genet. 12: 56–68.
Bregenzer, N., A. Hartmann, U. Strauch, J. Scholmerich, T. Andus et al., 2006 Increased insulin resistance and beta cell activity in patients with Crohn’s disease. Inflamm. Bowel Dis. 12: 53–56. Bulik-Sullivan, B., H. K. Finucane, V. Anttila, A. Gusev, F. R. Day et al., 2015 An atlas of genetic correlations across human dis-eases and traits. Nat. Genet. 47: 1236–1241.
Califano, A., A. J. Butte, S. Friend, T. Ideker, and E. Schadt, 2012 Leveraging models of cell regulation and GWAS data in integrative network-based association studies. Nat. Genet. 44: 841–847.
Cantor, R. M., K. Lange, and J. S. Sinsheimer, 2010 Prioritizing GWAS results: a review of statistical methods and recommen-dations for their application. Am. J. Hum. Genet. 86: 6–22. Casiero, D., and W. H. Frishman, 2006 Cardiovascular
complica-tions of eating disorders. Cardiol. Rev. 14: 227–231.
Casserly, I., and E. Topol, 2004 Convergence of atherosclerosis and Alzheimer’s disease: inflammation, cholesterol, and mis-folded proteins. Lancet 363: 1139–1146.
Chen, D., S. Enroth, E. Ivansson, and U. Gyllensten, 2014 Path-way analysis of cervical cancer genome-wide association study highlights the MHC region and pathways involved in response to infection. Hum. Mol. Genet. 23: 6047–6060.
Chen, L. S., C. M. Hutter, J. D. Potter, Y. Liu, R. L. Prentice et al., 2010 Insights into colon cancer etiology via a regularized approach to gene set analysis of GWAS data. Am. J. Hum. Genet. 86: 860–871. Cirulli, E. T., and D. B. Goldstein, 2010 Uncovering the roles of rare variants in common disease through whole-genome se-quencing. Nat. Rev. Genet. 11: 415–425.
Cross-Disorder Group of the Psychiatric Genomics ConsortiumLee, S. H., S. Ripke, B. M. Neale, S. V. Faraone, S. M. Purcellet al., 2013 Genetic relationship between five psychiatric disorders estimated from genome-wide SNPs. Nat. Genet. 45: 984–994. Curtis, D., 2012 A rapid method for combined analysis of
com-mon and rare variants at the level of a region, gene, or pathway. Adv. Appl. Bioinform. Chem. 5: 1–9.
de Leeuw, C. A., J. M. Mooij, T. Heskes, and D. Posthuma, 2015 MAGMA: generalized gene-set analysis of GWAS data. PLOS Comput. Biol. 11: e1004219.
de Leeuw, C. A., B. M. Neale, T. Heskes, and D. Posthuma, 2016 The statistical properties of gene-set analysis. Nat. Rev. Genet. 17: 353–364.
Donato, M., Z. Xu, A. Tomoiaga, J. G. Granneman, R. G. Mackenzie et al., 2013 Analysis and correction of crosstalk effects in path-way analysis. Genome Res. 23: 1885–1893.
Elbers, C. C., K. R. van Eijk, L. Franke, F. Mulder, Y. T. van der Schouw et al., 2009 Using genome-wide pathway analysis to unravel the etiology of complex diseases. Genet. Epidemiol. 33: 419–431. Eleftherohorinou, H., V. Wright, C. Hoggart, A. L. Hartikainen, M.
R. Jarvelin et al., 2009 Pathway analysis of GWAS provides new insights into genetic susceptibility to 3 inflammatory dis-eases. PLoS One 4: e8068.
Global Lipids Genetics, C., C. J. Willer, E. M. Schmidt, S. Sengupta, G. M. Peloso et al., 2013 Discovery and refinement of loci associated with lipid levels. Nat. Genet. 45: 1274–1283. Gratten, J., and P. M. Visscher, 2016 Genetic pleiotropy in
com-plex traits and diseases: implications for genomic medicine. Ge-nome Med. 8: 78.
Gudbjartsson, D. F., H. Helgason, S. A. Gudjonsson, F. Zink, A. Oddsonet al., 2015 Large-scale whole-genome sequencing of the Icelandic population. Nat. Genet. 47: 435–444.
Gui, H., M. Li, P. C. Sham, and S. S. Cherny, 2011 Comparisons of seven algorithms for pathway analysis using the WTCCC Crohn’s Disease dataset. BMC Res. Notes 4: 386.
International Schizophrenia ConsortiumPurcell, S. M., N. R. Wray, J. L. Stone, P. M. Visscher, M. C. O’Donovanet al., 2009 Com-mon polygenic variation contributes to risk of schizophrenia and bipolar disorder. Nature 460: 748–752.
Jia, P., C. F. Kao, P. H. Kuo, and Z. Zhao, 2011 A comprehensive network and pathway analysis of candidate genes in major de-pressive disorder. BMC Syst. Biol. 5(Suppl. 3): S12.
Khalili, H., L. M. Higuchi, A. N. Ananthakrishnan, J. E. Manson, D. Feskanich et al., 2012 Hormone therapy increases risk of ul-cerative colitis but not Crohn’s disease. Gastroenterology 143: 1199–1206.
Lees, C. W., J. C. Barrett, M. Parkes, and J. Satsangi, 2011 New IBD genetics: common pathways with other diseases. Gut 60: 1739–1753.
Li, M. X., H. S. Gui, J. S. Kwan, and P. C. Sham, 2011 GATES: a rapid and powerful gene-based association test using extended Simes procedure. Am. J. Hum. Genet. 88: 283–293.
Li, M. X., J. S. Kwan, and P. C. Sham, 2012a HYST: a hybrid set-based test for genome-wide association studies, with application to protein-protein interaction-based association analysis. Am. J. Hum. Genet. 91: 478–488.
Li, M. X., J. M. Yeung, S. S. Cherny, and P. C. Sham, 2012b Eval-uating the effective numbers of independent tests and signifi -cant p-value thresholds in commercial genotyping arrays and public imputation reference datasets. Hum. Genet. 131: 747– 756.
Locke, A. E., B. Kahali, S. I. Berndt, A. E. Justice, T. H. Perset al., 2015 Genetic studies of body mass index yield new insights for obesity biology. Nature 518: 197–206.
Luo, L., Y. Zhu, and M. Xiong, 2012 Smoothed functional principal component analysis for testing association of the entire allelic spectrum of genetic variation. Eur. J. Hum. Genet. 21: 217–224.
Manolio, T. A., F. S. Collins, N. J. Cox, D. B. Goldstein, L. A. Hindorff et al., 2009 Finding the missing heritability of complex diseases. Nature 461: 747–753.
Maurano, M. T., R. Humbert, E. Rynes, R. E. Thurman, E. Haugen et al., 2012 Systematic localization of common disease-associated variation in regulatory DNA. Science 337: 1190–1195.
Network and Pathway Analysis Subgroup of Psychiatric Genomics Consortium, 2015 Psychiatric genome-wide association study analyses implicate neuronal, immune and histone pathways. Nat. Neurosci. 18: 199–209.
O’Dushlaine, C., E. Kenny, E. Heron, G. Donohoe, M. Gill et al., 2011 Molecular pathways involved in neuronal cell adhesion and membrane scaffolding contribute to schizophrenia and bi-polar disorder susceptibility. Mol. Psychiatry 16: 286–292. Parkes, M., A. Cortes, D. A. van Heel, and M. A. Brown, 2013 Genetic
insights into common pathways and complex relationships among immune-mediated diseases. Nat. Rev. Genet. 14: 661– 673.
Pers, T. H., J. M. Karjalainen, Y. Chan, H. J. Westra, A. R. Woodet al., 2015 Biological interpretation of genome-wide association stud-ies using predicted gene functions. Nat. Commun. 6: 5890. Pickrell, J., T. Berisa, J. Z. Liu, L. Segurel, J. Y. Tung, and D. Hinds,
2015 Detection and interpretation of shared genetic influences on 40 human traits. bioRxiv Available at: http://biorxiv.org/ content/early/2015/05/27/019885.
Ramanan, V. K., and A. J. Saykin, 2013 Pathways to neurodegen-eration: mechanistic insights from GWAS in Alzheimer’s disease, Parkinson’s disease, and related disorders. Am. J. Neurodegener. Dis. 2: 145–175.
Ramanan, V. K., L. Shen, J. H. Moore, and A. J. Saykin, 2012 Pathway analysis of genomic data: concepts, methods, and prospects for future development. Trends Genet. 28: 323–332.
So, H. C., A. H. Gui, S. S. Cherny, and P. C. Sham, 2011 Evaluat-ing the heritability explained by known susceptibility variants: a survey of ten complex diseases. Genet. Epidemiol. 35: 310– 317.
Solovieff, N., C. Cotsapas, P. H. Lee, S. M. Purcell, and J. W. Smoller, 2013 Pleiotropy in complex traits: challenges and strategies. Nat. Rev. Genet. 14: 483–495.
Sorensen, H. T., S. Sabroe, K. J. Rothman, M. Gillman, F. H. Steffensen et al., 1999 Birth weight and length as predictors for adult height. Am. J. Epidemiol. 149: 726–729.
Tsankova, N., W. Renthal, A. Kumar, and E. J. Nestler, 2007 Epigenetic regulation in psychiatric disorders. Nat. Rev. Neurosci. 8: 355–367. Wang, K., M. Li, and H. Hakonarson, 2010 Analysing biological pathways in genome-wide association studies. Nat. Rev. Genet. 11: 843–854.
Weinbrenner, T., M. Zuger, G. E. Jacoby, S. Herpertz, R. Liedtke et al., 2004 Lipoprotein metabolism in patients with anorexia nervosa: a case-control study investigating the mechanisms leading to hypercholesterolaemia. Br. J. Nutr. 91: 959–969. Welter, D., J. MacArthur, J. Morales, T. Burdett, P. Hall et al.,
2014 The NHGRI GWAS Catalog, a curated resource of SNP-trait associations. Nucleic Acids Res. 42: D1001–D1006. Yang, F., D. H. Xiong, Y. Guo, H. Shen, P. Xiaoet al., 2007 The
chemokine (C-C-motif) receptor 3 (CCR3) gene is linked and associated with age at menarche in Caucasian females. Hum. Genet. 121: 35–42.
Zammit, S., F. Rasmussen, B. Farahmand, D. Gunnell, G. Lewis et al., 2007 Height and body mass index in young adulthood and risk of schizophrenia: a longitudinal study of 1 347 520 Swedish men. Acta Psychiatr. Scand. 116: 378–385.
Zhernakova, A., C. C. van Diemen, and C. Wijmenga, 2009 Detecting shared pathogenesis from the shared genetics of immune-related diseases. Nat. Rev. Genet. 10: 43–55.