ISSN (Online) : 2319 - 8753
ISSN (Print) : 2347 - 6710
I
nternationalJ
ournal ofI
nnovativeR
esearch inS
cience,E
ngineering andT
echnologyAn ISO 3297: 2007 Certified Organization, Volume 2, Special Issue 1, December 2013
Proceedings of International Conference on Energy and Environment-2013 (ICEE 2013)
On 12th to 14th December Organized by
Department of Civil Engineering and Mechanical Engineering of Rajiv Gandhi Institute of Technology, Kottayam, Kerala, India
QUALITY ESTIMATION AND CHEMICAL
KINETIC MODELING OF BIO DIESEL
Arun lal A, Dr. Baiju B
Assistant Professor, John Cox CSI Institute of Technology, Trivandrum, India Associate Professor, College Of Engineering, Trivandrum, India
ABSTRACT
Biodiesel is an important alternative to fossil fuels. A main challenge in the commercialization and public acceptance of biodiesel is its quality. Here IR spectroscopy is used to measure the quality of biodiesel through (1) the blending level of biodiesel in fuel mixtures, (2) the fatty acid content of biodiesel fuels derived from various oils, and (3) the concentration of impurities present in biodiesel. Methyl esters of four different oils—palm oil, sunflower oil, waste cooking oil, and coconut oil were tested. The predicted concentration and specific gravity of the biodiesel-diesel blends were compared with the actual values. Also to understand the combustion phenomenon of bio-diesel, a detailed combustion simulation of the same is required which is quite a difficult task to carry out. To determine the influence of various parameters on the combustion characteristics of bio-diesel, Methyl Formate, a surrogate molecule, having a chemical structure similar to the actual bio-diesel has been used. This is carried out in a diesel engine environment. An object oriented software tool, Cantera, usually used for reacting flows, including chemical kinetics, thermodynamics and transport process is used here. It is interfaced with MATLAB and python, and program for the analysis of ignition delay is done. The variation of ignition delay time with change in the equivalence ratio and compression ratio and also plots of various species concentration profiles are also presented.
NOMENCLATURE
SME sun flower methyl ester
FAME fatty acid methyl ester
CCME coconut oil methyl ester
PME palm oil methyl ester
NIR near infrared
MIR mid infrared
Φ Equivalence ratio
P Pressure
1. INTRODUCTION
Biodiesel is mainly produced from vegetable oils. Amount of fatty acid in bio diesel is an important parameter in determining the quality of the fuel. In addition, various concentrations of biodiesel are commonly used as blends with petroleum-based diesel fuels, which makes biodiesel monitoring and engine performance optimization even more difficult. Biodiesel is mainly produced through a transesterification process. Due to the chemical reactions involved final products often contain impurities such as unreacted triglycerides, glycerol, catalyst, and alcohol. These contaminants undermine engine performance and can cause severe engine problems. IR spectrums can be used as a tool to estimate the amount of these contaminants in the fuel. In order to assess the net emissions and combustion properties a detailed study of the biofuels are necessary. Various kinetic studies have been carried out to derive the kinetic mechanism for biofuel surrogate.Detailed chemical kinetic models [21] for surrogate fuels are large in size and significant improvement has been made in developing tools which are used to model theses large mixtures for diesel engine combustion. Methyl Butanoate (MB) or butyrate has been widely used as a convenient substitute for large bio-fuel methyl ester molecules in flame simulation [12] due to its essential chemical structural features, namely the RC(=O)OCH3 structure.
In 2000, Fisher et al. [13] have developed a detailed chemical kinetic model for the combustion of methyl butanoate. The mechanism was then modified to study the combustion of MB in a jet stirred reactor (PSR), an opposed–flow diffusion flame and a variable pressure flow reactor (VPFR) [14]. C.V Naik et al [15] developed a chemical kinetic reaction mechanism for major components of bio-diesel, methyl oleate and methyl stearate. Benjamin et al [17] has given details regarding the autoignition of methyl formate mixed with oxygen/argon and oxygen/nitrogen. Experiments are carried out at average pressures of 2, 4, and 10 atm over a temperature range of 1053-1561 K. Compared to other biodiesel fuel surrogates, Methyl formate has been a rarely used bio-diesel surrogate fuel.
Table 2.0 Different Contents of Bio diesel
FAME (m%) C8:0 C10:0 C12:0 C14:0 C16:0 C18:0 C18:1 C18:2 C18:3
PAME 0.02 0.03 0.34 1.23 44.57 4.39 40.96 8.56 0.17
CCME 7.91 6.34 46.11 17.58 8.85 2.60 6.61 1.75 0.03
SME 0.01 0.10 0.10 1.52 24.50 17.42 36.34 15.41 0.67
2. BIODIESEL IR SPECTRUM
Biodiesel is a mix of fatty acid methyl ester, with different degrees of saturation. Spectra of biodiesels differ in the intensity of their band as well as in the exact frequency at which the maximum absorbance is produced in each type of biodiesel. These facts are used to differentiate the biodiesels.
Table 1.1 frequencies of bio diesel [8] [9]
Frequency cm-1 Functional group Mode of vibration intensity
3009 =C-H streching Medium
2924 -CH streching Very strong
2854 -CH streching Very strong
1740 -C=O streching Very strong
1654 C=C streching Very strong
1460 -CH Bending Medium
1240 -CH2 streching Medium
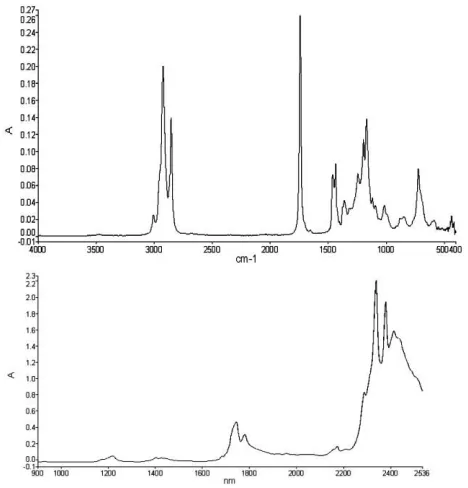
Typical infrared spectra of biodiesel are presented in Figure 1.2. Characteristic peaks of –CH stretching asymmetric/symmetric are observed around 2900 cm-1 in MIR range.
In the NIR range, the bands are a composite of many bands containing information on more than one type of vibration, the most prominent band and shoulder present in the biodiesel spectra are presented in Table 1-1. The first overtones of –CH stretching are observed in the NIR range around 1700 nm.
3. OBJECTIVE
The objective of this work is to apply infrared spectroscopy as a method to monitor biodiesel quality, biodiesel level in biodiesel-diesel blends, fatty acid profile, and impurities such as methanol, free glycerol, triglycerides, and water. And to understand the combustion phenomenon of bio diesel by determining the influence of various parameters on the combustion characteristics
Fig 1.2 Typical spectra in the infrared range MIR and NIR. .
3. CONCENTRATION MEASUREMENT USING NIR
Biodiesel is a fuel composed of mono-alkyl esters of long-chain fatty acids derived from vegetable oils or animal fats. It is renewable, oxygenated, essentially sulfur-free, and biodegradable. Elevated NOx emissions have been considered as one of the major problems of biodiesel and biodiesel blends as compared to petroleum diesel in diesel engine [1]. NOx emission is accelerated at high temperature and pressure due to pre ignition [2]. This suggests that NOx emissions could be reduced by retarding the combustion timing of the fuel in diesel engines, and can be achieved by adjusting injection timing according to the concentration of biodiesel in petroleum diesel. Therefore, a means to detect the concentration of biodiesel in its diesel blends will be necessary. Near-infrared (NIR) spectroscopy can be used to predict the properties of any type of biodiesel in a way relatively inexpensive and rapid. Successful applications of NIR spectroscopy on predicting the oil fraction and some operating properties of diesel fuel [3] and on determining the concentration of a specific type of biodiesel in diesel fuel [5] have been reported.
3.1fuel samples
saturated fatty acids (C8:0 to C14:0), and PME is abundant in C16:0, SME is rich in long-chain unsaturated fatty acids such as C18:1 and C18:2 and even some C18:3. Commercially available diesel fuels were used to blend with each biodiesel fuel. The volume-based concentration of biodiesel in these blends ranged from 0 to 100%.
3.2 Sample Preparation
The biodiesels were prepared from sunflower oil, coconut oil and palm oil by transterification process. The fatty acid profiles of the three biodiesel fuels are shown in Table 2.From the table it is clear that biodiesel samples include a broad range of fatty acids. The palm methyl ester (PME) contain large amount of C16:0, coconut methyl ester (CCME) is abundant in C12:0 and SME with C18:0.
3.3 NIR Spectra
All the samples were scanned on an NIR spectrometer. The spectrometer measures absorbance from 350 to 2500 nm using silicon and indium-gallium-arsenide sensors. A fiber-optic probe was used to illuminate the cuvette and carry the transmitted energy to the spectrometer.
4 DETERMINATION OF FATTY ACID CONTENT OF BIODIESEL 4.1 Measurement
All biodiesel samples were analyzed using gas chromatography. 20mg of biodiesel was dissolved in 4ml of benzene containing methyl-C13 internal standard. Samples were analyzed for fatty acid methyl esters using a HP 5890 GC with a FID detector and a SP-2560 capillary column. Injection port and detector
temperatures were 250 o
C with a flow rate of 1 ml/min. helium and a split ratio of 100:1. Injection volume was 1µl.
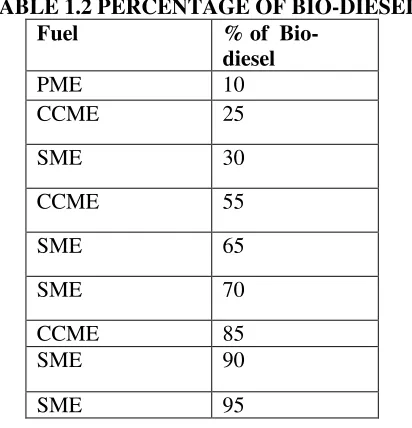
TABLE 1.2 PERCENTAGE OF BIO-DIESEL
Fuel % of
Bio-diesel
PME 10
CCME 25
SME 30
CCME 55
SME 65
SME 70
CCME 85
SME 90
SME 95
4.2 Prediction using MIR spectroscopy
In contrast with the near infrared (NIR) spectra, the mid infrared (MIR) spectra show a high degree of spectral resolution; consequently, a peak can be assigned to specific compounds except in 1400 – 900 cm -1
, because many compounds show bands in these frequencies. Figure 5.Shows the ranges of MIR spectrum of biodiesel used in this study. The main region on the MIR range used to estimate the concentration of C18:1, C18:2 and C18:3 in the biodiesel samples were located between3028 and 2812
cm -1
and between 1598 and 793 cm -1
. Specifically, the band of 3025 cm -1
is associated with C-H
stretching vibration with the =CH structure, and the band of 1418 cm -1
is assigned to the C-H bending
vibration with the =CH structure; additionally, the bands of 914cand 968 cm -1
have been associated with -HC=CH-structure[12] For the cases of C16:0, C18:0 models the used region was between 2965 and 2807
cm -1
and between 1205 and 801 cm -1
. In these regions, the band 2953 cm -1
is assigned to the C-H
asymmetric stretching, and the band 2853 cm -1
is assigned to the C-H symmetric stretching. Additionally,
stretching and bending vibrations of CH2 were noticed at 1163 cm -1
[12].
5. RESULTS
Fig 1. Spectra of SME and its Blends
Fig5: MIR spectrum of biodiesel.
has the lowest, and the blends are intermediate. The spectra of other bio diesels and their blends showed the same type of patterns.
Figure 4.2 (i) (ii) (iii) fatty acid concentrations.
It is well known that the range of 2100 to 2200nm is assigned to straight carbon chains and cis double bonds that reflect fatty acid [10]. Information about fatty acid compositions is demonstrated in this range through the in-saturation degree of the carbon chains. This range is close to NIR ranges used by some other researchers for the study of bio diesel [5]. It is well known that bands in the near infrared region are difficult to assign to specific compounds. This is because a single band in this region is the result of several possible combinations of fundamental bands and overtones. Nowadays, current advances in spectroscopy instruments conjugated with new chemometric software have made it possible to identify some chemical structures based on some characteristics of combination bands and overtones.
2000 and 2200 nm.
6. COMBUSTION KINETICS OF METHYL FORMATE DETAILS OF NUMERICAL ANALYSIS
Calculations and computations become an integral part of combustion analysis, which involves certain set of chemical reactions, and wide variety of engineering aspects including heat transfer, fluid dynamics, design and thermodynamics. In recent years, computational codes, including kinetics and fluid dynamics codes have been used as an added tool for combustion analysis. The process of writing codes is time-consuming, and in some cases, also requires a lot of computational time and power. To overcome these shortcomings of computational codes, and to make the computations more fluent, some combustion computational tools have been developed in the recent past. Cantera (version 1.6.0) is one of such software which has been utilised here to simulate the results. It is an object-oriented, open source suite of software tools for reacting flow problems involving chemical kinetics, thermodynamics and transport processes. It can be used with the help of various programming languages such as C, C++ and Fortran 90 and also in scripting environments like MATLAB and python. Here cantera has been operated from these scripting environments for rapid problem solutions.
6.1 Kinetic modelling
Kinetic modelling is the process by which the combustion process can be formulated mathematically. It can be regarded as a tool to analytically describe the complex process taking place during the combustion process. A chemical kinetic model consists of a reaction mechanism, which provides us the path through which the process moves to attain the final products. Thus using such a model, the effect of various species on the overall performance can also be measured. Furthermore an analytical tool can also be used to simulate the effect of different conditions on the fuel, without conducting the experiments for the same time. In fact a good chemical kinetic model should not only predict the behaviour of the fuel at specific conditions, but should be able to do so for a wide range of prescribed conditions. The main objective of combustion study is to describe the physical and chemical mechanism of combustion. . Availability of large number of elementary kinetic data, improved techniques for estimating specific rates, and continual growth in the size, speed and availability of powerful computers has contributed to the increasing application of detailed chemical modelling.
Reaction mechanism forms the core of the kinetic model. It provides us with a description of the elementary steps, which occur during the conversion of the fuel and oxidizer to final products. The reaction mechanism consists of reactions namely initiation reactions, propagation reactions and the termination reactions. Initiation reaction involves the reaction in which the fuel breaks down into various radicals. Propagation reaction consists of equation between various radicals generated in the initiation reaction. Termination reaction includes the reaction that end up with the final products.
The combustion of hydrocarbon fuel consists primarily of the sequential fragmentation of the initial fuel molecule into smaller intermediate species which are ultimately converted into final products. Carbon monoxide and H2 are common species that are observed during the oxidation of all hydrocarbons. H, OH, O2, HCO etc are other common species to all hydrocarbon combustion.
A. Reaction mechanism
When a reaction occurs, products are not formed instantaneously; instead number of small reactions occurs (within fraction of seconds) between the species (i.e., the chemical reactants) which are different from each other since each of them contributes to the overall reaction individually. These intermediate reactions are called as elementary reaction [18]. The collection of these elementary that ultimately results into an overall reaction called as a reaction mechanism.
B. software
production rates and to create process simulators using networks of stirred reactors. Cantera is a multi-platform combustion tool and can be used on Windows, Mac, Linux and Unix multi-platforms. Cantera’s efficient kinetics algorithms can result in substantial performance. For typical real-world applications (for example, rich flame simulations) increases in speed of a factor of two or more have been achieved simply by using Cantera to evaluate the production rates, leaving the rest of the code (in Fortran) untouched. The kernel is object-oriented, and defines a set of classes that represent important entities for a reacting-flow simulation. Complex dynamic system and process models. Cantera can also be used in Fortran or C++ reacting-flow.
Cantera conducts zero-dimensional kinetics simulations using Reactor objects [19]. Each reactor must have an associated object that represents the type of fluid the reactor contains. This object will be used to compute all required thermodynamic properties and species production rates, and therefore it must implement the reaction mechanism and equation of state desired for the reactor in question. Reactors that share the same mechanism may use the same object representing the fluid
C. Criteria for finding ignition delay time.
Ignition delay is defined as the time interval between the start of fuel injection and the start of combustion or the time taken to reach the concentration value of OH to reach 1 ×10⁻⁹ moles/cc. Alternatively ignition delay time is also the time corresponding to the maximum rate of reaction between CO and O atoms. Figure 1 shows the criteria used for finding out the ignition delay time. For any substance to get ignited, one of the basic requirements is that the concentration of OH (hydroxyl) radical must reach a value equal to 10-9 moles/cc. Before the concentration reaches this level, there is no change in the profile of the graph because of the delay in ignition.
FIG 3. IGNITION CRITERIA
And as explained above ignition occurs the moment OH value reaches the above said value and consequently there is a sudden increase in concentration profile of hydroxyl molecules indicating that the combustion of fuel has initiated which will now result in different chemical reactions.
D. Validation of Reaction mechanism
The proposed reaction mechanism should be validated by comparison with an experimental data or those from the literature. For this purpose the original reaction mechanism was first reduced using the ignition delay program using cantera. The original reaction mechanism was reduced to 122 species and 832 reactions. It was further reduced to 27 species and 148 reactions. Using these proposed reaction mechanism for MF, the ignition delay was predicted analytically and is found to be agreeable with the mechanism of Benjamin et.al [17] as shown in Table 1. The condition taken for validation for MF was with initial pressure of 10atm and equivalence ratio (Φ) = 1 from figure 2.
FIG 3.2 VALIDATION OF REACTION MECHANISM
Table1 below shows the reaction mechanism of the present work with that of experimental work carried out using methyl formate. It shows the variation of ignition delay as a function of temperature.
Temperature and pressure profile
Temperature and equivalence ratio
Equivalence ratio (Φ) is a parameter used to denote if a fuel species is rich or lean. If the value of Φ is less than 1, it’s called a fuel lean mixture (i.e., %of fuel is less compared to oxidizer) and when it is more than 1, it’s called a fuel rich mixture. From figure 4 it is seen that as Φ begins to increase there is a corresponding increase in the temperature because initially the value of Φ is less than 1. And at 1, value of temperature is at its peak. But after that, the temperature drops due to presence of more amount of fuels species as the Φ is increased.
III. SPECIES CONCENTRATION PROFILE
Figure 5 shows the species concentration profile of methyl formate (CH3OCHO) along with OH, H2O, CO, HO2 and NO. Nitrogen is considered as the diluents and its percentage is assumed to be 79 %. The fuel species and the major hydrocarbon present here is methyl formate and its concentration decreases. As already mentioned the concentration of hydroxyl molecule also increases as it reaches 10-9 moles/cc in order to satisfy the ignition criteria. As the combustion proceeds, the hydrogen and oxygen molecules react with each other resulting in the formation of water. When the reaction proceeds for a completion we can see that the concentration of water increases very rapidly. The value of nitrogen oxide increases because of the reaction of nitrogen with oxygen molecules.
FIG 3. 5 SPECIES CONCENTRATION PROFILE
Figure 6 shows the profile of CO, CO2, HO2, NO2, and OCHO. Initially the concentration of radical increases thereby promoting the reaction involving the fuel species. Earlier graph has shown the formation of OH radical which in turn leads to the formation of alkyl radicals, which would react with oxygen at high temperature. This causes the temperature to increase rapidly and tends to form CO as shown in fig. Finally the oxygen in CO will react with the remaining carbon molecules to form CO2 as shown in Fig. This can be seen from the increase in the concentration of CO2 and decrease in the concentration of CO.
FIG 3.6 SPECIES CONCENTRATION PROFILE
FIG 3.7 SPECIES CONCENTRATION PROFILE
Figure 8 shows profile of OH, H2O, H2, and HOCHO. As soon as the ignition criterion is satisfied, the OH concentration increases along with H molecules
and there is also an increase in the concentration of water. Due to the consumption of fuel during combustion, the concentration of fuel species decreases.
7.RESULTS AND DISCUSSION A. CO and CO2 profile for methyl formate
Figure 9 shows the change in the concentration of CO and CO2 when ɸ is increased. When ɸ increases, the amount of fuel supplied also increases leading to an increased concentration of carbon and it starts reacting with the available oxygen to form CO.
FIG 3.9 CO AND CO2 PROFILE
Higher the carbon content, higher the CO concentration. Consequently when ɸ increases CO also increases. Initially the CO2 level is high which is mainly because of the fact that at low values of ɸ sufficient oxygen is present which makes the formation of CO2 easier. As ɸ value decreases, CO fails to oxidise with oxygen thereby decreasing the level of oxygen.
Operating range (OR) is that period of time in the engine where the presence of CO is less when compared to CO2. Here level of CO is less compared to CO2 up to a ɸ of just above 2.
B. CO concentration at different equivalence ratios
Figure 10 shows the variation in the concentration of CO for different values of Φ a comparison is made between the three fuels MF, Methanol and ethanol. When compared to the other two fuels, the concentration of CO is very less for MF for the same Φ. Hence it can be concluded that CO emission for MF will be comparatively less.
C. CO and CO2 profile for methanol and ethanol
The figure 11 shows the CO and CO2 for the fuels methanol and ethanol for different values of Φ.
It can be seen that CO emission level for ethanol is higher than that of methanol for the same values of Φ. Thus the OR of ethanol is up to an Φ of 1.5 and that of methanol its is about 1.75.
FIG 3.11 OPERATING RANGE
From figure 9 MF has an operating range of about 2.25 which is higher when compared to the other two fuels. Thus for a greater value of ɸ or greater power requirement, fuel MF produces comparatively less CO.
D. Variation of CO2 with equivalence ratio
Figure 12 shows the plot between ɸ and CO2 concentration. Since the quantity of fuel increases as ɸ is increased, there is a considerable increase in the CO2 concentration.
Figure 13 shows the plot between the concentration of NO and time. It is seen that the concentration level of NO decreases as equivalence ration is increased.
FIG 3.12 CO2 VARIATION WITH ɸ
E. NOx emission of methyl formate
8.CONCLUSION
The selected ranges of NIR and MIR spectra allowed building reliable models to predict the concentration of C16:0, C18:0, C18:1, C18:2 and C18:3 fatty acids present in biodiesel samples, when the source of biodiesel is known. The models developed using heterogonous types of biodiesel presented accurate predictions for C18:1, C18:2, and C18:3. The results obtained using the MIR spectroscopy data were slightly better than those obtained with the NIR spectroscopy data for the C16:0 and C18:0 models. The validation results also showed that both NIR and MIR spectroscopy methods can be used to predict the fatty acid profile in biodiesel, although the biodiesel type is unknown. NIR and MIR spectroscopy methods can be considered as a promising tool to effectively monitor the biodiesel quality over the production and distribution chain.
A detailed study on the ignition of biodiesel in diesel engine environment has been conducted analytically using a kinetic scheme. The compression ratio considered was in between 21 to 30 with equivalence ratio ranging from 0.5 to 2.5 and nitrogen is considered as the diluent. The diluent percentage is assumed as 79% to make a comparison with atmospheric condition. The ignition delay times are obtained by varying initial conditions of the mixture in the combustion of biodiesel where Methyl formate was considered as primary fuel species. Similar analytical experiment of the fuels, methanol and ethanol was also done. The following results were hence analysed here:
a) The original reaction mechanism which was having 1672 reactions and 193 species was reduced numerically and resulted in 148 elementary reactions and 27 species.
b) The ignition criteria of the reaction mechanism was checked and it was found that ignition starts when the concentration of OH reaches 10^-9 moles/cc.
c) It was found that methyl formate (ch3ocho) produces less CO when compared to methanol and ethanol. d) Operating range of ch3ocho was found to be at an equivalence ratio of about 2.25 which was greater than that of the other two fuels.
e) Operating range of methanol and ethanol was found to be at an equivalence ratio of about 1.75 and 1.5 respectively.
REFERENCES
1. Choi and Reitz, 1999; Sharp et al., 2000; McCormick et al., 2001; Grimaldi et al., 2002; Hansen et al., 2006).
2. (Tat and Van Gerpen, 2003; Yuan et al., 2005; Yuan et al., 2007). Sikora Z and W. Salacki 1996. Use of NIR spectroscopy to predict several physical and operating properties of oil fractions and diesel fuels. Petroleum and Coal 38(1): 65-68.
3. Grimaldi, C. N., L. Postrioti, M. Battistoni, and F. Millo. 2002. Common rail HSDI diesel engine combustion and emissions with fossil/bio-derived fuel blends. SAE Tech. Paper 200201-6085. Warrendale, Pa.: SAE.
4. Sharp, C. A., S. A. Howell, and J. Jobe. 2000. The effect of biodiesel fuels on transient emissions from modern diesel engines: Part I. Regulated emissions and performance. SAE Paper No. 2000-01-1967. Warrendale, Pa.:SAE.
5. Knothe, G. 2001. Determining the blend level of mixtures of biodiesel with conventional diesel fuel by fiber-optic near-infrared spectroscopy and 1H nuclear magnetic resonance spectroscopy. J. American Oil Chemists Soc. 78(10): 1025-1028.
6. Grimaldi, C. N., L. Postrioti, M. Battistoni, and F. Millo. 2002. Common rail HSDI diesel engine combustion and emissions with fossil/bio-derived fuel blends. SAE Tech. Paper 200201-6085.
7. Warrendale, Pa.: SAE. Grimaldi, C. N., L. Postrioti, M. Battistoni, and F. Millo. 2002. Common rail HSDI diesel engine combustion and emissions with fossil/bio-derived fuel blends. SAE Tech. Paper 200201-6085. Warrendale, Pa.: SAE.
8. Yaakob, B. C. M., Syahariza, Z. A., Rohman, A. (2010) Chapter 1. Fourier Transform (FTIR) Spectroscopy: Development, Techniques, and Application in the Analyses of Fats and Oil. In O. J. Rees (Eds.), Fourier Transform Infrared Spectroscopy: Development, Techniques, and Application (pp. 1-26).New York, NY: Nova Science.
9. Sablinskas, V., Steiner, G., Hof, M. (2003) Chapter 6-Application. In G. Gauglitz, and T.Vo-Dinh (Eds.), Handbook of Spectroscopy (pp.89-168). Germany: WILEY-VCH.
10. S.Gail, M.J. Thomson, S.M. Sarathy, S.A. Syed , P. Dagaut, P.Die vart, A.J. Marchese, F.L. Dryer, A wide-ranging kinetic modeling study of methyl butanoate combustion, vol31, Proceedings of the Combustion Institute, pp. 305–311,2007.
11. William J. Pitz and Charles J. Mueller, Recent progress in the development of diesel surrogate fuels, vol 37, Progress in energy and combustion science, pp.330-350, 2011.
12. C.K. Westbrook , W.J. Pitz , P.R. Westmoreland , F.L. Dryer, M. Chaos, P. Osswald , T.A. Cool , J. Wang, B. Yang, N. Hansen and T. Kasper, A detailed chemical kinetic reaction mechanism for oxidation of four small alkyl esters in laminar premixed flames, Proceedings of the Combustion Institute , vol 32, pp.221–228, 2009.
14. S.M. Sarathy , S. Gaıl , S.A. Syed , M.J. Thomson , P. Dagaut , A comparison of saturated and unsaturated C4 fatty acid methyl esters in an opposed flow diffusion flame and a jet stirred reactor, Proceedings of the Combustion Institute, vol 20, 2007.
15. C.V. Naik , C.K. Westbrook, O. Herbinet , W.J. Pitz and M. Mehl, Detailed chemical kinetic reaction mechanism for biodiesel components methyl stearate and methyl oleate, vol 33, Proceedings of combustion institute, pp. 383-389, 2011.
16. S. Gail , M.J. Thomson , S.M. Sarathy , S.A. Syed , P. Dagaut, P. Die´vart , A.J. Marchese , F.L. Dryer, A wide-ranging kinetic modeling study of methyl butanoate combustion, Proceedings of the Combustion Institute, vol 31, pp. 305–311, 2007.
17. Benjamin Akih-Kumgeh and Jeffrey M. Bergthorson, Shock Tube Study of Methyl Formate Ignition, Energy and Fuels articles, pp.396-403, 2010.
18. Stephen R. Turns, An Introduction to Combustion Concepts and Applications, Second Edition, McGraw Hill, 2000. David G Goodwin,
![Table 1.1 frequencies of bio diesel [8] [9]](https://thumb-us.123doks.com/thumbv2/123dok_us/1539640.1188839/2.612.69.545.413.471/table-frequencies-bio-diesel.webp)