18th International Conference on Structural Mechanics in Reactor Technology (SMiRT 18) Beijing, China, August 7-12, 2005 SMiRT 18-M03-5
Disclaimer: This report was prepared as an account of work sponsored by an agency of the U.S. Government. Neither the U.S. Government nor any agency thereof, nor any employee, makes any warranty, expressed or implied, or assumes any legal liability or responsibility for any third party's use, or the results of such use, of any information, apparatus, product, or process disclosed in this publication, or represents that its use by such third party would not infringe privately owned rights.
LOCA FREQUENCY EVALUATION USING EXPERT ELICITATION
Robert Lee Tregoning
United States Nuclear Regulatory
Commission
Washington, DC 20555 USA
(301) 415-6657
[email protected]
Lee Richard Abramson
United States Nuclear Regulatory
Commission
Washington, DC 20555 USA
(301) 415-5840
[email protected]
Paul Michael Scott
Battelle Memorial Institute
505 King Avenue
Columbus, Ohio 43201 USA
(614) 424-5330
[email protected]
Nilesh Chokshi
United States Nuclear Regulatory
Commission
Washington, DC 20555 USA
(301) 415-6013
[email protected]
ABSTRACT
The double-ended-guillotine break (DEGB) criterion of the largest primary piping system in the plant, which generally provides the limiting condition for the emergency core cooling system requirements, is widely recognized as an extremely unlikely event. As a result, US Nuclear Regulatory Commission (NRC) staff are currently considering a risk-informed revision of the design-basis break size requirements for commercial nuclear power plants. In support of this effort, loss-of-coolant accident (LOCA) frequency estimates have been developed using an expert elicitation process by consolidating service history data and insights from probabilistic fracture mechanics (PFM) studies with knowledge of plant design, operation, and material performance. Baseline LOCA frequency estimates for the 5th percentile, median, mean and 95th percentile were determined from each panelist’s elicitation responses. Group estimates were determined by aggregating the individual estimates using the geometric mean of the individual estimates for each frequency parameter. Group variability was estimated by calculating 95% confidence bounds for each of the group frequency parameters (i.e., median, mean, 5th and 95th percentiles). A number of sensitivity analyses were conducted to examine the effects on the quantitative results from varying the assumptions, structure and techniques of the baseline analysis procedure.
Key Words: expert elicitation, loss-of-coolant accident (LOCA), break frequency, LOCA frequency, risk
ACKNOWLEDGMENTS
1. BACKGROUND
The emergency core cooling system (ECCS) requirements in the United States are contained in 10 CFR 50.46, Appendix K to Part 50, and General Design Criterion (GDC) 35. Specifically, ECCS design, reliability, and operating requirements exist to ensure that the system can successfully mitigate postulated loss-of-coolant accidents (LOCAs). Consideration of an instantaneous break with a flow rate equivalent to a DEGB of the largest primary piping system in the plant generally provides the limiting condition in the required 10 CFR Part 50, Appendix K analysis. However, the DEGB is widely recognized as an extremely unlikely event. Therefore, US NRC staff are performing a risk-informed revision of the design-basis break size requirements for operating commercial nuclear power plants.
A central consideration in selecting a risk-informed design basis break size is an understanding of the LOCA frequency as a function of break size. The most recent NRC-sponsored study of pipe break failure frequencies is contained in NUREG/CR-5750 (Poloski, 1999). Unfortunately, these estimates are not sufficient for design basis break size selection because they do not address all current passive-system degradation concerns (e.g., primary water stress corrosion cracking) and they do not discriminate among breaks having effective diameters greater than 6 inches.
There have been two approaches traditionally used to assess LOCA frequencies and their relationship to pipe size: (i) estimates based on statistical analysis of service experience data and (ii) PFM analysis of specific postulated failure mechanisms. Neither approach is particularly suited to evaluate LOCA event frequencies due to the rareness of these events and the modeling complexity. In this study, LOCA frequency estimates have been developed using an expert elicitation process to consolidate service history data and insights from PFM studies with knowledge of plant design, operation, and material performance. The elicitation process is well-recognized for quantifying phenomenological knowledge when data or modeling approaches are insufficient.
2. OBJECTIVE
The objective of this study is to develop separate BWR and PWR piping and non-piping passive system LOCA frequency estimates as a function of effective break size and operating time through the end of license extension. The evaluation considered three distinct time periods: the current day, the end of plant licensing, and the end of plant license extension. The elicitation focused solely on determining event frequencies that initiate by unisolable primary system side failures that can be exacerbated by material degradation with age. Central LOCA frequency estimates are the primary quantitative objective sought by the elicitation process so that a consensus type result is achieved. However, quantifying the variability among the individual panel members is also an important objective.
3. APPROACH
The elicitation primarily assumed normal plant operational cycles and loading histories consistent with current internal event plant risk assessment (PRA) models. The loads include representative constant stresses (e.g. pressure, thermal, residual) and expected transient stresses (e.g. thermal striping, heat-up/cool-down, pressure transients) that occur over the extended licensing period. The effect of rarer transients, such as a large seismic event, on the LOCA frequencies was not considered directly as part of this effort. The elicitation implicitly considered all modes of operation per calendar year based on the loading or operational history associated with each piping system or non-piping component.
An important assumption implicit in the elicitation was that the plant construction and operation are in accordance with applicable codes and standards. In addition, plant operation, inspection, and maintenance were generally assumed to occur within the expected parameters allowable by the regulations and the technical specifications. Deviations from these practices, however, do represent some percentage of the events included in the operating experience data and extrapolation of this data implicitly assumes that similar future deviations will occur with similar periodicity. Also, future plant operating practice was assumed to be essentially consistent with past operating practice. The effects of operating profile changes were not considered because of the large uncertainty surrounding possible operational changes and the potential wide-ranging ramifications.
The elicitation focused on developing generic, or average, values for the commercial fleet. Because the fleet average is not significantly affected by a few outliers, the panelists were instructed to account for broad plant-specific factors which influence the generic LOCA frequencies in providing uncertainty bounds, but not consider factors specific to any individual plants. Thus, the uncertainty bounds do not fully represent LOCA frequency estimates for individual plants that deviate from the generic values, i.e., they do not fully reflect individual plant variability. This study partitioned LOCA sizes into three smaller categories which are consistent with historical small break (SB), medium break (MB), and large break (LB) flow rate definitions. Additionally, three larger LOCA categories were defined within the classical LB LOCA regime to examine trends with increasing break size, up to and including, a DEGB of the largest piping system in the plant.
used in NUREG-1150 (1990), in the development of seismic hazard curves, and in the performance assessment of radioactive waste repositories. The process consisted of a number of steps. To begin, the project staff identified the issues to be evaluated through a pilot elicitation. The panel members for this pilot elicitation were all NRC staff. A panel of twelve panel members was then selected for the formal elicitation. The staff gathered background material and prepared an initial formulation of the technical issues which was provided to the formal elicitation panel. At its initial meeting, the panel for the formal elicitation discussed the issues and, using the staff formulation as a starting point, developed a final formulation for the elicitation structure. This structure included the decomposition of the complex technical issues which impact LOCA frequencies into fundamental elements in order to more easily assess these important contributing factors. Piping and non-piping base cases were also defined for use in anchoring quantitative elicitation responses. The base cases represent a set of well-defined conditions which could cause a LOCA. A subset of the panel was created to develop quantitative estimates of LOCA frequencies associated with the base case conditions.
After this initial meeting, the staff prepared a draft elicitation questionnaire and iterated with the panel to obtain a final questionnaire. The panelists quantifying the base case conditions also developed initial estimates. A second meeting was held with the entire panel to review the base case results, review the elicitation questions, and finalize the formulation of remaining technical issues. At their home institutions, the individual panel members performed analyses and computations to develop answers to the elicitation questionnaire.
The elicitation questionnaire required panelists to assess the following technical areas: the base case evaluation effort, utility and regulatory safety culture effects on LOCA frequencies, piping system LOCA frequencies, and non-piping system LOCA frequencies. The base case evaluation required the panelists to assess the accuracy and uncertainty in the base case analyses, and to also choose a particular base case approach for anchoring their elicitation responses. The piping and non-piping LOCA frequency questions required each panelist to first identify important LOCA contributing factors (i.e., piping systems, materials, degradation mechanisms, etc.) and select appropriate base case conditions for comparison. The panelists were then required to provide the relative ratios between their important contributing factors and the base case conditions based on their knowledge of passive system component failure. Each relative comparison required mid value, upper bound, and lower bound values. The mid value is defined such that, in the panelist’s judgment, there is a 50% chance that the unknown true answer lays above the mid value. The upper and lower bounds are defined such that there is a 5% chance that the true answer lays above the upper bound or below the lower bound, respectively. Each panelist was also required to provide their qualitative rationale supporting their quantitative values.
A facilitation team consisting of substantive members, a normative member and two recorders met separately with each panel member in day-long individual elicitation sessions. At these sessions, each panel member provided answers to the elicitation questionnaire along with their supporting technical rationales. The panel members then returned to their home institutions where they refined their responses based on feedback from their elicitation session. Upon receipt of the updated responses, the project staff compiled the panel’s responses and developed preliminary estimates of the LOCA frequencies. Along with the rationales, these preliminary estimates were presented to the panel at a wrap-up meeting. Group discussion was held at this meeting of important technical issues considered during the individual elicitations that were associated with individual estimates. After this meeting, panel members were invited to fill in gaps in their questionnaire responses and, if desired, to modify any of their responses one final time. Final estimates of the LOCA frequencies were then calculated and provided to the panel members for final review and quality assurance.
4. ANALYSIS PROCEDURE
The responses for each panel member were analyzed separately. Therefore, estimates of LOCA frequencies for BWR piping, PWR piping, BWR non-piping, and PWR non-piping failures were developed for each panelist, assuming that sufficient input was provided. A unified response and analysis format was developed to ensure consistency and commonalty in processing the panelists’ inputs. The panelists’ responses were assumed to represent the median, 95th, and 5th percentiles of their subjective uncertainty distributions for each elicitation question. The analysis structure is based on the assumption that all the responses correspond to percentiles of split lognormal distributions. These distributions are then combined using a lognormal framework. The final output for each panelist is BWR and PWR-specific total passive LOCA frequency estimates of the bottom-line parameters (mean, median, 5th and 95th percentiles). The LOCA frequencies for the individual panelists were then aggregated to obtain group LOCA frequency estimates of the bottom-line parameters.
uncertainty in their answers, i.e., they tend to be overconfident.
In order to address this concern, an error factor adjustment was applied to the error factor associated with a panelist’s total LOCA frequency estimates. The error factor is the ratio of the 95th percentile to the median. Because the median is not adjusted, the error factor adjustment is equivalent to adjusting the estimated 95th percentile of a panelist’s LOCA frequency distribution. Each panelist’s error factor was compared with the geometric mean of all the error factors. Error factors falling below the geometric mean were adjusted up to the geometric mean, but error factors above the geometric mean were not adjusted. The rationale for this adjustment is that error factors falling below the group average (as measured by the geometric mean) are interpreted as evidence of overconfidence, with the level of overconfidence increasing with distance from the group average. The bottom-line parameters were then recalculated using the adjusted error factors. This resulted in a variable overconfidence adjustment as a function of plant type and LOCA category and operating time.
The use of the geometric mean to aggregate the individual estimates of the bottom-line parameters to form group estimates and the use of confidence intervals based on the t distribution to capture panel diversity are both consequences of the assumed lognormal structure of the individual bottom-line LOCA frequency estimates. In addition to being consistent with the actual elicitation results, the use of the geometric for aggregation is motivated by the fact that the estimated LOCA frequencies being combined are based on the results of an expert elicitation. A fundamental assumption underlying the use of expert elicitation is that the elicitation responses are not systematically biased. The individual responses can be highly uncertain and they can differ drastically, but there is no significant systematic bias. A consequence of the assumption of no systematic bias is that the group opinion should be somewhere in the middle of the group, especially if there are wide differences in the results. One obvious choice would be to calculate group opinion using the median of the individual opinions. Other possible aggregation choices include the geometric mean and the trimmed geometric mean because they are also estimates of the median. The arithmetic mean is another possible choice. However, the arithmetic mean of individual opinions is often not a good measure of the median group opinion when the opinions are widely varying. In this study, the arithmetic mean is usually dominated by the one or two largest results and therefore cannot be fairly described as a measure of group opinion. The variability in the results stemming from the aggregation technique is examined in the Sensitivity Analyses section.
5. BASELINE RESULTS
The analysis procedures discussed above were applied to process the results from each panelist and aggregate the individual results to generate LOCA frequency estimates which reflect the estimates of the entire panel. Each panelist’s input is processed using the assumed split lognormal structure of each response to obtain frequency estimates for each contributing piping system and non-piping sub-component. Note that no overconfidence adjustment was used during the determination of the baseline results. These individual contributors are then summed to obtain total LOCA estimates for each panelist corresponding to BWR and/or PWR plant types as appropriate. The individual estimates are then aggregated to estimate central group opinion and evaluate panel diversity. These estimates are referred to as the baseline estimates herein.
Table 1 Total Baseline BWR and PWR LOCA Frequencies
Current Day Estimate (per cal. year) Estimate at End of Plant License (per cal. yr.)
(25 yr fleet average operation) (40 yr fleet average operation)
Plant Type
LOCA Size (GPM)
Eff. Break
Size
(inch) 5th Per. Median Mean 95th Per. 5th Per. Median Mean 95th Per.
>100 ½ 4.0E-05 3.0E-04 5.5E-04 1.6E-03 3.2E-05 2.6E-04 5.2E-04 1.5E-03 >1,500 1 7/8 3.6E-06 4.8E-05 1.0E-04 3.2E-04 3.0E-06 4.4E-05 9.7E-05 3.1E-04 >5,000 3 ¼ 7.4E-07 9.7E-06 2.4E-05 7.9E-05 6.7E-07 9.8E-06 2.7E-05 8.8E-05 >25K 7 1.2E-07 2.2E-06 6.1E-06 2.0E-05 1.1E-07 2.3E-06 7.6E-06 2.4E-05 >100K 18 1.2E-08 2.9E-07 1.1E-06 3.7E-06 1.1E-08 3.1E-07 1.5E-06 4.6E-06 BWR
>500K 41 9.7E-12 3.0E-10 3.2E-09 7.7E-09 1.2E-11 4.0E-10 4.9E-09 1.1E-08 >100 ½ 7.9E-04 3.7E-03 5.9E-03 1.5E-02 4.8E-04 2.5E-03 4.3E-03 1.2E-02 >1,500 1 5/8 9.9E-06 1.4E-04 4.6E-04 1.4E-03 1.0E-05 1.6E-04 5.6E-04 1.8E-03 >5,000 3 2.6E-07 3.4E-06 1.3E-05 4.2E-05 5.9E-07 7.6E-06 2.8E-05 9.3E-05 >25K 7 1.9E-08 3.1E-07 1.2E-06 3.9E-06 3.8E-08 6.5E-07 2.7E-06 8.9E-06 >100K 14 5.3E-10 1.1E-08 9.9E-08 2.6E-07 1.3E-09 2.7E-08 2.5E-07 6.5E-07
PWR
>500K 31 4.5E-11 1.2E-09 1.5E-08 3.8E-08 1.2E-10 2.9E-09 3.8E-08 9.5E-08
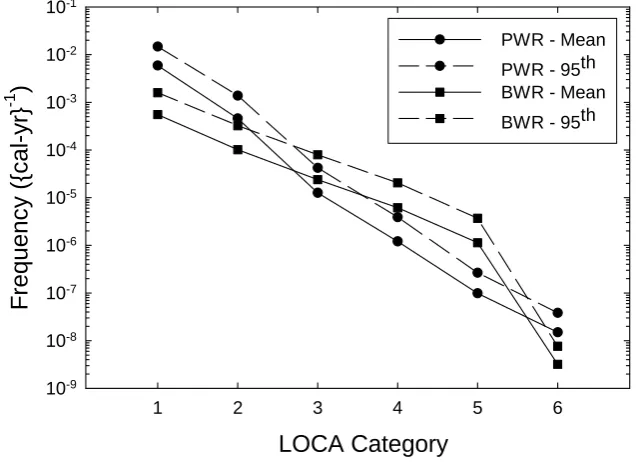
Figure 1 is a graphical representation of the results from Table 1. Included in this figure are the mean and 95th percentile, current day (25 years of plant operations) LOCA frequency estimates for both BWR and PWR plants. As illustrated, the PWR Category 1 results are approximately 11 times higher than the BWR Category 1 results. This reflects the contribution of the steam generator tube rupture experience which is the dominant LOCA contributor for PWR Category 1 LOCAs. Conversely, for the Category 5 LOCAs, the BWR results are approximately 11 times higher than the PWR results. This reflects the continued concern of the participants with IGSCC for the BWR recirculation system. This concern disappears for the Category 6 LOCAs because the largest diameter recirculation system piping (28-inch diameter) cannot support this largest category LOCA. For the other LOCA categories, the total LOCA BWR and PWR frequencies are generally comparable and vary by a factor of 5 or less.
LOCA Category
1 2 3 4 5 6
F
requenc
y
(
{cal-y
r}
-1
)
10-9
10-8
10-7
10-6
10-5
10-4
10-3
10-2
10-1
PWR - Mean PWR - 95th BWR - Mean BWR - 95th
Figure 1 Total BWR and PWR LOCA Frequencies (Means and 95th Percentile Values) as a Function of LOCA
Category at 25 Years of Plant Operations
6. SENSITIVITY ANALYSES
assumptions, structure and techniques of the baseline analysis procedure used to process the elicitation responses to develop the baseline LOCA frequency estimates discussed above. The sensitivity analyses fall into one of the following five broad categories: mean determination, panelist overconfidence adjustment, correlation structure, individual response aggregation, and panel diversity. In each case, a single change in the baseline analysis procedure was made and the effect was quantified. In this paper, only those sensitivity analyses associated with the overconfidence adjustment (i.e., the error factor adjustment) and the choice of aggregation method are discussed. The impact of different analysis assumptions in these other categories is often small or leads to less conservative results.
6.1 Error Factor Adjustment
The overconfidence correction evaluated in this paper adjusts the error factors associated with each panelist’s total LOCA frequency estimate. First, the geometric mean of all the individual BWR and PWR unadjusted error factors was determined for each LOCA category and operating time period evaluated during the elicitation. Panelists with error factors below the geometric mean for a given estimate were adjusted up to the geometric mean, but panelists with error factors above the geometric mean were not adjusted. This approach leads to a variable adjustment as a function of plant type, LOCA category, and operating time.
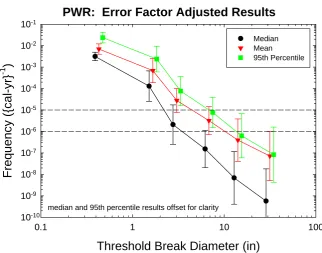
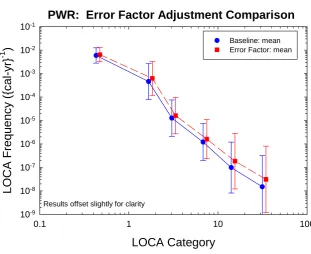
The current day BWR and PWR total LOCA frequency results arising from this error factor adjustment are illustrated in Figures 2 and 3, respectively, while the median, mean, 5th, and 95th percentile values are tabulated in Table 2 for both the current day and end of plant licensing period. The adjusted error factor and baseline results are not markedly different. The difference between the adjusted and baseline results increases with increasing LOCA category because there are greater differences among the panelists’ expected uncertainty. The PWR baseline and error factor adjusted means are compared in Figure 4. The modest deviation from the baseline estimates is apparent in this figure.
Table 2 Total BWR and PWR LOCA Frequencies (After Overconfidence Adjustment using Error Factor Scheme)
Current Day Estimate (per cal. year) Estimate at End of Plant License (per cal. yr.)
(25 yr fleet average operation) (40 yr fleet average operation)
Plant Type
LOCA Size (GPM)
Eff. Break
Size
(inch) 5th Per. Median Mean 95th Per. 5th Per. Median Mean 95th Per.
>100 ½ 3.1E-05 3.0E-04 6.4E-04 2.1E-03 2.6E-05 2.6E-04 6.0E-04 2.0E-03 >1,500 1 7/8 2.7E-06 4.8E-05 1.2E-04 4.1E-04 2.2E-06 4.4E-05 1.1E-04 4.1E-04 >5,000 3 ¼ 5.6E-07 9.7E-06 2.8E-05 1.0E-04 4.9E-07 9.8E-06 3.2E-05 1.2E-04 >25K 7 9.6E-08 2.2E-06 7.3E-06 2.7E-05 8.7E-08 2.3E-06 9.3E-06 3.4E-05 >100K 18 7.2E-09 2.9E-07 1.5E-06 5.4E-06 6.2E-09 3.1E-07 2.1E-06 7.3E-06 BWR
>500K 41 5.6E-12 3.0E-10 6.4E-09 1.6E-08 6.7E-12 4.0E-10 1.0E-08 2.5E-08 >100 ½ 6.0E-04 3.7E-03 6.4E-03 1.8E-02 3.5E-04 2.5E-03 4.7E-03 1.4E-02 >1,500 1 5/8 7.0E-06 1.4E-04 6.2E-04 2.2E-03 7.6E-06 1.6E-04 7.6E-04 2.7E-03 >5,000 3 2.0E-07 3.4E-06 1.6E-05 5.8E-05 4.5E-07 7.6E-06 3.6E-05 1.3E-04 >25K 7 1.3E-08 3.1E-07 1.6E-06 5.7E-06 2.6E-08 6.5E-07 3.6E-06 1.3E-05 >100K 14 3.8E-10 1.1E-08 1.9E-07 5.2E-07 9.2E-10 2.7E-08 4.6E-07 1.3E-06
PWR
Threshold Break Diameter (in)
0.1 1 10 100
LOCA F
requency ({cal-yr}
-1
)
10-10
10-9
10-8
10-7
10-6
10-5
10-4
10-3
10-2
Median Mean 95th Percentile
BWR: Error Factor Adjusted Results
median and 95th percentile results offset slightly for clarity
Figure 2 BWR LOCA Frequencies with Error Factor Adjustment
Threshold Break Diameter (in)
0.1 1 10 100
Frequenc
y ({cal-yr}
-1
)
10-10
10-9
10-8
10-7
10-6
10-5
10-4
10-3
10-2
10-1
Median Mean 95th Percentile
PWR: Error Factor Adjusted Results
median and 95th percentile results offset for clarity
LOCA Category
0.1 1 10 100
LOCA Frequenc
y
({c
al
-y
r}
-1
)
10-9
10-8
10-7
10-6
10-5
10-4
10-3
10-2
10-1
Baseline: mean Error Factor: mean
PWR: Error Factor Adjustment Comparison
Results offset slightly for clarity
Figure 4 Comparison of Baseline Results and Error Factor Adjustment Results
The error factor adjustment is a plausible method of accounting for overconfidence because the error factor adjustment varies as a function of the difference between the individual and group (geometric mean) estimates for each parameter. Also, because group uncertainty increases with LOCA size, the error factor adjustment increases with LOCA size. This is a desirable property because larger LOCA sizes deviate further from the operating experience failure and precursor data. Therefore, subjective overconfidence in estimating frequencies associated with larger LOCAs is more likely.
6.2 Aggregation
Several analyses were performed to examine the sensitivity of the baseline results to other possible aggregation schemes. Aggregation by averaging the individual panelists’ distributions to create a mixture distribution was one method evaluated. The effect of using different measures of group opinion other than the geometric mean was also evaluated.
6
.2.1 Mixture Distribution Aggregation - One method of aggregating the individual panelist bottom-lineestimates is to use a mixture distribution. The mixture distribution is the average of all the individual panelist distributions for each LOCA category, plant-type (i.e., BWR or PWR), and operating time period. This aggregation methodology assumes that the elicitation responses come from equally credible models and that the responses provided by the experts are representative of the entire population of experts. The mixture distribution approach does not attempt to develop aggregated estimates that represent the central group opinion as does the baseline methodology, but rather attempts to exhibit the full range of variability among the panelist responses.
This frequency range was divided into 1000 equal intervals and the individual panelist CDFs were calculated and averaged at each of the 1000 points in the frequency range. This procedure yielded a CDF evaluated at 1000 points for each plant type and LOCA category.
The 5th, 50th, and 95th percentiles were then determined for each mixture distribution. Because the mean of a mixture distribution is equal to the average of the means of the individual panelist distributions, the mean of each mixture distribution is equal to the arithmetic mean of the individual mean estimates. A summary of the mean, median and 95th percentiles for the mixture distributions is provided in Figure 5 for the BWR and Figure 6 for the PWR LOCA frequencies for the current day time period. Although confidence bounds have not been determined for these distributions, they could be calculated using a bootstrap technique (Efron, 1993).
Threshold Break Diameter (in)
0.1 1 10 100
LOC
A
Frequenc
y
({c
a
l-y
r}
-1
)
10-10
10-9
10-8
10-7
10-6
10-5
10-4
10-3
10-2
Median Mean 95th Percentile
BWR: Mixture Distribution Results
Threshold Break Diameter (in)
0.1 1 10 100
LOCA
Frequenc
y
({c
a
l-y
r}
-1
)
10-10
10-9
10-8
10-7
10-6
10-5
10-4
10-3
10-2
10-1
Median Mean 95th Percentile
PWR: Mixture Distribution Results
Figure 6 PWR LOCA Frequencies Determined by Mixture Distribution Aggregation: Current Day Estimates
The mixture distribution aggregation scheme will always result in higher mean and 95th percentile estimates and lower 5th percentile estimates than the other aggregation schemes. Consequently, the mixture distribution scheme exhibits the greatest difference between the 5th and 95th percentiles. The mean and 95th percentile estimates are often dominated by the maximum panelist estimate while the 5th percentile is often dominated by the minimum panelist estimate. This characteristic implies that the extreme individual estimates will often dominate the mean, 5th, and 95th percentile estimates. When differences between the mixture distribution and geometric mean aggregated parameters are large, it is an indication that one or two panelists’ estimates are significantly greater than the remaining estimates for that category.
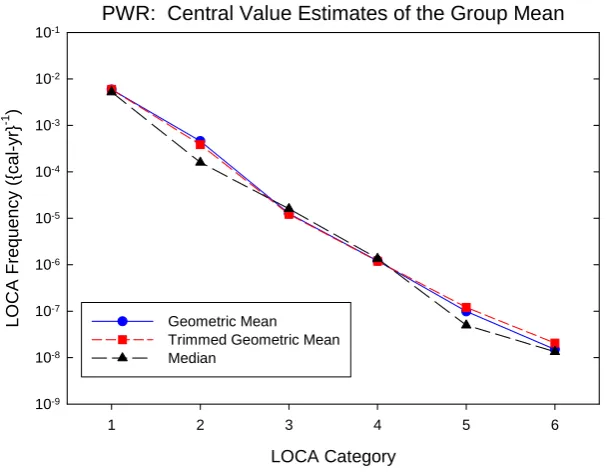
6.2.2 Measures of Group Opinion – As previously documented, the technique used to determine group
opinion can have a significant effect on the aggregated LOCA frequency estimates. The objective of the elicitation is to determine a central estimate of group opinion. Several different central estimate measures were used to determine group opinion from the individual panelist’s responses: geometric mean (GM), trimmed geometric mean (TGM), median, and arithmetic mean (AM). The baseline LOCA frequency results use the geometric mean.
PWR: Central Value Estimates of the Group Mean
LOCA Category
1 2 3 4 5 6
LOCA Frequen
cy ({cal-y
r}
-1 )
10-9
10-8
10-7
10-6
10-5
10-4
10-3
10-2
10-1
Geometric Mean Trimmed Geometric Mean Median
Figure 7 Various Central Value Estimates of the PWR LOCA Frequencies at 25 Years
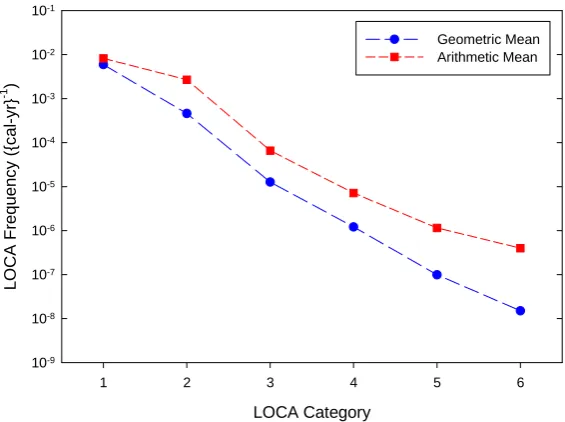
The arithmetic mean and geometric mean estimates of the BWR and PWR LOCA mean frequencies are compared in Figures 8 and 9, respectively. Note that the arithmetic mean estimates are identical to the means determined for the mixture distribution aggregation. These figures indicate that the arithmetic mean LOCA frequency estimates can be significantly higher than the other estimates. The amount of the increase gets larger with the difference between the upper bound estimates and the estimates from the remaining panelists. The largest differences are greater than a factor of 10 and occur for the BWR Category 3 and 4 and the PWR Category 5 and 6 LOCA estimates. In each of these instances, there are one or two panelists’ estimates that are significantly higher than the others. The estimate of group opinion is then dominated by these high values when arithmetic mean aggregation is used.
LOCA Category
1 2 3 4 5 6
LOCA Fr
eq
uen
cy
({
cal-yr
}
-1 )
10-9
10-8
10-7
10-6
10-5
10-4
10-3
10-2
10-1
Geometric Mean Arithmetic Mean
LOCA Category
1 2 3 4 5 6
LO
C
A
F
re
quenc
y
({
c
al
-y
r}
-1 )
10-9 10-8 10-7 10-6 10-5 10-4 10-3 10-2 10-1
Geometric Mean Arithmetic Mean
Figure 9 Comparison of Arithmetic Mean and Geometric Mean Estimates of the PWR LOCA
Frequencies at 25 Years
7. CONCLUSIONS
An expert elicitation process was used to consolidate service history data and insights from PFM studies with knowledge of plant design, operation, and material performance to develop LOCA frequency estimates. Baseline LOCA frequency estimates for the 5th percentile, median, mean and 95th percentile were determined from each panelist’s elicitation responses. These individual responses were then aggregated by calculating the geometric mean of each of these underlying parameters. Group variability was estimated by calculating 95% confidence bounds for each of the aggregated frequency parameters (i.e., median, mean, 5th and 95th percentiles) assuming that the panelist variability is lognormally distributed. The baseline results are shown in Table 1.
A number of sensitivity analyses were conducted to examine the robustness of the quantitative results to the underlying analysis procedure. The error factor adjustment scheme provides a variable overconfidence adjustment as a function of LOCA size and plant type, and is greatest for those panelists that expressed the least amount of uncertainty compared to the group average. This adjustment leads to a relatively small increase in the baseline LOCA frequency estimates.
The most important consideration is the method used to aggregate the individual panelist estimates. The mixture distribution aggregation scheme always leads to means and 95th percentile estimates that are higher than the baseline geometric mean aggregation scheme. The baseline approach develops consensus-type summary estimates from the panelists’ opinions in a manner consistent with the elicitation objectives. The mixture distribution does not represent a consensus-type group estimate; rather, it is based on the fundamental assumption that the expert panel is a random sample from the population of all experts and that the goal is to obtain an unbiased estimate of the aggregate distribution function of LOCA estimates averaged over the population of all experts. While chosen to be broadly representative of the international expert community, the selected panel of 12 experts is not a random sample from this community. Consequently, there is no technical basis for extrapolating the study results to the population of all experts. Nevertheless, because of the panel selection and the elicitation and analysis procedures used, the study results are believed to be broadly representative of the international expert community opinion.
8. REFERENCES
1. Poloski, J.P., Marksberry, D.G., Atwood, C.L., and Galyean, W.J., “Rates of Initiating Events at U.S. Nuclear Power Plants: 1987-1995,” NUREG/CR-5750, February 1999.
2. “Severe Accident Risks: An Assessment for Five U.S. Nuclear Power Plants,” NUREG-1150, U.S. Nuclear Regulatory Commission, December 1990.