Multidimensional Structural Characterization is Required to Detect and Differentiate Among Moderate Disturbance Agents
Authors:
Jeff W. Atkins1, Ben Bond-Lamberty2, Robert T. Fahey3, Brady S. Hardiman4,5, Lisa Haber1, Ellen Stuart-Haëntjens1,6, Elizabeth LaRue4, Brenden McNeil7, David A. Orwig8, Atticus E. S. Stovall9, Jason Tallant10, Jonathan A. Walter11, and Christopher M. Gough1
1 Department of Biology; Virginia Commonwealth University; Richmond, VA
2 Joint Global Change Research Institute, Pacific Northwest National Lab, College Park, MD 3 Department of Natural Resources and the Environment & Center for Environmental Sciences
and Engineering; University of Connecticut; Storrs, CT
4 Department of Forestry and Natural Resources, Purdue University; West Lafayette, IN 5 Department of Civil and Environmental Engineering; Purdue University; West Lafayette, IN
6 United States Geological Survey; Sacramento, CA
7 Department of Geography; West Virginia University; Morgantown, WV
8 Harvard Forest; Petersham, MA
9 NASA Goddard Space Flight Center; Greenbelt, MD 10 University of Michigan Biological Station; Pellston, MI
11 Department of Environmental Sciences, University of Virginia, VA
ABSTRACT
The study of vegetation community and structural change has been central to ecology for over a
century, yet how disturbances reshape the physical structure of forest canopies remains relatively
unknown. Moderate severity disturbance including fire, ice storms, insect and pathogen
outbreaks, affects different canopy strata and plant species, which may give rise to variable
structural outcomes and ecological consequences. Terrestrial lidar (light detection and ranging)
offers an unprecedented view of the interior arrangement and distribution of canopy elements,
permitting the derivation of multidimensional measures of canopy structure that describe several
canopy structural traits with known linkages to ecosystem functioning. We used lidar-derived
canopy structural measured within a machine learning framework to detect and differentiate
among various disturbance agents, including moderate severity fire, ice storm damage,
age-related senescence, hemlock woolly adelgid, beech bark disease, and chronic acidification. We
found that disturbance agents such as fire and ice storms primarily affected the amount and
position of vegetation within canopies, while acidification, pathogen and insect infestation, and
senescence altered canopy arrangement and complexity. Only two of the six disturbance agents
significantly reduced leaf area, indicating that this commonly quantified canopy feature is
insufficient to characterize many moderate severity disturbances. Rather, measures of canopy
structure, including those that describe multidimensional change, are needed to characterize
disturbance at moderate severities because structural changes from these events are spatially and
quantitatively variable. Our findings suggest that standard disturbance detection methods, such
as optical based remote sensing platforms, may currently be limited in their ability to detect,
differentiate, and characterize disturbance. Further, we conclude that a more broadly inclusive
will improve the modeling, detection, and prediction of functional implications of moderate
severity disturbance.
Keywords: ecology; disturbance; forest ecosystems; lidar; disturbance detection; forest structure
INTRODUCTION
Disturbance alters forest structure. Variation in the severity, intensity, and frequency of
disturbance gives rise to a wide-ranging mosaic of structures shaped by shifting vegetation
composition, abundance, and distribution (Frolking et al 2009; Pickett and White 1985; Frelich
and Lorimer, 1991; Frelich and Reich 1999). While ecologists have long studied how
disturbance severity, intensity, and frequency reshape vegetation structure (Connell 1978,
Johnstone et al. 2016, Turner et al. 2016, Cale et al. 2017), the structural differentiation that
arises as a function of the agent of disturbance has not been well-characterized (Jimenez et al.
1985, Foster et al. 1999, Amiro 2001, Ł aska 2001, Hanson and Lorimer 2007, Buma 2015).
Moderate severity disturbances (i.e. non-stand replacing or “partial” disturbances) can produce
an especially wide array of structural outcomes, including highly heterogeneous structural
conditions across a variety of spatial scales (Woods 2004, Hanson and Lorimer 2007, Fahey et
al. 2015). At moderate severities, the importance of disturbance agent in driving variable
structural and functional outcomes may be equivalent in magnitude to other well-characterized
factors such as severity, intensity, and frequency(Hardiman et al. 2013). Without considering the
structural divergence associated with different disturbance agents, our ability to construct
generalized frameworks to characterize disturbance effects and make inferences about
structure-function relationships following moderate disturbance is limited (Turner et al. 2001; White and
Most evidence that disturbance agents create divergent structural outcomes comes from studies
that are either solely qualitative or limited in the structural outcomes they consider (Franklin et
al. 2002; Roberts, 2007). However, separate investigations of extreme weather, fire, wind-throw,
insect invasion, and pathogen outbreak suggest disturbance agents imprint quantifiably distinct
patterns of vegetation redistribution and structural change (Dale et al. 2001, Hanson and Lorimer
2007, Frolking et al. 2009, Plotkin et al. 2013, Oldfield and Peterson 2019, Peterson 2019)
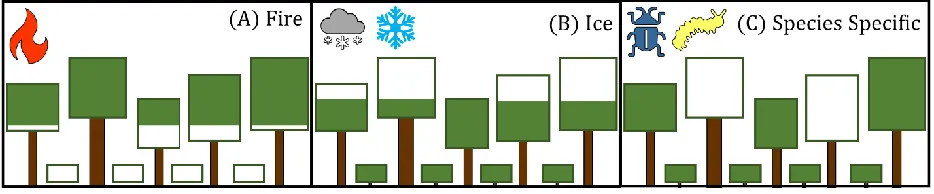
(Fig.1). For example some disturbance agents may preferentially affect the vertical distribution
of vegetation—ice and windthrow may reduce foliage in the upper canopy (Frolking et al. 2009,
Weeks et al. 2009)(Fig. 1a), while ground fires may disproportionately remove subcanopy
vegetation (Turner et al. 2001) (Fig. 1b). Host-specific insects and pathogens, including beech
bark disease and hemlock woolly adelgid, alter the horizontal distribution of vegetation through
the creation of canopy gaps and canopy thinning (Orwig and Foster 1998, Fahey et al. 2015,
Arthur et al. 2017) (Fig. 1c). Disturbance may also alter vegetation along both horizontal and
vertical axes simultaneously (Hardiman et al. 2013).
Disturbance effects are inherently multidimensional, and may not be easily summarized, or
detected, using a single parameter (Lowman and Rinker, 2004; Frolking et al 2009).
Post-disturbance changes however, are typically described using dimensionless structural parameters
such as leaf area (Waring and Schlesinger, 1985) or as unidimensional shifts in vegetation along
a single axes (Parker and Brown 2000, Weeks et al. 2009, McMahon et al. 2015). For example,
leaf area index or LAI is an estimate of leaf area often used to characterize structural change
resulting from disturbance (Waring and Schlesinger, 1985). Leaf area may change minimally
following a low to moderate severity disturbance event, which limits its utility as a disturbance
detection measure (Cohen et al. 2016). The failure of singular measures such as LAI to
adequately characterize disturbance arises from how disturbances frequently alter several canopy
structural traits concurrently, yet the relative performance of LAI versus canopy structural trait
metrics at characterizing forest disturbances has not been quantified
A multidimensional approach to characterize vegetation change may help detect and differentiate
moderate severity disturbance agents. One promising methodology uses metrics that describe
several aspects of canopy structure to define a suite of canopy structural traits (CSTs; Fahey et
al. 2019) including vegetation density, height, arrangement, cover, and structural complexity
(Atkins et al. 2018a) (Table 1; Fig. 2). Canopy structural metrics are derived from terrestrial lidar
(Hardiman et al. 2011, McMahon et al. 2015, Ehbrecht et al. 2016, Atkins et al. 2018,
Shiklomanov et al. 2019) and are linked with a variety of ecosystem functions, including
primary production (Hardiman et al. 2011, Gough et al. 2019, LaRue et al. 2019), light
acquisition (Stark et al. 2012; Atkins et al. 2018b), microclimate (Ehbrecht et al. 2017) and
multidimensional measures of canopy complexity, such as canopy rugosity, a robust indicator of
functional change (Gough et al. 2019), as well as several metrics that quantify canopy structure
(Table 2). CSTs provide a powerful, standardized methodology for characterizing multiple
aspects of structural change following disturbance, thus potentially enabling the detection of
disturbances not sufficiently characterized by single measures of structural change.
We characterized CSTs for a series of moderate severity disturbances, including ice storms,
ground fire, age-related senescence, chronic acidification, and pathogens and insect outbreaks
(Table 1). We hypothesized that the multivariate CST-based approach would outperform a
unidimensional, leaf-area-only approach. We also hypothesized that disturbance agents would
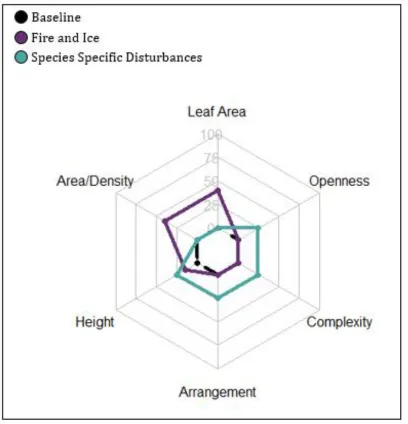
differ in which CSTs they most strongly alter (i.e. canopy height, area/density, arrangement,
openness, and complexity; Fig. 2) due to agent-specific effects on canopy structure (Atkins et al.
2018a; Fahey et al. 2019a). We expected fire and ice storm damage to preferentially affect total
leaf area, as well as area/density and canopy height as these pulse disturbances occur over acute
time intervals often resulting in reductions in canopy leaf area and vegetation height throughout
and across the canopy (Plotkin et al. 2013, Cote et al. 2014, Turner et al. 2016, Oldfield and
Peterson 2019; Fahey et al. 2019b). We hypothesized that the other species-specific disturbances
surveyed would primarily alter canopy traits such as arrangement, height, complexity, and
openness (Fig. 3). Disturbances such as pathogen outbreaks and insect infestations result in
reductions in leaf area but may occur over enough time that regrowth or subcanopy response
may occur. Insect and pathogen outbreaks can also work at the individual level, attacking
specific trees rather than affecting the “canopy”, which can result in the creation of canopy gaps
Figure 2. Hypothesized relative change from baseline conditions (in units of absolute value of percentage change) for leaf area as well as canopy structural traits defined in table two (Atkins et al. 2018a). Hypothesized change is based on empirical data for moderate severity fire (Kinnaird et al. 1998; Alencar et al. 2006; Boer et al. 2008), ice storm damage (Rhoads et al. 2002; Weeks et al. 2008), while species specific hypotheses are informed from conservative extrapolations based on qualitative descriptions of related disturbances (Orwig et al. 1998; Gough et al. 2013). Disturbances such as fire, and ice are expected to alter leaf area, density, and canopy height, while acidification, senescence, insect and pathogen outbreaks are expected to alter canopy height, openness, complexity, and arrangement.
METHODS
We surveyed six temperate forest sites (Table 1), each of which was moderately disturbed by a
protracted “press” disturbances from age-related senescence, chronic acidification, insect, and
pathogen outbreaks. We estimated how each agent altered canopy structure through surveys of
pulse disturbed sites before and after disturbance and, in the case of temporally diffuse press
disturbances, by sampling disturbed and nearby control sites concurrently. All sites were
surveyed during the same period of ecological recovery, prior to returning to their
pre-disturbance structural configurations (Hillebrand et al. 2018). We adopted a “case-study”
approach rather than a combined analysis given varying site characteristics, sampling times, and
data limitations.
Sites and Disturbance Descriptions
Fire - Great Smoky Mountains National Park, Tennessee
In November-December of 2016, a series of arson fires swept through the Great Smoky
Mountains National Park, burning over 6,800 ha. Portions of the affected range fell within the
study area of the National Ecological Observatory Network (NEON) Twin Creeks relocatable
terrestrial site (GRSM). We compared pre- (2016) and post-fire (2017) lidar data collected from
six NEON forest inventory plots (Atkins et al. 2018). Forests in GRSM are dominated by
overstory tulip poplar (Liriodendron tulipifera), oak (Quercus spp.), and red maple (Acer
rubrum), with rhododendron (Rhododendron maximum) and mountain laurel (Kalmia latifolia)
prominent in the understory.
Ice Storm damage - Hubbard Brook Experimental Forest, New Hampshire
Ice storms are ecologically influential disturbance agents in many areas of the eastern US,
including the forests of New England where return intervals can be fewer than 5 years (Irland
(HBEF) was initiated in 2015 to mimic the mechanical damage resulting from severe ice storms
(Rustad and Campbell 2012). Water was applied to vegetation during sub-zero conditions in
2015 to achieve varying levels of ice thickness--light (6 mm), moderate (12 mm), and heavy (19
mm). Lidar data were compared to assess the effects of ice on canopy structure by comparing
pre- and post-treatment data across severity levels (e.g. light, moderate, heavy) in 2015, 2016
and 2017. Forests in HBEF are dominated by American beech (Fagus grandifolia), yellow birch
(Betula alleghaniensis), and sugar maple (Acer saccharum).
Pathogen - Beech bark disease at Indian Point, MI
American beech bark disease (BBD) occurs following the invasion of a beech scale insect,
Cryptococcus fagisuga (Ehrlich 1934), and is widespread in North America (Cale et al. 2017).
The feeding by this insect causes two opportunistic fungi (Neonectria faginata & Neonectria
ditissima) to produce cankers on the bark, the continuous formation of which results in stem
girdling and subsequent tree death (Ehrlich 1934, Arthur et al. 2017). To examine the canopy
structural change resulting from BBD, we compared lidar data from 2014 and 2017 collected at
Indian Point (IP) in northern, lower Michigan. IP is also known as Colonial Point Memorial
Forest and is land held in trust by the Burt Lake Band of Chippewa and Ottawa Indians as well
as the University of Michigan Biological Station. We have opted to use the former name of the
area, Indian Point. IP is a relict forest dominated by large eastern hemlock (Tsuga canadensis),
American beech (Fagus grandifolia), and white pine (Pinus strobus).
Insect Infestation - Hemlock woolly Adelgid at Harvard Forest, MA
Hemlock woolly adelgid (HWA) is an invasive, aphid-like insect first reported in the United
states from Georgia to southern Maine, affecting millions of trees and threatening the range of
eastern hemlock. The insect can feed on all sizes and age classes of hemlock trees, often killing
trees within 10 years (Orwig and Foster 1998). At Harvard Forest, HWA was first seen on
Prospect Hill in 2008 and was widespread by 2012. By 2016, significant hemlock decline and
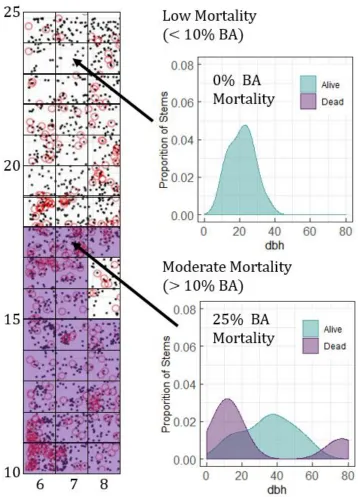
noticeable mortality began to occur (Orwig et al. 2018). Comparing lidar data collected in 2017
from areas of low and moderate infection (determined base on a 10% basal area mortality
threshold; Fig. A1) at Prospect Hill, we examined how HWA structurally altered hemlock forests
at Harvard Forest.
Successional Change/Senescence - University of Michigan Biological Station, MI
The Forest Accelerated Succession Experiment (FASET; for continuity we will use the
AmerifFlux ID for this site, US-UMd) located in northern, lower Michigan, USA, is a large-scale
manipulative experiment, in which 6,700 mature aspen (Populus spp.) and birch (Betula spp.)
trees were stem-girdled within a 39-ha area during 2008 to accelerate successional processes
leading to the decline of these early successional species (Nave et al. 2011, Gough et al. 2013).
The treatment forest is paired with a control site (University of Michigan Biological Station
AmeriFlux Core Site, US-UMB). We compared control and treatment site lidar in 2012 and
2016, respectively, with the supposition that 2016 represents further successional progress
compared to the control.
Chronic Acidification - Fernow Experimental Forest
Chronic atmospheric acid deposition is a persistent stress on many forests across the US but is of
acute concern in the Allegheny and Appalachian Mountains of West Virginia, Ohio,
Clean Air act amendments have helped mitigate this environmental stressor (Matthias et al.
2018), its legacy persists in altered soil chemistry, forest composition, and forest structure
(Warby et al. 2008, Horn et al. 2018). Manipulative experiments that include experimental
additions of acid-precursor compounds have been deployed across the country to address
ecosystem related questions surrounding acid deposition. Among these is a long-term experiment
at the Fernow Experimental Forest in West Virginia. Continuous, annual additions of ammonium
sulfate (35.5 kg N ha−1 yr−1 and 40.5 kg S ha−1 yr−1) began in watershed 3 of the Fernow
Experimental Forest in 1989 (Adams et al. 2007). This treatment watershed was paired with
control watershed 7 as part of the long-term Fernow Watershed Acidification Study. The
treatment watershed exhibited depletion of both calcium (Ca+) and magnesium (Mg+) (Adams et al. 2007) with cascading effects on vegetation. The control watershed is now a mixed-hardwood
forest comprised primarily of maple (Acer spp.), red oak (Quercus rubra) and tulip poplar
(Liriodendron tulipifera) while the treatment watershed is a mixed-hardwood forest dominated
by black cherry (Prunus serotina) and red maple (Acer rubrum). Lidar data collected in 2017
from treatment and control watersheds were compared to evaluate the effects of long-term acid
deposition on canopy structure..
Data Collection and Analyses
Canopy Structural Complexity
We collected site structural data using aa portable canopy lidar system equipped with a Riegl
3100VHS upward facing lidar unit. The development and operation of this terrestrial laser
scanning system is described in Parker et al. (2004) and Hardiman et al. ( 2011). Though site
transect sampling per plot, beyond the range required to achieve stable landscape level measures
of canopy structure (Hardiman et al. 2018). We derived canopy structural metrics using the
forestr package (Atkins et al. 2018a, d) in R 3.5 (R Core Team, 2018). forestr produces a suite of
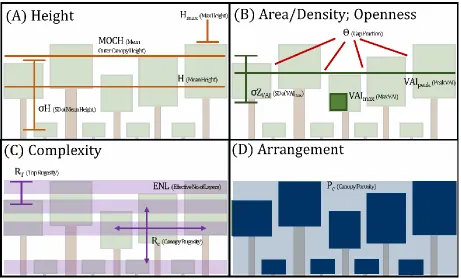
canopy structural metrics in five CST categories including descriptors of canopy area/density,
openness, height, complexity, and arrangement—outlined in table two (Table 2) and more fully
described in Atkins et al. (2018a).
Figure 3. Graphical representations of canopy structural measures for all five CSTs: height (A), area and density, openness (B), complexity (C), and arrangement categories described in full in table one and defined mathematically in Atkins et al. 2018b.
Random Forest Classification
We identified structural models for each disturbance agent using a random forest machine
learning classification approach with the randomForest package (Liaw and Wiener 2002).
that is based on predictor values and known classes (Cutler et al. 2007). This technique has been
useful in other related, data rich ecological applications (Juel et al. 2015, Belgiu and Drăguţ
2016, Atkins et al. 2018e; Barnes et al. In Review). Random forest combines information from a
series of uncorrelated models (decisions trees) into a composite classification with a statistical
breakdown that shows which variables are the most significant in contrasting known classes by
describing how influential they are to model accuracy. Variables with a larger mean decrease in
accuracy are more influential in the classification process, while the mean decrease in Gini
coefficient describes the homogeneity of the output based on a given variable. We used a
two-step procedure to produce a parsimonious random forest structural model for each disturbance
agent. We first built “kitchen sink” models using the full suite of canopy structural metrics as
predictors. Then we produced more parsimonious models through an iterative process of
parameter selection using only the most influential parameters from the “kitchen sink” models
focused on minimizing out-of-box error while constraining the number of input parameters. We
compared the resulting multivariate models to VAI-only models produced using the same
random forest classification with only VAI as a predictive variable. For basis of comparison as
well as to follow convention, we also included a parametric statistical approach using student’s
T-test (Table A1) with effect size calculations (Cohen’s d) to characterize all disturbance
comparisons.
RESULTS
Fire - Great Smoky Mountains National Park, Tennessee
Ground fire at GRSM reduced VAI primarily in the understory, which is comprised of R.
maximum and K. latifolia. The structural model included reductions to vegetation area (VAI), the
peak canopy VAI or the average height of maximum VAI (VAIpeak) and increases in mean outer
VAIpeak decreased from 3.2 to 2.5, while MOCH increased from 20.0 m to 24.2 m as the
allocation of vegetation in the upper canopy increased relative to the fire-impacted subcanopy.
Of the 13 post-fire scans, 11 were correctly classified, as were 11 of the 14 pre-fire scans, for a
15.4 to 21.4% classification error rate, respectively, with a total OOB error of 18.5% compared
to the VAI-only model which had a classification error of 25.9% (Table 3). T-test results indicate
that fire significantly reduced overall VAI (p = 0.002) with a very large effect observed between
pre- and post-disturbance plots (d = 1.33; Table A1).
Ice Storm – Hubbard Brook Experimental Forest (HBEF)
Across all severity levels (light, moderate, and heavy), ice primarily affected VAI in the upper
canopy. The structural model included decreases in the height of peak vegetation area (VAIpeak),
while the heavy and moderate severity levels showed increased variability in canopy height. In
the heavy ice treatment, VAIpeak shifted downward from 3.4 to 2.2, in the moderate treatment
from 3.4 to 2.6, and in the light treatment from 3.6 to 2.9. Structural variability, expressed in the
model as σZVAI—the standard deviation of the height of peak VAI—increased in the heavy
treatment from 3.8 to 6.6 m, and in the moderate treatment from 3.9 to 5.4 m. The structural
model of the light ice treatment retained overall maximum leaf area (VAImax), which decreased
from 6.7 to 5.4. Classification accuracy increased with disturbance severity, indicating severe ice
disturbance modified the canopy in a more consistent way. All 20 of the scans for the heavy
treatment were classified correctly for an OOB error rate of 0%. 39 of the 40 moderate severity
scans were classified correctly for an OOB error rate of 2.5%. 17 of 20 light severity scans were
classified correctly for an OOB rate of 15%. Classification errors for VAI-only models were
parametric, t-test approach were only observed for moderate (p = 0.002; d = 1.06) and heavy (p =
<0.001; d = 1.96) treatments.
Pathogen – Beech bark disease at Indian Point, MI
Beech bark disease made canopies more porous and open over time as diffuse mortality of
canopy trees advanced. However, the overall density of vegetation area in the densest areas of
the forest increased, likely a function of increased forest floor light availability resulting in the
growth release of lower canopy seedlings and saplings. Canopy porosity (PC) increased as the
infestation progressed from 0.6 in 2014 to 0.7 in 2017, while VAImax increased from 5.1 to 6.7.
17 of 19 scans for 2014 and 40 of 43 scans for 2017 classified correctly, 10.5% and 4.7% success
rate respectively for a total OOB error rate of 6.6%. Classification errors for the VAI-only model
was higher (42.6%) and no significant differences or effects were observed in VAI from the
parametric approach.
Insect Defoliation - Hemlock woolly Adelgid at Harvard Forest, MA
Areas more severely affected by hemlock woolly adelgid were more structurally complex, great
canopy layering and more variable heights. A change in canopy layering is likely caused by a
progression of foliar loss from the lower to upper crown as infection expands. The structural
model included top rugosity (RT) and the effective number of layers (ENL). High mortality areas
of the forest were more complex (RT = 3.5 m; ENL = 17.3) than low mortality areas (RT = 2.9 m;
ENL = 15.3). 4 of the 6 high mortality scans were classified correctly by the model, as were 7 of
VAI-only model was higher (35.7%) and no significant differences or effects were observed in
VAI from the parametric approach.
Successional Change/Senescence - University of Michigan Biological Station, MI
Senescence of early successional trees reduced canopy complexity, lowered the height of the
densest concentration of leaves, and produced a more open canopy, pointing to a homogenization
of canopy structure as the tallest trees died. The structural model included RC, σZVAI, PC, and H.
Four years following the commencement of tree decline, treatment and control RC was 10.5 m
and 13.1 m, H was 8.1 m and 9.2 m, PC was 0.70 and 0.7, and σZVAI was 4.6 m and 5.4,
respectively. Eight-years after treatment, disturbed and control forest canopy complexity,
maximum canopy height, and the variability of canopy height diverged even more. The 8-year
structural model included Rc, Hmax, and RT, which were 8.0 m to 14.3 m, 19.8 m to 23.3 m, and
4.6 m to 5.9 m in treatment and control forests, respectively. For 2012 scans, 90 of the 99 control
scans (US-UMB) were classified correctly, while 62 of 76 treatment scans (US-UMd) were
classified correctly for a total OOB error rate of 13.1% For 2016 scans, 40 of the 44 control
scans (US-UMB) were classified correctly, while 9 of 18 treatment scans (US-UMd) were
classified correctly for a total OOB error rate of 20.9% No significant differences or effects were
observed in VAI. Classification errors for VAI-only models were higher for both years (2012 –
48.0%; 2016 – 53.2%) and no significant differences or effects were observed in VAI from the
parametric approach.
Chronic Acidification – Fernow Experimental Forest
Chronic acid deposition resulted in a taller canopy that was more porous, open, and variable than
coincided with a more open subcanopy. The control canopy was shorter and vegetation more
dispersed. The nitrogen and sulfur amended forest was associated with a higher canopy,
suggesting growth stimulation of the upper canopy, and a loss of subcanopy vegetation. The
structural model included maximum canopy height (Hmax), canopy porosity (PC), the standard
deviation of the height of maximum VAI density (σZVAI,), and the standard deviation of mean
leaf height (σH). In comparing treatment and control sites, respectively, acid deposition
increased canopy porosity from 0.6 to 0.7, elevated Hmax from 24.6 m to 27 m, enhanced
variance in the height of VAImax from 6.2 to 7.8 and raised the variance in mean leaf height from
4.5 m to 5.5 m. 14 of 17 scans from the treatment watershed and 10 of 13 scans from the control
watershed were classified correctly, 17.6 and 23.0% success rates, respectively with a total OOB
error rate of 20%. Classification error for the VAI-only model was higher (50%) and no
significant differences or effects were observed in VAI from the parametric approach.
Synthesis: Patterns of change among disturbance agents
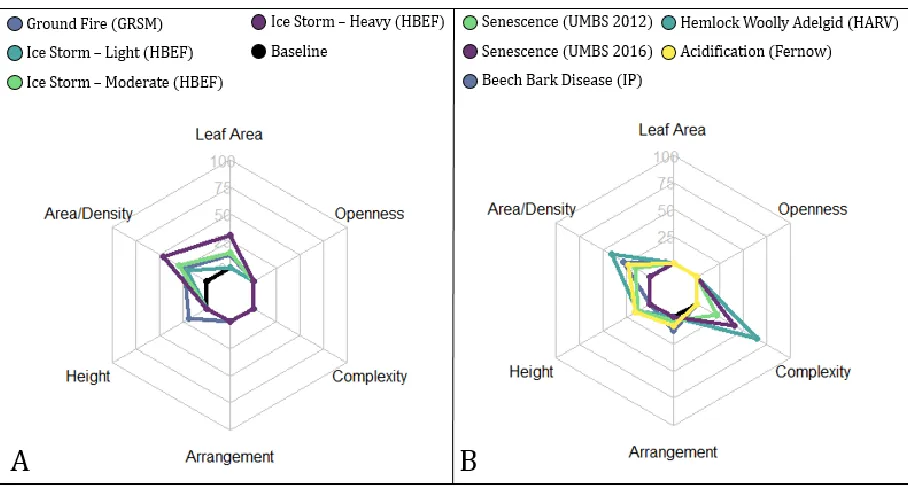
Though our ability to make broad generalizations about patterns of disturbance is limited by
replication, similarities among disturbance agents emerged (Fig. 4). Ice and fire, both pulse
disturbances, primarily reduced vegetation area/density and height (Fig. 4). In contrast,
disturbances from age-related senescence, pathogens, and acidification affected vegetation
arrangement and complexity (Tables 3, 4; Fig. 4). Structural differentiation from beech bark
disease, which is both a pathogen and an insect syndrome disturbance, is described by changes in
area/density and arrangement (Table 2). Not only is there direct, physical loss of vegetation
through defoliation, but also whole tree mortality which creates gaps in the canopy that change
in stark contrast to disturbance agents such as fire, ice or acidification that at low to moderate
levels rarely if at all result in whole tree senescence. These emergent similarities inform our
understanding of structural differentiation we observe among disturbance agents.
Figure 4. Relative change (%) for ground fire and ice (A) and senescence, hemlock woolly adelgid, beech bark disease and chronic acidification (B) based on the absolute value of percentage change for leaf area, and for canopy structural traits defined in table two and illustrated in figure three.
DISCUSSION
Our findings support our hypothesis that canopy structural differentiation arises due to the
individual agent of a given disturbance, as each disturbance agent altered a unique combination
of canopy structural traits (Table 3). As hypothesized, fire and ice modified the amount and
distribution of leaf area within the canopy, while pathogens, insect, age-related senescence, and
acidification changed canopy arrangement, height, and/or complexity. Among the six
disturbance agents examined, only two reduced leaf area (Table A1) and only the structural
model for fire retained VAI as an influential parameter, demonstrating that moderate severity
CSTs (Fig 5; Tables 3, A1). Rather than modifying a single structural trait such as leaf area, most
disturbances varied in the individual measures of canopy structure they altered yet, patterns in
the CSTs altered were evident among disturbance agents—with fire and ice best described by
how they affect the amount of leaf area and its variability, while other disturbances were
described by how they alter canopy complexity traits (Fig. 4).
Beyond Singular Measures of Structural Change
Our results suggest that the characterization of disturbance-related changes as leaf area alone
fails to adequately characterize or distinguish the structural outcomes of disturbed relative to
undisturbed areas. We found moderate severity disturbance agents can, but often do not, reduce
total leaf area. This is likely because slower acting disturbances (e.g. pathogens, insects,
age-related senescence) allow sufficient time for compensatory foliar replacement to occur as
mortality progresses (Raffa et al. 2008, Gherlenda et al. 2016)—either through regrowth or
subcanopy response. In contrast, disturbances such as fire and extreme weather events, occur
abruptly and may temporarily reduce leaf area (Bond-Lamberty et al. 2002, Beringer et al. 2003).
Four of the disturbance agents surveyed were best characterized by metrics that describe changes
in leaf area location, density, or variance rather than total leaf area. In our study, only two of the
disturbance agents we examined significantly reduced leaf area based on traditional parametric
statistical tests--fire (GRSM) with a 10.2% reduction and ice with 13.9% and 26.2% reductions
at moderate and heavy ice loads, respectively (table A1)—but again, only fire included leaf area
as parameter in the multivariate structural model (Table 2). These observed reductions in leaf
following an ice storm in Quebec (Colpron-Tremblay and Lavoie 2010); a 10-30% reduction in
canopy cover following hurricane-force winds in North Carolina (Busing et al. 2009); 33%
reduction in leaf area following ice storms in the northeastern US (Rhoads et al. 2002); and a
30% reduction in leaf area following drought in northern Arizona (Classen et al. 2006). Despite
similarities in the magnitude of change relative to those studies, reductions in leaf area from fire
and ice were concentrated in different canopy strata (Figs. A2 & A3) – from appendix), a
dimensional structural change not captured by dimensionless measures of total leaf area. Further,
using only statistical parametric approaches using leaf area, the ice and fire disturbances
surveyed would be the only instances where we would have detected disturbance. Together,
these findings strongly support our conclusions that moderate severity disturbances cannot be
distinguished solely based on changes in leaf area, but rather, multiple attributes of structural
change are required to describe and detect canopy structural differentiation.
Beyond leaf area, our analysis shows that changes in individual measures of canopy traits, even
integrative measures, are insufficient to characterize structural differentiation among disturbance
agents. For example, canopy rugosity, an integrative complexity measure strongly tied to
ecosystem functioning (Atkins et al. 2018b; Gough et al. 2019), changed in response to
disturbance in only half of the disturbance agents surveyed (Fig. 5). Moreover, the directionality
of change in canopy complexity, when it occurred, was mixed. Ice storms (HBEF) and insect
invasion (HARV) increased canopy complexity while age-related senescence (US-UMd)
Figure 5. At top, canopy rugosity by site and disturbance (e.g. control vs treatment, low to high, pre- and post). At bottom, vegetation area index as same. For HBEF, L/M is the combination of the low and moderate treatments, and H/D is the average of the heavy and double treatments.
Consistency of agent-specific structural differentiation
We found that model classification error differed among disturbance agents, indicating
variability in the consistency of structural differentiation among disturbance agents. We observed
low model classification error for ice storms, pathogens and beech bark disease, which suggests
these disturbances imposed similar, more uniform structural changes within sampled
landscapes—that any affected section of the canopy looked like other affected areas. In contrast,
models of age-related senescence, acidification, hemlock woolly adelgid, and fire had higher
classification errors, an indication that the structural differentiation that results from these
structural change may be related to the distribution and timing of tree mortality. For example,
both the rate and spatial pattern of pest and pathogen tree mortality is linked to invader-specific
feeding (Orwig and Foster 1998), mating, and dispersal patterns (Walter et al. 2016). Our models
for pathogen and insect infestation may be more well constrained because targeted-tree species
are distributed evenly on the landscape. For example, hemlocks, including those at Harvard
Forest surveyed here, often grow in dense monospecific stands on uniform soils. At the
individual tree scale, the advance of wooly adelgid within an infected crown proceeds uniformly
from the lower to upper crown (Orwig and Foster 1998). In contrast, the distribution of tree
mortality following ground fires in compositionally diverse forests, such as GRSM, may be
much more variable because of large spatial differences in burn severity associated with
small-scale changes in microclimate, topography, fuel load, and the abundance of fire-susceptible
species and individuals (Hengst and Dawson 1994) (Morton et al. 2011, Turner et al. 2016).
Despite apparent differences in structural outcomes among disturbance agents, we cannot discard
the possibility that our observations were dependent upon site conditions, such as spatial
variation in vegetation composition, stand age, and existing structure, which could affect the
uniformity of structural change within each disturbed landscape. Alternatively, it could be argued
that disturbance agents with lower classification errors simply create greater structural
differentiation from treatment or unaffected errors than those with higher classification errors.
Application: the detection of moderate severity disturbance through remote sensing
Our findings suggest that the detection of moderate severity disturbance through remote sensing
requires an approach that relies less heavily on vegetation area or quantity but rather considers
multiple dimensions of structural change. Disturbance detection via conventional passive optical
al. 1999, Cohen and Goward 2004, Classen et al. 2006, Frolking et al. 2009, Cohen et al. 2016),
vegetation cover (Cohen and Goward 2004, Stojanova et al. 2010), or greenness (Atkins et al.
2018c). Our results strongly suggest that optical remote sensing methods may fail to detect low
to moderate severity disturbances that rearrange, rather than reduce total leaf area. Optical
remote sensing from air- and spaceborne platforms has been repeatedly shown to successfully
detect rapidly occurring, coarse-scale disturbances that severely reduce leaf area or canopy cover
(Frolking et al. 2009). However, these methods are ill-suited for small-scale, diffuse, and/or low
to moderate severity disturbances (McDowell et al. 2015, Cohen et al. 2016), such as those from
insect pests and pathogens, which are increasing globally (Hicke et al. 2012, Simler-Williamson
et al. 2019). A reliance on changes in leaf area or cover also limits the ability of optical remote
sensing to detect disturbance agent or source. Newer spaceborne, active sensors (e.g. Global
Ecosystem Dynamics Investigation (GEDI) and IceSAT2) that explicitly map multidimensional
ecosystem structure offer a means to surmount these detection gaps and offer many potential
scaling advantages (Stavros et al. 2017, Hancock et al. 2019, Patterson et al. 2019). In the future,
the integration of long-term data records from optical remote sensing platforms (e.g. Landsat,
MODIS) with the structural detection abilities of active sensors (e.g. GEDI, IceSAT2) will
expand our ability to detect, identify, and estimate disturbance (McDowell et al. 2015).
While our study lays the foundation for future work by demonstrating the utility of CSTs to
characterize and detect moderate disturbance, we acknowledge the caveats and limitations. Our
case-study, observational approach shows the potential for this work, but does not control for site
effects or site interactions with disturbance, which could alter how ecosystems respond to a
necessary to evaluate the consistency of structural patterns within and among disturbance agents.
Additionally, we did not consider the effect of co-occurring or compounding disturbances, nor
did we investigate important disturbances such as drought, which will increasingly affect larger
areas at greater severities over this century (Adams et al. 2012, Gutierrez-Velez et al. 2014,
McDowell and Allen, 2015, Clark et al. 2016, Atkins and Agee 2019, Smith et al. 2019, Stovall
et al. 2019). Finally, our approach did not standardize for time-since-disturbance, a difficulty
given large agent-specific variation in the timing and duration of defoliation and/or tree
mortality. Despite these limitations, our work lays a foundation for how to characterize the
structural differentiation of disturbance agents and shows the degree, breadth, variation, and
functional implications of structural change among disturbance agents
CONCLUSIONS
Disturbance agents differ in how they reshape forest structure. The structural changes that result
from disturbance are often multidimensional, and the direction and magnitude of structural
change cannot be adequately summarized using a single variable, including leaf area. Instead,
disturbances are more completely described by measures of canopy structure that describe
canopy structural traits or CSTs. The functional implications of these divergent structural
changes may include differences in primary production (Hardiman et al. 2011, Stuart-Haëntjens
et al. 2015; Gough et al. 2019), light acquisition (Atkins et al. 2018b), response to drought
(Atkins and Agee 2019, Smith et al. 2019) ecosystem resistance (Gough et al. 2013),
resource-use efficiencies (Hardiman et al. 2011), and the cycling of nutrients (Likens et al. 1978, Jenkins
et al. 1999), carbon (Knohl et al. 2002, Lindroth et al. 2009, Nave et al. 2011, Birdsey and Pan
2015), and water (Aron et al. 2019, Matheny et al. 2014). We conclude that a
improve disturbance diagnostics, ecological forecasting, forest management, and earth system
modelling (Dietze and Matthes 2014, Fisher et al. 2018, Fahey et al. 2018). Future inquiry via
manipulative experiments and empirical surveys is needed to understand functional significance
of various measures of structural change. Linking terrestrial lidar derived measures of canopy
complexity to emergent air- and spaceborne platforms will further scale our ability to detect
disturbance related structural change at large spatial scales.
CODE AND ANALYSIS
References
Adams, H. D., C. H. Luce, D. D. Breshears, C. D. Allen, M. Weiler, V. C. Hale, A. M. S. Smith,
and T. E. Huxman. 2012. Ecohydrological consequences of drought- and infestation-
triggered tree die-off: insights and hypotheses. Ecohydrology 5:145–159.
Adams, M. B., J. N. Kochenderfer, and P. J. Edwards. 2007. The Fernow Watershed
Acidification Study: Ecosystem Acidification, Nitrogen Saturation and Base Cation
Leaching. Pages 267–273 in P. Brimblecombe, H. Hara, D. Houle, and M. Novak,
editors. Acid Rain - Deposition to Recovery. Springer Netherlands, Dordrecht.
Alencar, A., Nepstad, D., & Diaz, M. C. V. (2006). Forest understory fire in the Brazilian
Amazon in ENSO and non-ENSO years: area burned and committed carbon emissions.
Earth Interactions, 10(6), 1-17.
Amiro, B. D. 2001. Paired-tower measurements of carbon and energy fluxes following
disturbance in the boreal forest. Global Change Biology 7:253–268.
Aron, P. G., C. J. Poulsen, R. P. Fiorella, and A. M. Matheny. (n.d.). Stable Water Isotopes
Reveal Effects of Intermediate Disturbance and Canopy Structure on Forest Water
Cycling. Journal of Geophysical Research: Biogeosciences 0.
Arthur, M. a., K. c. Weathers, G. m. Lovett, M. p. Weand, and W. c. Eddy. 2017. A beech bark
disease induced change in tree species composition influences forest floor acid-base
chemistry. Canadian Journal of Forest Research 47:875–882.
Atkins, J., G. Bohrer, R. Fahey, B. Hardiman, C. Gough, T. Morin, A. Stovall, and N.
Zimmerman. 2018a. Quantifying vegetation and canopy structural complexity from
terrestrial LiDAR data using the forestr r package. Methods in Ecology and Evolution 10:
Atkins, J. W., R. T. Fahey, B. S. Hardiman, and C. M. Gough. 2018b. Forest Canopy Structural
Complexity and Light Absorption Relationships at the Subcontinental Scale. Journal of
Geophysical Research: Biogeosciences 123:1387–1405.
Atkins, J., G. Bohrer, R. Fahey, B. Hardiman, C. Gough, T. Morin, A. Stovall, and N.
Zimmerman. 2018d. forestr: Ecosystem and Canopy Structural Complexity Metrics from
LiDAR. R package version 1.0.1. https://CRAN.R-project.org/package=forestr
Atkins, J. W., and E. Agee. 2019. Phenological and structural linkages to seasonality inform
productivity relationships in the Amazon Rainforest. New Phytologist 222:1165–1166.
Atkins, J. W., H. E. Epstein, and D. L. Welsch. 2018e. Using Landsat imagery to map understory
shrub expansion relative to landscape position in a mid-Appalachian watershed.
Ecosphere 9:e02404.
Belgiu, M., and L. Drăguţ. 2016. Random forest in remote sensing: A review of applications and
future directions. ISPRS Journal of Photogrammetry and Remote Sensing 114:24–31.
Beringer, J., L. B. Hutley, N. J. Tapper, A. Coutts, A. Kerley, and A. P. O’Grady. 2003. Fire
impacts on surface heat, moisture and carbon fluxes from a tropical savanna in northern
Australia. International Journal of Wildland Fire 12:333–340.
Birdsey, R., & Pan, Y. (2015). Trends in management of the world’s forests and impacts on
carbon stocks. Forest Ecology and Management, 355, 83-90.
Boer, M. M., Sadler, R. J., Bradstock, R. A., Gill, A. M., & Grierson, P. F. (2008). Spatial scale
invariance of southern Australian forest fires mirrors the scaling behaviour of fire-driving
weather events. Landscape Ecology, 23(8), 899-913.
Bond-Lamberty, B., C. Wang, S. T. Gower, and J. Norman. 2002. Leaf area dynamics of a boreal
Buma, B. 2015. Disturbance interactions: characterization, prediction, and the potential for
cascading effects. Ecosphere 6:art70.
Busing, R. T., R. D. White, M. E. Harmon, and P. S. White. 2009. Hurricane disturbance in a
temperate deciduous forest: patch dynamics, tree mortality, and coarse woody detritus.
Plant Ecology 201:351–363.
Cale, J. A., M. T. Garrison-Johnston, S. A. Teale, and J. D. Castello. 2017. Beech bark disease in
North America: Over a century of research revisited. Forest Ecology and Management
394:86–103.
Changnon, S. A. 2003. Characteristics of Ice Storms in the United States. Journal of Applied
Meteorology 42:630–639.
Clark, J. S., L. Iverson, C. W. Woodall, C. D. Allen, D. M. Bell, D. C. Bragg, A. W. D’Amato,
F. W. Davis, M. H. Hersh, I. Ibanez, S. T. Jackson, S. Matthews, N. Pederson, M. Peters,
M. W. Schwartz, K. M. Waring, and N. E. Zimmermann. 2016. The impacts of increasing
drought on forest dynamics, structure, and biodiversity in the United States. Global
Change Biology 22:2329–2352.
Classen, A. T., S. C. Hart, T. G. Whitman, N. S. Cobb, and G. W. Koch. 2006. Insect
Infestations Linked to Shifts in Microclimate: Important Climate Change Implications.
Soil Science Society of America Journal 70:305–c.
Cohen, W. B., and S. N. Goward. 2004. Landsat’s Role in Ecological Applications of Remote
Sensing. BioScience 54:535–545.
Cohen, W. B., Z. Yang, S. V. Stehman, T. A. Schroeder, D. M. Bell, J. G. Masek, C. Huang, and
2012: The emerging dominance of forest decline. Forest Ecology and Management
360:242–252.
Colpron-Tremblay, J., and M. Lavoie. 2010. Long-term stand-scale dynamics of a boreal mixed
forest in Quebec, Canada. Review of Palaeobotany and Palynology 161:43–58.
Connell, J. H. 1978. Diversity in Tropical Rain Forests and Coral Reefs. Science 199:1302–
1310.
Cote, D., C. Lupi, R. Gagnon, D. Lord, and H. Morin. 2014. Growth dynamics of successive
post-fire cohorts of black spruce: Is site potential reduced? Forestry Chronicle 90:96–104.
Cutler, D. R., Edwards Jr, T. C., Beard, K. H., Cutler, A., Hess, K. T., Gibson, J., & Lawler, J. J.
2007. Random forests for classification in ecology. Ecology, 88(11), 2783-2792.
Dale, V. H., L. A. Joyce, S. McNulty, R. P. Neilson, M. P. Ayres, M. D. Flannigan, P. J. Hanson,
L. C. Irland, A. E. Lugo, C. J. Peterson, D. Simberloff, F. J. Swanson, B. J. Stocks, and
B. M. Wotton. 2001. Climate Change and Forest DisturbancesClimate change can affect
forests by altering the frequency, intensity, duration, and timing of fire, drought,
introduced species, insect and pathogen outbreaks, hurricanes, windstorms, ice storms, or
landslides. BioScience 51:723–734.
Dietze, M. C., and J. H. Matthes. 2014. A general ecophysiological framework for modelling the
impact of pests and pathogens on forest ecosystems. Ecology Letters 17:1418–1426.
Ehbrecht, M., P. Schall, C. Ammer, and D. Seidel. 2017. Quantifying stand structural complexity
and its relationship with forest management, tree species diversity and microclimate.
Ehbrecht, M., P. Schall, J. Juchheim, C. Ammer, and D. Seidel. 2016. Effective number of
layers: A new measure for quantifying three-dimensional stand structure based on
sampling with terrestrial LiDAR. Forest Ecology and Management 380:212–223.
Ehrlich, J. 1934. THE BEECH BARK DISEASE: A NECTRIA DISEASE OF FAGUS ,
FOLLOWING CRYPTOCOCCUS FAGI (BAER.). Canadian Journal of Research
10:593–692.
Fahey, R. T., Atkins, J. W., Gough, C. M., Hardiman, B. S., Nave, L. E., Tallant, J. M.,
Nadehoffer, K. J., Vogel, C. , Scheuermann, C. M., Stuart‐Haëntjens, E. , Haber, L. T.,
Fotis, A. T., Ricart, R. and Curtis, P. S. 2019a, Defining a spectrum of integrative trait‐
based vegetation canopy structural types. Ecology Letters. doi:10.1111/ele.13388
Fahey, R. T., B. C. Alveshere, J. I. Burton, A. W. D’Amato, Y. L. Dickinson, W. S. Keeton, C.
C. Kern, A. J. Larson, B. J. Palik, K. J. Puettmann, M. R. Saunders, C. R. Webster, J. W.
Atkins, C. M. Gough, and B. S. Hardiman. 2018. Shifting conceptions of complexity in
forest management and silviculture. Forest Ecology and Management 421:59–71.
Fahey, R. T., A. T. Fotis, and K. D. Woods. 2015. Quantifying canopy complexity and effects on
productivity and resilience in late-successional hemlock–hardwood forests. Ecological
Applications 25:834–847.
Fahey, RT, JW Atkins, JL Campbell, LE Rustad, M Duffy, CT Driscoll, TJ Fahey, PG Shaberg.
2019b. Effects of an Experimental Ice Storm on Forest Canopy Structure. In Press at
Canadian Journal of Forest Research
Fisher, R. A., C. D. Koven, W. R. L. Anderegg, B. O. Christoffersen, M. C. Dietze, C. E. Farrior,
J. A. Holm, G. C. Hurtt, R. G. Knox, P. J. Lawrence, J. W. Lichstein, M. Longo, A. M.
Shuman, B. Smith, A. T. Trugman, T. Viskari, H. Verbeeck, E. Weng, C. Xu, X. Xu, T.
Zhang, and P. R. Moorcroft. 2018. Vegetation demographics in Earth System Models: A
review of progress and priorities. Global Change Biology 24:35–54.
Foster, D. R., M. Fluet, and E. R. Boose. 1999. Human or Natural Disturbance: Landscape-Scale
Dynamics of the Tropical Forests of Puerto Rico. Ecological Applications 9:555–572.
Frelich, L. E., & Lorimer, C. G. (1991). Natural disturbance regimes in hemlock‐hardwood
forests of the upper Great Lakes region. Ecological monographs, 61(2), 145-164.
Frelich, L. E., & Reich, P. B. (1999). Minireviews: neighborhood effects, disturbance severity,
and community stability in forests. Ecosystems, 2(2), 151-166.
Frolking, S., M. W. Palace, D. B. Clark, J. Q. Chambers, H. H. Shugart, and G. C. Hurtt. 2009.
Forest disturbance and recovery: A general review in the context of spaceborne remote
sensing of impacts on aboveground biomass and canopy structure. Journal of
Geophysical Research: Biogeosciences 114.
Gherlenda, A. N., J. L. Esveld, A. A. G. Hall, R. A. Duursma, and M. Riegler. 2016. Boom and
bust: rapid feedback responses between insect outbreak dynamics and canopy leaf area
impacted by rainfall and CO2. Global Change Biology 22:3632–3641.
Gough, C. M., J. W. Atkins, R. T. Fahey, and B. S. Hardiman. 2019. High rates of primary
production in structurally complex forests. Ecology 100:e02864.
Gough, C. M., B. S. Hardiman, L. E. Nave, G. Bohrer, K. D. Maurer, C. S. Vogel, K. J.
Nadelhoffer, and P. S. Curtis. 2013. Sustained carbon uptake and storage following
Gutierrez-Velez, V. H., M. Uriarte, R. DeFries, M. Pinedo-Vasquez, K. Fernandes, P. Ceccato,
W. Baethgen, and C. Padoch. 2014. Land cover change interacts with drought severity to
change fire regimes in Western Amazonia. Ecological Applications 24:1323–1340.
Hancock, S., Armston, J., Hofton, M., Sun, X., Tang, H., Duncanson, L. I., ... & Dubayah, R.
2019. The GEDI simulator: a large‐footprint waveform Lidar simulator for calibration
and validation of spaceborne missions. Earth and Space Science, 6(2), 294-310.
https://agupubs.onlinelibrary.wiley.com/doi/full/10.1029/2018EA000506.
Hanson, J. J., and C. G. Lorimer. 2007. Forest Structure and Light Regimes Following Moderate
Wind Storms: Implications for Multi-Cohort Management. Ecological Applications
17:1325–1340.
Hardiman, B. S., G. Bohrer, C. M. Gough, and P. S. Curtis. 2013. Canopy Structural Changes
Following Widespread Mortality of Canopy Dominant Trees. Forests 4:537–552.
Hardiman, B. S., G. Bohrer, C. M. Gough, C. S. Vogel, and P. S. Curtis. 2011. The role of
canopy structural complexity in wood net primary production of a maturing northern
deciduous forest. Ecology 92:1818–1827.
Hardiman, B. S., E. A. LaRue, J. W. Atkins, R. T. Fahey, F. W. Wagner, and C. M. Gough.
2018. Spatial Variation in Canopy Structure across Forest Landscapes. Forests 9:474.
Havill, N. P., M. E. Montgomery, G. Yu, S. Shiyake, and A. Caccone. 2006. Mitochondrial DNA
from Hemlock Woolly Adelgid (Hemiptera: Adelgidae) Suggests Cryptic Speciation and
Pinpoints the Source of the Introduction to Eastern North America. Annals of the
Hengst, G. E., and J. O. Dawson. 1994. Bark properties and fire resistance of selected tree
species from the central hardwood region of North America. Canadian Journal of Forest
Research 24:688–696.
Hicke, J. A., C. D. Allen, A. R. Desai, M. C. Dietze, R. J. Hall, E. H. (Ted) Hogg, D. M.
Kashian, D. Moore, K. F. Raffa, R. N. Sturrock, and J. Vogelmann. 2012. Effects of
biotic disturbances on forest carbon cycling in the United States and Canada. Global
Change Biology 18:7–34.
Horn, K. J., R. Q. Thomas, C. M. Clark, L. H. Pardo, M. E. Fenn, G. B. Lawrence, S. S. Perakis,
E. A. H. Smithwick, D. Baldwin, S. Braun, A. Nordin, C. H. Perry, J. N. Phelan, P. G.
Schaberg, S. B. S. Clair, R. Warby, and S. Watmough. 2018. Growth and survival
relationships of 71 tree species with nitrogen and sulfur deposition across the
conterminous U.S. PLOS ONE 13:e0205296.
Irland, L. C. 2000. Ice storms and forest impacts. Science of The Total Environment 262:231–
242.
Jimenez, J. A., A. E. Lugo, and G. Cintron. 1985. Tree Mortality in Mangrove Forests.
Biotropica 17:177–185.
Johnstone, J. F., C. D. Allen, J. F. Franklin, L. E. Frelich, B. J. Harvey, P. E. Higuera, M. C.
Mack, R. K. Meentemeyer, M. R. Metz, G. L. Perry, T. Schoennagel, and M. G. Turner.
2016. Changing disturbance regimes, ecological memory, and forest resilience. Frontiers
in Ecology and the Environment 14:369–378.
Juel, A., G. B. Groom, J.-C. Svenning, and R. Ejrnæs. 2015. Spatial application of Random
of aerial orthophoto and DEM data. International Journal of Applied Earth Observation
and Geoinformation 42:106–114.
Kinnaird, M. F., & O’Brien, T. G. (1998). Ecological effects of wildfire on lowland rainforest in
Sumatra. Conservation Biology, 12(5), 954-956.
Ł aska, G. 2001. The disturbance and vegetation dynamics: a review and an alternative
framework. Plant Ecology 157:77–99.
LaRue, E. A., B. S. Hardiman, J. M. Elliott, and S. Fei. 2019. Structural diversity as a predictor
of ecosystem function. Environmental Research Letters.
Liaw, A., and M. Wiener. 2002. Classification and Regression by randomForest 2:6.
Lowman, M. D., & Rinker, H. B. (2004). Forest canopies. Elsevier.
Matheny, A. M., G. Bohrer, C. S. Vogel, T. H. Morin, L. He, R. P. de M. Frasson, G.
Mirfenderesgi, K. V. R. Schäfer, C. M. Gough, V. Y. Ivanov, and P. S. Curtis. 2014.
Species-specific transpiration responses to intermediate disturbance in a northern
hardwood forest: Transpiration response to disturbance. Journal of Geophysical
Research: Biogeosciences 119:2292–2311.
Mathias, J. M., & Thomas, R. B. (2018). Disentangling the effects of acidic air pollution,
atmospheric CO 2, and climate change on recent growth of red spruce trees in the Central
Appalachian Mountains. Global change biology, 24(9), 3938-3953.
McDowell, N. G., & Allen, C. D. (2015). Darcy's law predicts widespread forest mortality under
climate warming. Nature Climate Change, 5(7), 669.
McDowell, N. G., N. C. Coops, P. S. A. Beck, J. Q. Chambers, C. Gangodagamage, J. A. Hicke,
C. Huang, R. Kennedy, D. J. Krofcheck, M. Litvak, A. J. H. Meddens, J. Muss, R.
C. Xu, M. Zhao, S. W. Running, and C. D. Allen. 2015. Global satellite monitoring of
climate-induced vegetation disturbances. Trends in Plant Science 20:114–123.
McMahon, S. M., D. P. Bebber, N. Butt, M. Crockatt, K. Kirby, G. G. Parker, T. Riutta, and E.
M. Slade. 2015. Ground based LiDAR demonstrates the legacy of management history to
canopy structure and composition across a fragmented temperate woodland. Forest
Ecology and Management 335:255–260.
Morton, D. C., R. S. DeFries, J. Nagol, C. M. Souza, E. S. Kasischke, G. C. Hurtt, and R.
Dubayah. 2011. Mapping canopy damage from understory fires in Amazon forests using
annual time series of Landsat and MODIS data. Remote Sensing of Environment
115:1706–1720.
Nave, L. E., C. M. Gough, K. D. Maurer, G. Bohrer, B. S. Hardiman, J. L. Moine, A. B. Munoz,
K. J. Nadelhoffer, J. P. Sparks, B. D. Strahm, C. S. Vogel, and P. S. Curtis. 2011.
Disturbance and the resilience of coupled carbon and nitrogen cycling in a north
temperate forest. Journal of Geophysical Research: Biogeosciences 116.
Oldfield, C. A., and C. J. Peterson. 2019. Woody Species Composition, Diversity, and Recovery
Six Years after Wind Disturbance and Salvage Logging of a Southern Appalachian
Forest. Forests 10:129.
Orwig, D. A., and D. R. Foster. 1998. Forest Response to the Introduced Hemlock Woolly
Adelgid in Southern New England, USA. The Journal of the Torrey Botanical Society
125:60–73.
Parker, G. G., and M. J. Brown. 2000. Forest Canopy Stratification—Is It Useful? The American
Parker, G. G., D. J. Harding, and M. L. Berger. 2004. A portable LIDAR system for rapid
determination of forest canopy structure. Journal of Applied Ecology 41:755–767.
Patterson, P. L., S. P. Healey, G. S. ahl, S. Saarela, S. Holm, H.-E. Andersen, R. O. Dubayah, L.
Duncanson, S. Hancock, J. Armston, J. R. Kellner, W. B. Cohen, and Z. Yang. 2019.
Statistical properties of hybrid estimators proposed for GEDI—NASA’s global
ecosystem dynamics investigation. Environmental Research Letters 14:065007.
Peterson, C. J. 2019. Damage Diversity as a Metric of Structural Complexity after Forest Wind
Disturbance. Forests 10:85.
Pickett, S. T. A., & White, P. S. l985. The Ecology of Natural Disturbance and Patch Dynamics.
Plotkin, A. B., D. Foster, J. Carlson, and A. Magill. 2013. Survivors, not invaders, control forest
development following simulated hurricane. Ecology 94:414–423.
Raffa, K. F., B. H. Aukema, B. J. Bentz, A. L. Carroll, J. A. Hicke, M. G. Turner, and W. H.
Romme. 2008. Cross-scale Drivers of Natural Disturbances Prone to Anthropogenic
Amplification: The Dynamics of Bark Beetle Eruptions. BioScience 58:501–517.
Roberts, M. R. (2007). A conceptual model to characterize disturbance severity in forest
harvests. Forest Ecology and Management, 242(1), 58-64.
Rhoads, A. G., S. P. Hamburg, T. J. Fahey, T. G. Siccama, E. Hane, J. J. Battles, C. V. Cogbill,
J. Randall, and G. Wilson. 2002. Effects of an intense ice storm on the structure of a
northern hardwood forest.
Rustad, L. E., and J. L. Campbell. 2012. A novel ice storm manipulation experiment in a
northern hardwood forest. Canadian Journal of Forest Research 42:1810–1818.
Shiklomanov, A. N., B. A. Bradley, K. M. Dahlin, A. M. Fox, C. M. Gough, F. M. Hoffman, E.
change experiments through integration of remote-sensing techniques. Frontiers in
Ecology and the Environment 17:215–224.
Simler-Williamson, A. B., D. M. Rizzo, and R. C. Cobb. 2019. Interacting Effects of Global
Change on Forest Pest and Pathogen Dynamics. Annual Review of Ecology, Evolution,
and Systematics 50:null.
Smith, M. N., S. C. Stark, T. C. Taylor, M. L. Ferreira, E. de Oliveira, N. Restrepo‐Coupe, S.
Chen, T. Woodcock, D. B. dos Santos, L. F. Alves, M. Figueira, P. B. de Camargo, R. C.
de Oliveira, L. E. O. C. Aragão, D. A. Falk, S. M. McMahon, T. E. Huxman, and S. R.
Saleska. 2019. Seasonal and drought-related changes in leaf area profiles depend on
height and light environment in an Amazon forest. New Phytologist 222:1284–1297.
Stavros, E. N., D. Schimel, R. Pavlick, S. Serbin, A. Swann, L. Duncanson, J. B. Fisher, F.
Fassnacht, S. Ustin, R. Dubayah, A. Schweiger, and P. Wennberg. 2017. ISS
observations offer insights into plant function. Nature Ecology & Evolution 1:0194.
Stark, S. C., Leitold, V., Wu, J. L., Hunter, M. O., de Castilho, C. V., Costa, F. R., ... & Keller,
M. (2012). Amazon forest carbon dynamics predicted by profiles of canopy leaf area and
light environment. Ecology letters, 15(12), 1406-1414.
Stojanova, D., P. Panov, V. Gjorgjioski, A. Kobler, and S. Džeroski. 2010. Estimating vegetation
height and canopy cover from remotely sensed data with machine learning. Ecological
Informatics 5:256–266.
Stovall, A. E. L., H. Shugart, and X. Yang. 2019. Tree height explains mortality risk during an
Stuart-Haëntjens, E. J., P. S. Curtis, R. T. Fahey, C. S. Vogel, and C. M. Gough. 2015. Net
primary production of a temperate deciduous forest exhibits a threshold response to
increasing disturbance severity. Ecology 96:2478–2487.
Turner, M. G., Gardner, R. H., O'neill, R. V., & O'Neill, R. V. (2001). Landscape ecology in
theory and practice (Vol. 401). New York: Springer.
Turner, M. G., T. G. Whitby, D. B. Tinker, and W. H. Romme. 2016. Twenty-four years after the
Yellowstone Fires: Are postfire lodgepole pine stands converging in structure and
function? Ecology 97:1260–1273.
Walter, J. A., A. L. Firebaugh, P. C. Tobin, and K. J. Haynes. 2016. Invasion in patchy
landscapes is affected by dispersal mortality and mate-finding failure. Ecology 97:3389–
3401.
Waring, R.H. and W.H. Schlesinger. 1985. Forest Ecosystems: Concepts and Management.
Academic Press, San Diego, 338pp. .
Warby, R. A. F., C. E. Johnson, and C. T. Driscoll. 2008. Changes in Aluminum Concentrations
and Speciation in Lakes Across the Northeastern U.S. Following Reductions in Acidic
Deposition. Environmental Science & Technology 42:8668–8674.
Weeks, B. C., S. P. Hamburg, and M. A. Vadeboncoeur. 2009. Ice storm effects on the canopy
structure of a northern hardwood forest after 8 years. Canadian Journal of Forest
Research 39:1475–1483.
White, P. S., & Jentsch, A. (2001). The search for generality in studies of disturbance and
ecosystem dynamics. In Progress in botany (pp. 399-450). Springer, Berlin, Heidelberg.
Woods, K. D. (2004). Intermediate disturbance in a late‐successional hemlock‐northern
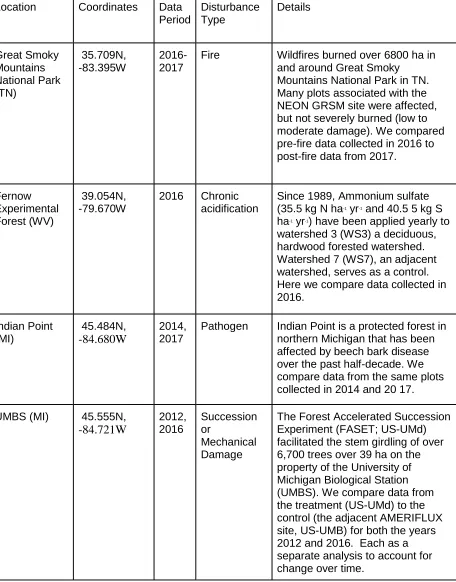
Table One. Site, data collection, and disturbance information.
Location Coordinates Data Period Disturbance Type Details Great Smoky Mountains National Park (TN) 35.709N, -83.395W 2016-2017
Fire Wildfires burned over 6800 ha in and around Great Smoky
Mountains National Park in TN. Many plots associated with the NEON GRSM site were affected, but not severely burned (low to moderate damage). We compared pre-fire data collected in 2016 to post-fire data from 2017.
Fernow Experimental Forest (WV) 39.054N, -79.670W 2016 Chronic acidification
Since 1989, Ammonium sulfate (35.5 kg N ha-1 yr-1 and 40.5 5 kg S ha-1 yr-1) have been applied yearly to watershed 3 (WS3) a deciduous, hardwood forested watershed. Watershed 7 (WS7), an adjacent watershed, serves as a control. Here we compare data collected in 2016. Indian Point (MI) 45.484N, -84.680W 2014, 2017
Pathogen Indian Point is a protected forest in northern Michigan that has been affected by beech bark disease over the past half-decade. We compare data from the same plots collected in 2014 and 20 17.
UMBS (MI) 45.555N,
-84.721W 2012, 2016 Succession or Mechanical Damage
Hubbard Brook (NH) 3.942N, -71.745W 2015-2017
Ice Storm The ISE was established in a 70-100-year-old mixed hardwood stand dominated by American beech (Fagus grandifolia), sugar maple (Acer saccharum), red maple (Acer rubrum) and yellow birch (Betula alleghaniensis). Ten 20 x 30 m plots were established in summer 2015, and pre-treatment measurement collections were initiated. Two plots were randomly assigned to each of five treatments with variable ice intensity targets and frequency: 1) Control; no experimental icing applied, i.e., 0 mm; 2) Low; 6.4 mm of ice in year 1 only; 3) Moderate; 12.7 mm of ice in year 1 only; 4) Double; 12.7 mm of ice in year 1 and year 2; and, 5) High; 19.0 mm of ice in year 1 only. Ice treatments were implemented during subfreezing conditions in 2016 (year 1; across five different dates) and 2017 (year 2; January 14). Ice addition was targeted toward the inner 10x20m of the plots, with a 10m wide buffer that was not unaffected by the
treatment making up the balance of the plot.
Harvard Forest (HF)
42.531N, -72.188W
2017 Hemlock Woolly Adelgid
HWA first seen in HF in 2008 and was widely distributed by 2012. Significant tree decline and
noticeable tree mortality was noted by 2016. We focused on a 60 x 150 m section of the ForestGEO plot located on Prospect Hill where there was concurrent tree mortality and lidar data. Low severity plots were chosen as those with less than 10% basal area mortality threshold (Fig. A1).
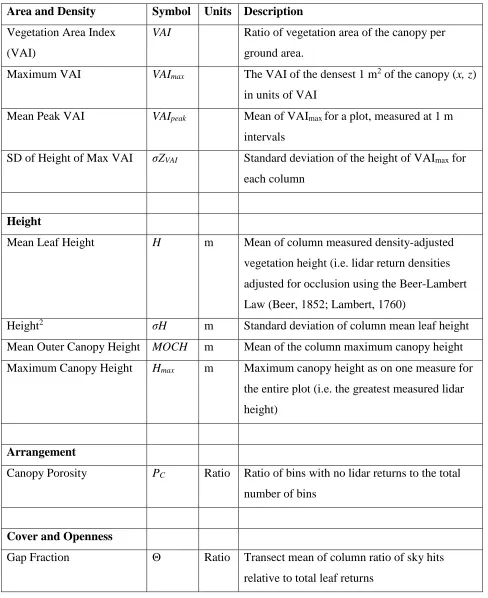
Table Two. Detailed description of canopy structural parameters derived from terrestrial lidar
using the forestr package in R. Table adapted from Atkins et al. 2018x
Area and Density Symbol Units Description
Vegetation Area Index
(VAI)
VAI Ratio of vegetation area of the canopy per
ground area.
Maximum VAI VAImax The VAI of the densest 1 m2 of the canopy (x, z)
in units of VAI
Mean Peak VAI VAIpeak Mean of VAImax for a plot, measured at 1 m
intervals
SD of Height of Max VAI σZVAI Standard deviation of the height of VAImax for
each column
Height
Mean Leaf Height H m Mean of column measured density-adjusted
vegetation height (i.e. lidar return densities
adjusted for occlusion using the Beer-Lambert
Law (Beer, 1852; Lambert, 1760)
Height2 σH m Standard deviation of column mean leaf height
Mean Outer Canopy Height MOCH m Mean of the column maximum canopy height
Maximum Canopy Height Hmax m Maximum canopy height as on one measure for
the entire plot (i.e. the greatest measured lidar
height)
Arrangement
Canopy Porosity PC Ratio Ratio of bins with no lidar returns to the total
number of bins
Cover and Openness
Gap Fraction Θ Ratio Transect mean of column ratio of sky hits
Complexity/Heterogeneity
Canopy Rugosity RC m Transect variability of column variability of leaf
density
Top Rugosity RT m Transect variability of column maximum
canopy height
Effective Number of
Layers
ENL Description of vertical canopy structure based
on the occupation of 1 m wide vertical layers by
canopy elements relative to the total space
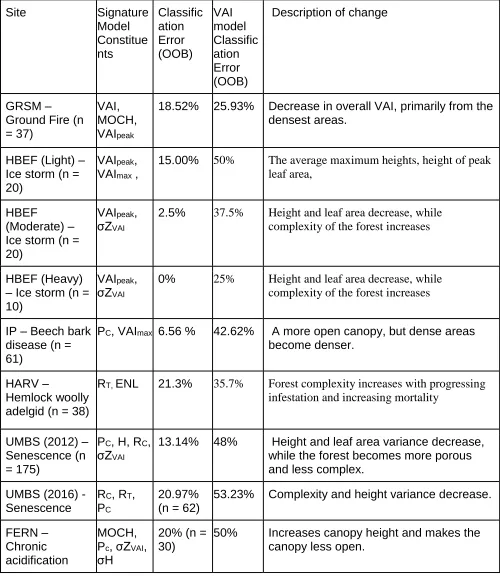
Table Three. Signature structural model output and error. n represents number of plots for analysis. Site Signature Model Constitue nts Classific ation Error (OOB) VAI model Classific ation Error (OOB)
Description of change
GRSM – Ground Fire (n = 37)
VAI, MOCH, VAIpeak
18.52% 25.93% Decrease in overall VAI, primarily from the
densest areas.
HBEF (Light) – Ice storm (n = 20)
VAIpeak,
VAImax ,
15.00% 50% The average maximum heights, height of peak
leaf area,
HBEF
(Moderate) – Ice storm (n = 20)
VAIpeak,
σZVAI
2.5% 37.5% Height and leaf area decrease, while
complexity of the forest increases
HBEF (Heavy) – Ice storm (n = 10)
VAIpeak,
σZVAI
0% 25% Height and leaf area decrease, while complexity of the forest increases
IP – Beech bark disease (n = 61)
PC, VAImax 6.56 % 42.62% A more open canopy, but dense areas
become denser.
HARV –
Hemlock woolly adelgid (n = 38)
RT, ENL 21.3% 35.7% Forest complexity increases with progressing
infestation and increasing mortality
UMBS (2012) – Senescence (n = 175)
PC, H, RC,
σZVAI
13.14% 48% Height and leaf area variance decrease,
while the forest becomes more porous and less complex.
UMBS (2016) - Senescence
RC, RT,
PC
20.97% (n = 62)
53.23% Complexity and height variance decrease.
FERN – Chronic acidification
MOCH, Pc, σZVAI,
σH
20% (n = 30)
50% Increases canopy height and makes the
Appendix