Article
1
Determination of Acrylamide in Biscuits by
High-2
Resolution
Orbitrap
Mass Spectrometry: Validation
3
and Application
4
Cristiana L. Fernandes 1, Daniel O. Carvalho 1 and Luis F. Guido 1,*
5
1 REQUIMTE – Departamento de Química e Bioquímica, Faculdade de Ciências, Universidade do Porto, Rua do Campo
6
Alegre 687, 4169-007 Porto, Portugal
7
* Correspondence: lfguido@fc.up.pt; Tel.: +351-220-402-644
8
Abstract: Acrylamide (AA), a molecule which potentially increases the risk of developing cancer, is
9
easily formed in food rich in carbohydrates, such as biscuits, wafers and breakfast cereals, at
10
temperatures above 120 °C. Thus, it is eminent the need to detect and quantify the AA content in
11
processed foodstuffs, in order to delineate the limits and mitigation strategies. This work reports
12
the development and validation of a high-resolution mass spectrometry-based methodology for
13
identification and quantification of AA in specific food matrices of biscuits, by using LC-MSn with
14
electrospray ionization and Orbitrap as mass analyser. The developed analytical method showed
15
good repeatability (RSDr 11.1%) and 3.55 g kg-1 and 11.8 g kg-1 as limit of detection (LOD) and
16
limit of quantification (LOQ), respectively. The choice of multiplexed targeted-SIM mode (t-SIM)
17
for AA and AA-d3 isolated ions provided enhanced detection sensitivity, as demonstrated in this
18
work. Statistical processing of data was performed in order to compare the AA levels with several
19
production parameters, such as time/cooking temperature, placement on the cooking conveyor belt,
20
color and moisture for different biscuits. The composition of the raw materials was statistically the
21
most correlated factor with the AA content when all samples are considered. The statistical
22
treatment presented herein enables an important prediction of factors influencing AA formation in
23
biscuits contributing for putting in place effective mitigation strategies.
24
Keywords: acrylamide, biscuits, mitigation measures, benchmark levels, contaminant
25
26
1. Introduction
27
Once Tareke et al [1] have reported acrylamide (AA) as a carcinogen formed in heated foodstuffs
28
the food industry, Member States of the European Union and the European Commission have made
29
considerable efforts to investigate AA formation pathways in order to reduce the levels of this
30
compound in processed foods. Besides being present in foods, AA has also been found in the
31
environment (due to industrial discharges), cosmetics, drinking water as well as tobacco smoke.
32
Human exposure to AA may be by ingestion, inhalation or contact with the skin [2]. Dietary exposure
33
is the most concerning, since about 40% of the food may contain this compound. Between 10 and 50%
34
of AA of the diet of pregnant women passes through the placenta and breast milk also contains this
35
toxin [3]. In the US, most exposure to AA comes from potato chips, breads, cereals, crackers and other
36
snacks [4]. In Europe, toasted bread, coffee and potatoes are the main food sources of AA [5].
37
Human exposure to AA may have toxicological effects (neurotoxicity, genotoxicity,
38
carcinogenicity and reproductive toxicity), and AA has been classified as carcinogenic by the
39
International Agency for Research on Cancer [6] in the 2nd group (probably carcinogenic in humans).
40
AA has an α,β-unsaturated carbonyl group with electrophilic reactivity, which can react with
41
nucleophilic groups of biological molecules, thus contributing to toxic effects. The reaction of AA
42
with proteins is extensive and the products of this reaction are used as biomarkers of its presence [5].
43
After entering the circulatory system, it is rapidly distributed into the tissues, passes through the
44
placenta and is transferred into breast milk. It is metabolized together with glutathione (GSH) and
45
also by epoxidation, resulting in glycidamide (GA). The formation of GA is mediated preferentially
46
by cytochrome P450, and is on the basis of neuro and genotoxicity of AA. Covalent DNA adducts of
47
GA were observed in vitro and in animal experiments and were used as biomarkers [2, 5].
48
Only the legal limit of AA for water has been established, with the value of 0.1 μg/L [7]. As a
49
large percentage of food contains this molecule, it is imperative to legislate its limits. The levels of
50
AA in foodstuffs of the Member States of the European Union were monitored between 2007 and
51
2012. Based on the results, the European Commission outlined indicative values for AA in different
52
foodstuffs [8]. These values are not safety values but rather indicative values, so that further research
53
is promoted in foods with higher AA levels and consequent reduction throughout the agronomical
54
factors, the food recipe, processing and final preparation [5]
55
The level of free asparagine in cereals has been claimed to be the major influence on the
56
formation of AA [9], since the largest pathway of AA formation involves this amino acid. The choice
57
of cereal varieties with lower levels of free asparagine is recommended, but challenging given the
58
influence of environmental conditions on their production [10].
59
Corn and rice products tend to have lower AA contents than wheat, barley, oats or rye. Products
60
with whole flours have higher levels of AA [10] . The choice of different varieties of cereals also
61
determines the development of AA: five varieties of rye with different fertilizations were used to
62
study the effect of nitrogen and sulfur on AA formation. A positive correlation was found between
63
asparagine concentration in grains and the highest levels of nitrogen used and the final concentration
64
of AA [11, 12].
65
The influence of cereal types on bread was investigated by Przygodzka and collaborators [13],
66
concluding that rye loaves form more AA in cooking, followed by spelled loaves and loaves of refined
67
flour - "white bread." In the same study, the extraction rates of the flour were compared with AA
68
formation: 100% whole flours obtained higher concentrations of AA, followed by flours with
69
extractions of 70%, indicating that "whole flours" have more AA precursors.
70
Several AA mitigation measures have been established that involve the use of the enzyme
71
asparaginase, which converts asparagine to aspartic acid, although control of adverse effects on
72
organoleptic properties is necessary [14].
73
The requirement for ultra-trace level detection of AA has led to development of several
74
analytical methods, most of which involving chromatographic separation techniques, both liquid and
75
gas chromatography. Determination of AA in food by GC-MS methods can be carried out with or
76
without derivatization. The advantage of derivatization processes is increased volatility and
77
improved selectivity. The bromination [1, 15-20], xanthydrol [21-25] and silylation [26, 27] have been
78
widely used for determining of AA in foodstuffs.
79
In recent years, the use of ultra-performance liquid chromatography (UPLC) has become more
80
popular because of its high sensitivity and selectivity, without the need for derivatization. Liquid
81
chromatography coupled to mass spectrometry have become the method of choice for the
82
determination of AA in food products, by using different mass analysers. Conventional triple
83
quadrupole (QqQ) have been for long the technique of choice by selecting the characteristic
84
transitions m/z 7255, and 7227. Ion trap [28-30] and TOF [28, 31-33] have also been useful for
85
quantitative analyses of AA.
86
Considering that the capabilities of high-resolution mass spectrometry (HRMS) based
87
methodologies for quantitative LC/MS analysis of AA in foodstuffs have been scarcely explored
[34-88
36] the present work aims at validating a HRMS methodology for detection and quantification of AA
89
in biscuits. The implemented procedure has been applied for investigating the impact of several
90
production parameters on the AA content in biscuits.
91
2. Results and Discussion
92
2.1. Method performance
93
Detection and quantification limits (LOD and LOQ) were estimated by using the signal-to-noise
94
method, as specified in the European Pharmacopoeia [38]. The peak-to-peak noise around the AA
95
yielded a signal equal to a certain value of noise to signal ratio was estimated, by comparing
97
measured signals from samples with known low concentrations of the AA with those of blank
98
samples. This method allows a decrease of the signal (peak height) to be observed to the extent that
99
the concentration is reduced through a series of dilutions, establishing the minimum concentration
100
at which the analyte can be reliably quantified. The signal-to-noise (S/N) ratios accepted as estimates
101
of the LOD and LOQ were 3:1 and 10:1, respectively [39]. The values found in this study are 3.55 g
102
kg-1 for LOD and 11.8 g kg-1 for LOQ, as shown in Table 1.
103
Table 1. Repeatability, limit of detection (LOD) and limit of quantification (LOQ) of the proposed
104
methodology.
105
Assay AA content (µg kg-1) AA content Average (µg kg-1)
SD RSD % r (µg kgLOD -1) (µg kgLOQ -1)
1 254.1
297.9 33.1 11.1 3.55 11.8
2 277.3
3 343.9
4 309.8
5 269.8
6 345.0
7 290.9
8 292.0
Commission regulation of 20 November 2017 states that the method of analysis used for the
106
analysis of AA must comply with the following criteria: LOQ less than or equal to two fifths of the
107
benchmark level (for benchmark level < 125 g kg-1) and less than or equal to 50 g kg-1 (for
108
benchmark level ≥ 125 g kg-1); LOD less than or equal to three tenths of LOQ [40]. According to the
109
same regulation, benchmark level for the presence of AA in biscuits and wafers is 350 g kg-1. This
110
means that LOD and LOQ is required to be less than or equal to 15 g kg-1 and 50 g kg-1 , respectively.
111
The method herein presented clearly meets these requirements. Moreover, in a proficiency test
112
recently organized by the EURL-PAH, for the determination of the AA content in potato chips, the
113
method performance LOD and LOQ were reported [41] . Twenty six laboratories guarantee the
114
determination of AA with an average LOD of 22.5 g kg-1 and LOQ 55.8 g kg-1 by liquid
115
chromatography (LC) coupled with mass spectrometry (MS; MS/MS). Nine laboratories participating
116
in this proficiency test reported 15.2 g kg-1 and 36.3 g kg-1 as average LOD and LOQ, respectively,
117
based on GC-MS methods. By using the analytical method herein reported, it is possible to increase
118
the detectability and thus achieve lower limit of quantification, which can be particularly useful in
119
the case of low-abundance AA matrices. The selection of the acquisition mode in the Orbitrap has a
120
direct impact on the detection sensitivity. In a recent paper, Kaufmann demonstrated that the
121
sensitivity of eight selected analytes is strongly increased by the use of SIM (selected ion monitoring)
122
relatively to the FS (full scan) mode (1.5-fold increase for analytes in pure standard solutions and
2-123
fold increase for analytes spiked in a heavy matrix) [42]. A detailed study of the acquisition method
124
for determination of eight synthetic hormones in animal urine concluded that reducing the scan range
125
for Full MS (using the quadrupole) and targeted modes give higher S/N ratios and thereby better
126
detection limits for analytes in complex matrices [43]. In fact, the targeted-SIM (t-SIM) is not more
127
selective than full MS, but it does provide enhanced detection sensitivity. As only a small fraction of
128
the continuously entering ion beam is sampled by the C-trap, the number of ions transmitted is
129
greatly reduced and a much longer segment of the ion beam can be collected. Accordingly,
130
significantly higher sensitivity can be achieved, mainly for small molecules applications, like the
131
present case of AA.
132
The precision of the method was evaluated by measuring the repeatability (intra-day
133
variability). The relative standard deviation was calculated for repeatability (RSDr) by performing
134
eight repeated analyses for samples of the same biscuit. The results showed that the RSDr (11.1%)
135
was less than 12% for a sample with an average AA content of 297.9 g kg-1 (Table 1). The use of
isotopically labeled internal standard (acrylamide-d3) is herein especially useful, as sample loss may
137
occur during sample preparation steps prior to analysis, as it is known that the fat/water distribution
138
of the matrix may affect the extraction and analysis.
139
2.2. Acrylamide content in biscuits
140
The optimized and validated procedure was applied to different samples of biscuits collected
141
from the baking oven. Three sample points were considered, as depicted in Figure 1. One is in the
142
middle of the oven and two are in the edges of the oven (left edges and right edges).
143
144
Figure 1.Sample collection points from the baking oven.
145
A huge difference was observed between samples collected from the middle and edges of the
146
oven (Table 2). Except for biscuit B, the AA content is higher for samples taken from the middle of
147
the oven, where the temperatures are higher. The observed increase is higher for biscuits D (from
148
1443 up to 3303 g kg-1, corresponding to 129% increase) and A (from 216 up to 431 g kg-1,
149
corresponding to 99% increase). Except for biscuit A, the AA content found for all the inspected
150
biscuits was above the benchmark level referred to in the EU Commission Regulation [40]. Of more
151
concern is the fact that biscuits C and D contain AA in concentration clearly above (average 2056 and
152
2373 g kg-1, respectively) the indicative value reported by European Food Safe Agency (dashed line
153
in Figure 2), confirming the pressure of establishing mitigation measures for the reduction of the
154
presence of AA in these matrices.
155
Table 2. Acrylamide content (μg kg-1) in biscuits collected from different points of the baking oven.
156
Biscuit
Edges of the baking oven
(µg kg-1)
Middle of the baking oven
(µg kg-1)
Average (µg kg-1)
A 216 431 324 ± 36
B 563 551 557 ± 61
C 1881 2231 2056 ± 226
D 1443 3303 2373 ± 261
The current analyses are in line with the hypothesis that the raw materials are the major factors
157
influencing the formation of AA, in particular the asparagine content of cereal flours [44-47]. The
158
highest value obtained for biscuit D (average 2373 g kg-1) can be justified by its composition, since
159
one of its raw materials is the wheat bran. Wheat bran is the outer part of the wheat grain, which is
160
with higher concentrations of asparagine, the amino acid responsible for the major pathway of AA
162
formation. Another type of raw material that may increase the concentration of AA in biscuits is that
163
undergoing heat treatment, such as cocoa. Cocoa, which is a raw material with thermal pretreatment
164
and therefore prone to the formation of AA [48], is present in biscuit C explaining the high content
165
found (average 2056 g kg-1).
166
167
Figure 2. Effect of the position in the oven on the acrylamide content of biscuits. The dashed line
168
depicts the indicative level (500 μg/kg) reported by the European Food Safe Agency [8]. □ middle of
169
the baking oven ■ edges of the baking oven.
170
2.3. Correlation between acrylamide content and biscuit colour
171
The AA content has been compared with both the colour, by measuring the Hunter Scale
172
parameters, L, a and b in a colorimeter, as well as with the moisture content of biscuits collected in
173
different oven positions. As can be seen in the images shown in Figure 3, the browning of the biscuit
174
associated with the increase of the AA content is clearly observed. The Hunter colour scale
175
parameters L (darkness) and a (red) increased during cooking confirming that a correlation exists
176
between the AA content and the browning of the biscuit.
177
178
Figure 3. Photograph of the same lot of biscuits subject to different cooking temperatures. The
179
different colors can be observed as well as the corresponding acrylamide levels.
180
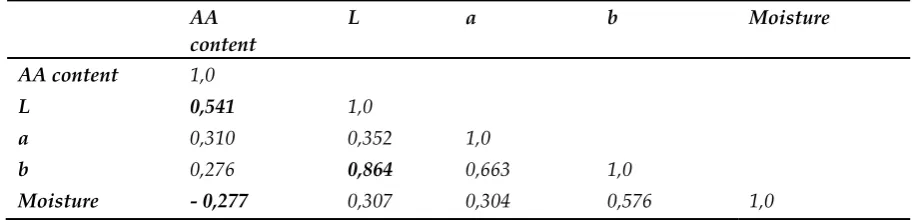
Multivariate statistical analyses were carried out in order to define the parameters which most
181
well correlate with the AA content (Table 3). The L parameter, which is darkness, is the first variable
182
correlated with AA content whereas an inverse correlation was found between the moisture and the
183
AA content. This is not surprising, since the temperature of the baking oven is expected to be
184
negatively correlated with the final moisture content of the biscuit, showing the direct impact of
185
temperature on the AA content. The influence of temperature on the formation of AA thus seems
186
confirmed, as demonstrated in previous studies [13, 49, 50]. In addition, Jozinovic et al. [51] have
187
recently shown that the moisture content and temperature during extrusion had a greater impact on
188
the formation of AA in relation to screw speed. Recent results revealed that at low temperatures used
189
for the thermal treatment, the amount of AA formed was lower, even if the treatment duration was
190
longer [52]. In the current work, the baking times are identical for the four biscuit types, thus it is not
191
possible to associate them with the AA values analyzed.
192
Table 3. Correlation matrix between the acrylamide content and the colour and moisture of biscuits.
193
In bold, significant values (except diagonal) at the level of significance 95%.
194
AA
content L a b Moisture
AA content 1,0
L 0,541 1,0
a 0,310 0,352 1,0
b 0,276 0,864 0,663 1,0
Moisture - 0,277 0,307 0,304 0,576 1,0
3. Materials and Methods
195
3.1. Chemicals
196
Acrylamide (≥95% for HPLC) and acrylamide-d3 standard solution (500 mg/l in acetonitrile)
197
were purchased from Sigma-Aldrich (Steinheim, Germany). Methanol (for UHPLC), ethanol (99.5%)
198
and dichloromethane (for HPLC) were from Panreac (Barcelona, Spain). High-purity water from a
199
Millipore Simplicity 185 water purification system (Millipore Iberian S. A., Madrid, Spain) was used
200
for all chemical analyses and glassware washing. The solvents employed for HPLC were filtered
201
through a Nylon filter of 0.45 μm pore size (Whatman, Clifton, USA) and degasified for 10 min in an
202
ultrasound bath.
203
3.2. Standard solutions
204
Concentrated stock solutions of acrylamide (1 mg/mL) and acrylamide-d3 (1 mg/mL), used as
205
internal standard, were prepared by dissolving the compounds in ethanol. Diluted standard
206
solutions were further prepared by adding the appropriate volume of each stock solution to water.
207
3.3. Biscuit samples
208
This work has been carried out in close collaboration with a leading company at the national
209
level and with an international dimension, whose confidentiality will be maintained for obvious
210
reasons. Four biscuit types were supplied, collected from three different sample points in the baking
211
oven, as depicted in Figure 1.
212
3.4. Sample preparation
213
The biscuits were grinded in a solid sample grinder (Moulinex, France) and put through a
214
Endecott’s test sieve (London, England). Approximately 1g of each ground biscuit were transferred
215
into a 50 mL polypropylene graduated conical tube with cap. 250 ng of internal standard
(acrylamide-216
d3 ) and then 15 ml of ultrapure water were added to each tube, which was placed in the ultrasonic
217
bath for 15 min. 2 ml of dichloromethane was added to each tube, left on the rotary shaker for further
218
20 min. The tubes were centrifuged at 5000 rpm for 15 minutes. 1500 μl of supernatant from each tube
219
was withdrawn for extraction and purification by solid phase extraction (SPE).
220
For the SPE clean-up, the Oasis HLB SPE cartridge (Waters) was conditioned under vacuum
221
with methanol (3.5 mL), and equilibrated with water (3.5 mL). Then, 1.5 mL of the withdrawn
222
supernatant were loaded on the Oasis HLB SPE cartridge and allowed to pass completely through
223
the sorbent material. The cartridge was rinsed with 500 L of ultrapure water and samples were
224
For the second step of the clean-up, the Bond Elut AccuCAT SPE cartridge was conditioned
226
under vacuum with methanol (2.5 mL), and equilibrated with water (2.5 mL). Then, the cartridge was
227
loaded with the solution from the previous step and 1 mL was discarded. The remaining volume was
228
collected directly to an injection vial.
229
3.5. LC-ESI-Orbitrap
230
The samples were separated on Accela HPLC (Thermo Fischer Scientific, Bremen, Germany)
231
Electrospray Orbitrap, using a C18 Phenomenex Germini (Phenomenex, USA), particle size of 3
232
microns and size 4.6 mm ID x 150 mm. The samples were eluted through a gradient of 90% solvent
233
A (0.1% HCOOH in water) and 10% solvent B (methanol) for 2 min at a flow rate of 0.4 mL / min,
234
thereafter for 18 min over 100% solvent B and 10 minutes in a 10% solvent B gradient.
235
The analysis was performed on a hybrid mass spectrometer LTQ XL OrbitrapTM (Thermo
236
Fischer Scientific, Bremen, Germany), controlled by LTQ Tune Plus Xcalibur 2.5.5 and 2.1.0. The
237
following ionisation (positive mode) parameters were applied: electrospray voltage 3.2 kV, capillary
238
temperature 300°C, sheath gas (N2) 40 arbitrary units (arb), auxiliary gas (N2) 10 (arb), and S-Lens
239
RF level at 25 (arb). The automatic gain control was used to fill the C-trap and gain accuracy in mass
240
measurements (ultimate mass accuracy mode, 1 × 10⁵ ions), the SIM maximum IT was set to 50 ms,
241
the number of micro-scans to be performed was set at three. Mass spectra were recorded in
242
multiplexed targeted-SIM mode (t-SIM) with a mass resolving power of 60,000 full width at half
243
maximum (FWHM) with a quadrupole isolation window of 1.0 Da for isolated ions (72.0444 Da for
244
acrylamide and 75.0632 Da for acrylamide-d3).
245
3.6. Analysis of colour
246
The color of the biscuits was analyzed with the Minolta CR-410 colorimeter. The parameters
247
used were Luminosity (L), Red (a) and Yellow (b). The biscuits were analyzed in their form of
248
consumption (without being ground), so that the color could be considered a method of control in
249
future industrial tests and quality parameters.
250
3.7. Moisture content determination
251
The moisture level of the analyzed biscuits was assessed on the same day of the AA extraction.
252
About 5 g of ground biscuit were dried for 3 h at 100 ° C. After drying and cooling, the dry mass of
253
the biscuit was measured and the moisture content was calculated.
254
3.8. Statistical analysis
255
To measure the strength of relationship between the measured variables, the two most
256
commonly used correlation coefficients were calculated. Pearson’s correlation coefficient (r) requires
257
both variables to be measured on an interval or ratio scale and the calculation is based on the actual
258
values. Pearson’s correlation coefficient may provide the best estimate of the population correlation
259
coefficient if the data are normally distributed. This correlation has two limitations: it is neither robust
260
nor resistant. It is not robust because strong yet nonlinear relationship between the two variables may
261
not be recognized. It is not resistant since it can be extremely sensitive to one or a few outlying point
262
pars. Spearman’s correlation coefficient () is a nonparametric statistic and so can be used when the
263
data have violated parametric assumptions and/or the distributional assumptions. Spearman’s rank
264
coefficient requires data that are at least ordinal and the calculation, which is the same as for Pearson
265
correlation, is carried out on the ranks of the data. Each variable is ranked separately by putting the
266
values of the variable in order and numbering them [37]. Thus, while the Pearson correlation
267
coefficient reflects the strength of linear relationships, the Spearman rank correlation reflects the
268
strength of monotonic relationship.
269
The statistical package, StatBox 7.5 (Grimmer Logiciel, Paris, France) was used for all statistical
270
4. Conclusions
272
A sensitive and efficient HRMS methodology, based on LC-MSn with electrospray ionization
273
and Orbitrap as mass analyser, allowing quantification of AA for specific food matrices of biscuits
274
was presented. Combining the multiplexed targeted-SIM mode for AA and isotopically labeled
275
internal standard (acrylamide-d3), the proposed HRMS method enables reliable and accurate
276
analyses of AA with very little influence by the matrix components. Under these conditions 3.55 g
277
kg-1 for LOD and 11.8 g kg-1 for LOQ are attainable.
278
During baking an increase in AA concentration was observed, as well as for samples taken from
279
the middle of the oven, where the temperatures are higher. Statistical processing of data shows that
280
the composition of the raw materials of the biscuits was statistically the most correlated factor with
281
the AA content. Statistical treatment shows the direct impact of temperature on the AA content as
282
well.
283
This study also reported that two types of biscuits (out of four) contain AA in concentration
284
clearly above the indicative value reported by European Food Safe Agency, confirming the pressure
285
of establishing mitigation measures for the reduction of the presence of AA in these matrices.
286
Author Contributions: Conceptualization, L.F.G.; methodology, C.L.F. and D.O.C..; data curation: C.L.F. and
287
L.F.G.; writing - original draft preparation, L.F.G.; writing - review and editing, all authors; supervision, L.F.G.
288
Funding: This research received financial support from the European Union (FEDER funds
289
POCI/01/0145/FEDER/007265) and from FCT/MEC through national funds and co-financed by FEDER
290
(UID/QUI/50006/2013-NORTE-01-0145-FEDER-00011) under the Partnership Agreement PT2020. DOC receives
291
a postdoc grant through the project Operação NORTE-01-0145-FEDER-000011. Mass spectrometric analyses
292
were conducted at CEMUP (Materials Centre of the University of Porto, Portugal) supported by the project
293
NORTE-07-0162-FEDER-00048.
294
Acknowledgments: The authors are thankful to Silvia Maia (CEMUP) for her technical assistance in the mass
295
spectrometric analyses.
296
Conflicts of Interest: All authors disclose any potential sources of conflict of interest.
297
References
298
1. Tareke, E., et al., Analysis of acrylamide, a carcinogen formed in heated foodstuffs. Journal of Agricultural and
299
Food Chemistry, 2002. 50(17): p. 4998-5006.
300
2. Bergmark, E., Hemoglobin adducts of acrylamide and acrylonitrile in laboratory workers, smokers and nonsmokers.
301
Chemical Research in Toxicology, 1997. 10(1): p. 78-84.
302
3. Sorgel, F., et al., Acrylamide: Increased concentrations in homemade food and first evidence of its variable absorption
303
from food, variable metabolism and placental and breast milk transfer in humans. Chemotherapy, 2002. 48(6): p.
304
267-274.
305
4. Friedman, M., Chemistry, biochemistry, and safety of acrylamide. A review. Journal of Agricultural and Food
306
Chemistry, 2003. 51(16): p. 4504-4526.
307
5. EFSA, Scientific Opinion on acrylamide in food. EFSA Journal, 2015. 13(6).
308
6. WHO, IARC monographs on the evaluation of carcinogenic risks to humans in IARC Monographs, W. Press, Editor.
309
1994.
310
7. EC, Council Directive 98/83/EC of 3 November 1998 on the quality of water intended for human consumption.
311
Official Journal of the European Communities, 1998. 41.
312
8. EU, Commission Recommendation of 8 November 2013 on investigations into the levels of acrylamide in food.
313
Official Journal of the European Union, 2013. 56.
314
9. Yaylayan, V.A., A. Wnorowski, and C.P. Locas, Why asparagine needs carbohydrates to generate acrylamide.
315
Journal of Agricultural and Food Chemistry, 2003. 51(6): p. 1753-1757.
316
10. FDA, Guidance for Industry: Acrylamide in Foods 2016, Food and Drug Administration
317
11. Curtis, T., J. Postles, and N. Halford, Reducing the acrylamide-forming potential of wheat and rye. Abstracts of
318
Papers of the American Chemical Society, 2015. 250.
319
12. Postles, J., et al., Effects of variety and nutrient availability on the acrylamide-forming potential of rye grain. Journal
320
of Cereal Science, 2013. 57(3): p. 463-470.
321
13. Przygodzka, M., et al., Factors influencing acrylamide formation in rye, wheat and spelt breads. Journal of Cereal
322
14. Xu, Y., et al., Risk assessment, formation, and mitigation of dietary acrylamide: Current status and future prospects.
324
Food and Chemical Toxicology, 2014. 69: p. 1-12.
325
15. Pittet, A., A. Perisset, and J.M. Oberson, Trace level determination of acrylamide in cereal-based foods by gas
326
chromatography-mass spectrometry. Journal of Chromatography A, 2004. 1035(1): p. 123-130.
327
16. Mizukami, Y., et al., Analysis of acrylamide in green tea by gas chromatography - Mass spectrometry. Journal of
328
Agricultural and Food Chemistry, 2006. 54(19): p. 7370-7377.
329
17. Soares, C.M.D. and J.O. Fernandes, MSPD Method to Determine Acrylamide in Food. Food Analytical
330
Methods, 2009. 2(3): p. 197-203.
331
18. Cengiz, M.F. and C.P.B. Gunduz, An eco-friendly, quick and cost-effective method for the quantification of
332
acrylamide in cereal-based baby foods. Journal of the Science of Food and Agriculture, 2014. 94(12): p.
2534-333
2540.
334
19. Delevic, V.M., et al., Quantification of Acrylamide in Foods Selected by Using Gas Chromatography Tandem Mass
335
Spectrometry. Hemijska Industrija, 2016. 70(2): p. 209-215.
336
20. Sobhi, H.R., et al., Application of modified hollow fiber liquid phase microextraction in conjunction with
337
chromatography-electron capture detection for quantification of acrylamide in waste water samples at ultra-trace
338
levels. Journal of Chromatography A, 2017. 1487: p. 30-35.
339
21. Yamazaki, K., et al., A method for the determination of acrylamide in a broad variety of processed foods by GC-MS
340
using xanthydrol derivatization. Food Additives and Contaminants Part a-Chemistry Analysis Control
341
Exposure & Risk Assessment, 2012. 29(5): p. 705-715.
342
22. Molina-Garcia, L., et al., Acrylamide in Chips and French Fries: a Novel and Simple Method Using Xanthydrol for
343
Its GC-MS Determination. Food Analytical Methods, 2015. 8(6): p. 1436-1445.
344
23. Luo, L., et al., Investigation of a rapid and sensitive non-aqueous reaction system for the determination of acrylamide
345
in processed foods by gas chromatography-mass spectrometry. Analytical Methods, 2016. 8(30): p. 5970-5977.
346
24. Norouzi, P., et al., A Sensitive Biosensor for Acrylamide Detection based on Polyaniline and Au Nanoparticles using
347
FFT Admittance Voltammetry. Analytical & Bioanalytical Electrochemistry, 2018. 10(1): p. 18-32.
348
25. Zokaei, M., et al., Ultrasonic-assisted extraction and dispersive liquid-liquid microextraction combined with gas
349
chromatography-mass spectrometry as an efficient and sensitive method for determining of acrylamide in potato chips
350
samples. Food Chemistry, 2017. 234: p. 55-61.
351
26. Lagalante, A.F. and M.A. Felter, Silylation of acrylamide for analysis by solid-phase microextraction/gas
352
chromatography/ion-trap mass spectrometry. Journal of Agricultural and Food Chemistry, 2004. 52(12): p.
3744-353
3748.
354
27. Surma, M., A. Sadowska-Rociek, and E. Cieslik, Development of a sample preparation method for acrylamide
355
determination in cocoa via silylation. Analytical Methods, 2016. 8(29): p. 5874-5880.
356
28. Bermudo, E., et al., Liquid chromatography coupled to tandem mass spectrometry for the analysis of acrylamide in
357
typical Spanish products. Talanta, 2008. 76(2): p. 389-394.
358
29. Claus, A., et al., A method for the determination of acrylamide in bakery products using ion trap LC-ESI-MS/MS.
359
Molecular Nutrition & Food Research, 2005. 49(10): p. 918-925.
360
30. Tsutsumiuchi, K., et al., Application of ion-trap LC/MS/MS for determination of acrylamide in processed foods.
361
Journal of the Food Hygienic Society of Japan, 2004. 45(2): p. 95-99.
362
31. Cajka, T. and J. Hajslova, Gas chromatography-time-of-flight mass spectrometry in food analysis. Lc Gc Europe,
363
2007. 20(1): p. 25-+.
364
32. Huang, Y.S., T.J. Hsieh, and C.Y. Lu, Simple analytical strategy for MALDI-TOF-MS and nanoUPLC-MS/MS:
365
Quantitating curcumin in food condiments and dietary supplements and screening of acrylamide-induced ROS
366
protein indicators reduced by curcumin. Food Chemistry, 2015. 174: p. 571-576.
367
33. Qi, Y.J., et al., Mitigation effects of proanthocyanidins with different structures on acrylamide formation in chemical
368
and fried potato crisp models. Food Chemistry, 2018. 250: p. 98-104.
369
34. Omar, M.M.A., A.A. Elbashir, and O.J. Schmitz, Determination of acrylamide in Sudanese food by high
370
performance liquid chromatography coupled with LTQ Orbitrap mass spectrometry. Food Chemistry, 2015. 176: p.
371
342-349.
372
35. Troise, A.D., A. Fiore, and V. Fogliano, Quantitation of Acrylamide in Foods by High-Resolution Mass
373
Spectrometry. Journal of Agricultural and Food Chemistry, 2014. 62(1): p. 74-79.
374
36. Pugajeva, I., J. Jaunbergs, and V. Bartkevics, Development of a sensitive method for the determination of
375
acrylamide in coffee using high-performance liquid chromatography coupled to a hybrid quadrupole Orbitrap mass
376
spectrometer. Food Additives and Contaminants Part a-Chemistry Analysis Control Exposure & Risk
377
Assessment, 2015. 32(2): p. 170-179.
378
37. Howell, D.C., Fundamental statistics for the behavioural sciences. 4th ed. 1999: Duxbury Resource Center.
379
38. European Pharmacopoeia, C. and M. European Directorate for the Quality of, European pharmacopoeia. 2007,
380
39. ICH, Q.R., Validation of Analytical Procedures: Text and Methodology International Conference on
382
Harmonization. 2005.
383
40. EC, COMMISSION REGULATION (EU) 2017/2158 of 20 November 2017 establishing mitigation measures and
384
benchmark levels for the reduction of the presence of acrylamide in food
385
E. COMMISSION, Editor. 2017, Official Journal of the European Union.
386
41. Bratinova, S. and L. Karasek, Determination of acrylamide in potato chips. Report on the inter-laboratory
387
comparison organised by the European Union Reference Laboratory for Polycyclic Aromatic Hydrocarbons. 2017,
388
European Commission: Luxembourg.
389
42. Kaufmann, A., Analytical performance of the various acquisition modes in Orbitrap MS and MS/MS. Journal Mass
390
Spectrometry, 2018: p. 1-14.
391
43. Kumar, P., et al., Targeted analysis with benchtop quadrupole-orbitrap hybrid mass spectrometer: Application to
392
determination of synthetic hormones in animal urine. Analytica Chimica Acta, 2013. 780: p. 65-73.
393
44. Pedreschi, F., K. Kaack, and K. Granby, The effect of asparaginase on acrylamide formation in French fries. Food
394
Chemistry, 2008. 109(2): p. 386-392.
395
45. Pedreschi, F., et al., Acrylamide reduction in potato chips by using commercial asparaginase in combination with
396
conventional blanching. Lwt-Food Science and Technology, 2011. 44(6): p. 1473-1476.
397
46. Mustatea, G., M. Negoia, and M.E. Popa, Influence of Flour Extraction Degree on Acrylamide Formation in
398
Biscuits. Romanian Biotechnological Letters, 2016. 21(2): p. 11328-11336.
399
47. Mustatea, G., et al., Asparagine and sweeteners - how they influence acrylamide formation in wheat flour biscuits?
400
Journal of Biotechnology, 2015. 208: p. S81-S81.
401
48. Delatour, T., et al., Improved sample preparation to determine acrylamide in difficult matrixes such as chocolate
402
powder, cocoa, and coffee by liquid chromatography tandem mass spectroscopy. Journal of Agricultural and Food
403
Chemistry, 2004. 52(15): p. 4625-4631.
404
49. Van der Fels-Klerx, H.J., et al., Acrylamide and 5-hydroxymethylfurfural formation during baking of biscuits: NaCl
405
and temperature-time profile effects and kinetics. Food Research International, 2014. 57: p. 210-217.
406
50. Nguyen, H.T., H.J. van der Fels-Klerx, and M.A.J.S. van Boekel, Acrylamide and 5-hydroxymethylfurfural
407
formation during biscuit baking. Part II: Effect of the ratio of reducing sugars and asparagine. Food Chemistry,
408
2017. 230: p. 14-23.
409
51. Jozinović A, Š.B., Ačkar Đ, Panak Balentić J, Šubarić D, Cvetković T, Ranilović J, Guberac S, Babić J. ,
410
Simultaneous Determination of Acrylamide and Hydroxymethylfurfural in Extruded Products by LC-MS/MS
411
Method. Molecules, 2019. 24(10).
412
52. Constantin, O.E., et al., Modelling Contaminant Formation during Thermal Processing of Sea Buckthorn Puree.


![Figure 2. Effect of the position in the oven on the acrylamide content of biscuits. The dashed line depicts the indicative level (500 μg/kg) reported by the European Food Safe Agency [8]](https://thumb-us.123doks.com/thumbv2/123dok_us/7890682.1309452/5.595.100.498.436.619/effect-position-acrylamide-biscuits-indicative-reported-european-agency.webp)