cosmic laboratories for galaxy evolution and feedback
Stefania Giodini
cosmic laboratories for galaxy evolution and feedback
DISSERTATION
der Fakult¨at f¨ur Physik der Ludwigs-Maximilians-Universit¨at M¨unchen zur Erlangung des Grades
Doktor der Naturwissenschaften Dr. rer. nat.
vorgelegt von
Stefania Giodini aus Erba, Italien
Abstract
Groups and clusters of galaxies occupy a special position in the hierarchy of large–scale cos-mic structures, being the largest and most massive (∼1013M⊙ for groups and∼1015M⊙ for clusters) objects in the universe evolved enough to reach a well defined equilibrium config-uration. In particular, since the growth of structures proceeds in a bottom–up sequence, galaxy groups are thought to be the clusters’ building blocks, thus they are important cosmic laboratories in which to investigate the physics of stucture formation through time.
In this thesis I focus on the observational study of ordinary matter (baryons) in galaxy groups in the last 9 Gyr of the life of the Universe. The baryonic mass budget of galaxy groups consists mostly of stars and X–ray emitting hot gas. I use the unique multiwave-length database of the COSMOS 22◦ survey to investigate the groups’ baryonic content, and compare its properties to that of massive clusters of galaxies. In particular I address the following general questions: are galaxy groups scaled down versions of clusters? What is the role of galaxy groups in galaxy evolution? How important are non–gravitational processes in galaxy groups?
In the first part of the thesis I study 91 X-ray groups at redshift 0.1≤z≤1 selected from the COSMOS survey. This sample is complemented by 27 nearby massive clusters with a robust, analogous determination of the total and stellar mass. The final sample spans a range in total mass of∼1013–1015 M⊙. I find that that the stellar mass fraction in galaxies is a decreasing function of the total mass of the group/cluster, constraining for the first time this relation in groups. This shows that groups are not lower mass analogous of clusters. Adding gaseous baryons to these considerations the baryonic budget of low mass groups does not add up to the value predicted by CMB observations. Thus groups are likely not closed systems, being more strongly affected by non-gravitational processes than clusters.
Searching for a cause of the baryon deficit in groups, I quantify the importance of the me-chanical energy released by radio-galaxies inside galaxy groups. By comparing this energy output to the host groups’ gravitational binding energy, I find that radio galaxies produce sufficient energy to unbind a significant fraction of the intra-group medium. These results show that non–gravitational processes such as radio–galaxy feedback play a fundamental role in determining the properties of galaxy groups.
Finally, I perform the analysis of the composite galaxy stellar mass function (GSMF) for 118 X–ray detected galaxy groups at 0.2<z<1 in the COSMOS field. I find a dip at intermedi-ate masses in the GSMF for field and low mass groups atz <1 for both active and passive galaxies. The dip’s amplitude depends on the environment, suggesting the presence of an excess of passive galaxies at intermediate mass (M∼1010M
⊙ ) in groups, likely as a product of environmental effects. At high redshifts the difference between the passive GSMF for the groups and the field (at M>1010.1 M⊙ ) decreases, suggesting that the passive galaxies at M>1011 M
⊙ are already in place in all the environments. Therefore a substantial evolution
im Universum eine Sonderstellung ein, da sie die gr¨oßten und massereichsten Objekte (∼1013 M
⊙ f¨ur Gruppen und∼1015 M⊙ f¨ur Haufen) im Universum darstellen, deren Entwicklung zu einer wohldefinierten Gleichgewichtskonfiguration gef¨uhrt hat. Ins-besondere geht man davon aus, dass Strukturen von kleinen Skalen zu Großen Skalen sequenziell anwachsen und dass Galaxiengruppen somit die Bausteine f¨ur Galaxien-haufen darstellen. Galaxiengruppen sind deshalb wichtige kosmische Laboratorien, in denen man die Physik der Strukturbildung als Funktion der Zeit untersuchen kann. In dieser Doktorarbeit konzentriere ich mich auf die Beobachtungen normaler Materie (Baryonen) in Galaxiengruppen in den im Zeitraum der letzten 9 Gyr des Univer-sums. Die baryonische Masse in Galaxiengruppen besteht haupts¨achlich aus Sternen und heißem, im R¨ontgenlicht strahlendem Gas. Um diesen baryonischen Massenan-teil zu untersuchen, verwende ich die einzigartige Multi-Wellenl¨angen-Datenbank des COSMOS 22◦ Survey und vergleiche die Ergebnisse zu Galaxiengruppen mit denen von massereichen Galaxienhaufen. Insbesondere widme ich mich den folgenden Fragen: Sind Galaxiengruppen kleinere Versionen von Haufen? Welche Rolle spielen Galax-iengruppen in der Entwicklung von Galaxien? Wie wichtig sind “nicht-gravitative” Prozesse in Galaxiengruppen?
Im ersten Teil dieser Arbeit untersuche ich 91 aus dem COSMOS-Survey ausgew¨ahlte R¨ontgengruppen mit Rotverschiebungen von 0.1≤z≤1. Diese Auswahl wird durch 27 nahe, massereiche Haufen erg¨anzt, deren Gesamt- und Sternmasse analog bestimmt wird. Damit umfasst die Stichprobe einen Massebereich von ∼ 1013–1015 M⊙. Ich stelle fest, dass der stellare Massenanteil in Galaxien eine abnehmende Funktion der Gesamtmasse der Gruppe bzw. des Haufens ist, womit diese Relation in Gruppen zum ersten Mal bestimmt wurde. Dies zeigt, dass Gruppen nich nur weniger massereichen Analogien von Haufen sind. Selbst wenn man die gasf¨ormige Baryonische Materie bei diesen ¨Uberlegungen ber¨ucksichtigt, so erreicht der Anteil an Baryonen in massearmen Gruppen nicht den Wert, der mit hilfe von CMB-Beobachtungen vorhergesagt wird. Gruppen sind deshalb wahrscheinlich keine geschlossenen Systeme, da sie st¨arker von nicht-gravitativen Prozessen beeinflusst werden als Haufen. Bei der Suche nach dem Ursprung dieses Baryonendefizits in Gruppen quantifiziere ich die Bedeutung der mech-anischen Energie, die von Radiogalaxien in Galaxiengruppen freigesetzt wird. Wenn ich diesen Energieausstoßmit der gravitativen Bindungsenergie der Gruppen vergle-iche, so stellt sich heraus, dass die Radiogalaxien gen¨ugend Energie produzieren, um einen signifikanten Anteil des Intra-Gruppen-Mediums freizusetzen. Diese Ergebnisse zeigen, dass nicht-gravitative Prozesse wie die Energieausstoßvon Radio-Galaxien eine grundlegende Rolle spielen, um die Eigenschaften von Galaxiengruppen festzulegen.
1 Introduction 1
1.1 Galaxy Groups . . . 1
1.2 X–ray properties of galaxy groups . . . 2
1.3 Cool Cores . . . 5
1.4 X–ray scaling relations . . . 7
1.5 AGN Feedback . . . 8
1.6 Optical Properties of galaxy groups . . . 10
1.6.1 Richness of Galaxy Groups . . . 10
1.6.2 The color of Galaxies . . . 11
1.6.3 Galaxy Classification . . . 12
1.6.4 The morphology–density relation . . . 14
1.6.5 The Galaxy Luminosity Function . . . 17
1.6.6 Galaxy Stellar Mass and the Galaxy Stellar Mass Function . . 18
1.7 The baryon mass fraction . . . 22
1.8 Surveys of Galaxy Groups . . . 23
1.8.1 The COSMOS survey . . . 24
1.8.2 The COSMOS photometric catalogue . . . 25
1.8.3 X–ray galaxy groups in the COSMOS field . . . 25
2 Stellar and total baryon mass fraction in groups and clusters since z=1 29 2.1 Introduction . . . 30
2.2 The sample . . . 32
2.2.1 The COSMOS survey of galaxy groups . . . 32
2.2.2 COSMOS X-ray-selected groups: total mass estimate . . . 34
2.2.3 Multiwavelength photometry and photometric redshifts . . . . 36
2.2.4 Nearby clusters . . . 37
2.3 Data Analysis . . . 38
2.3.1 Galaxy stellar mass function: completeness and extrapolation . 38 2.3.2 Total stellar mass (in galaxies) . . . 40
2.4 Results . . . 42
2.4.1 Stellar mass budget (galaxy component) . . . 42
2.4.3 The total baryon mass fraction . . . 47
2.4.4 Comparison with WMAP . . . 49
2.4.5 Impact of systematic effects . . . 51
2.5 Discussion . . . 54
2.5.1 The stellar mass fraction . . . 55
2.5.2 The total baryon mass fraction . . . 55
2.6 Conclusions . . . 56
Bibliography . . . 58
3 Radio galaxy feedback in X–ray selected groups from COSMOS 63 3.1 Introduction . . . 64
3.2 The samples . . . 65
3.2.1 Radio galaxies in X–ray detected groups . . . 65
3.2.2 The comparison sample of massive clusters . . . 66
3.3 Analysis of the COSMOS group sample . . . 67
3.3.1 Mechanical energy input by radio galaxies in groups . . . 67
3.3.2 Binding energy of the intra–group medium . . . 68
3.4 Analysis of the galaxy cluster sample . . . 70
3.4.1 Mechanical energy input by radio galaxies in massive clusters . 70 3.4.2 Binding energy of the intra–cluster medium . . . 71
3.5 Results . . . 72
3.5.1 The balance of radio–input and binding energy . . . 72
3.5.2 Can radio galaxies offset radiative cooling in galaxy groups? . . 72
3.5.3 Impact of systematic effects . . . 74
3.6 Discussion: the entropy in X–ray groups . . . 76
3.7 Conclusions . . . 80
3.8 Radio Images . . . 81
Bibliography . . . 86
4 The Galaxy Stellar Mass Function of COSMOS X–ray detected groups 91 4.1 Introduction . . . 92
4.2 The sample . . . 93
4.2.1 Galaxy groups in the COSMOS field . . . 93
4.2.2 Galaxies in the COSMOS groups . . . 94
4.3 Analysis . . . 97
4.3.1 Consistency with the result from the deep fields . . . 97
4.3.2 Galaxy stellar mass function of COSMOS groups . . . 99
4.4 Results . . . 99
4.4.1 The shape of the galaxy stellar mass function . . . 99
4.4.2 Environmental Dependence . . . 102
4.4.3 Evolution . . . 105
4.5 Discussion . . . 107
4.5.1 Passive galaxies: environmental dependence . . . 107
4.5.2 Active galaxies: environmental dependence . . . 110
4.6 Summary . . . 111 Bibliography . . . 112
5 Final Remarks and Future Outlook 117
Acknowledgements 121
CV 123
Chapter
1
Introduction
1.1 Galaxy Groups
Not too long after the first telescopes were used, astronomers realised that the galaxy distribution in the sky was not uniform. Already in 1781, Charles Messier reported in a note that 16 of the first 91 “nebulae” of his catalogue happen to lie in the small region of the sky at the north-western edge of the constellation of Virgo and overlap-ping with Coma Berenices. These “clumps” of galaxies are now known as two of the innumerable clusters of galaxies that populate the Universe, each of them including hundreds to thousands of galaxies.
Our current cosmology explains the presence of these structures as the product of the evolution of the Universe. In the standard picture, we live in an expanding Universe that originated 13.8 billions of years ago from a phase of extremely high density and temperature in the Big Bang. 300,000 years later, small fluctuations of the order of ∼10−5present in the almost uniform density field, started growing due to gravitational
instability. Theoretical work and simulations have shown that primordial density fluc-tuations eventually cease expanding with the Hubble flow once they achieve a critical overdensity, and successively collapse and virialize1.
Furthermore, we know that roughly 85% of the gravitational mass involved in the growth and dynamical evolution of the structures consists of a weakly interacting, collisionless form of matter. Because of its properties, this matter has so far escaped direct detection through effects other than gravity, and has been named “dark
mat-1For a virialized structure holds the virial theorem, which states that for a bound, self-gravitating,
ter”.
Gravity creates a huge variety of cosmic structures, but most galaxies are found in groups of no more than a few dozens members and with a total mass content of ∼1013M
⊙ . Groups ranges from loose associations a few times denser than their sur-roundings to galaxy clusters, which are the largest virialized structures in the Universe, with a total mass of∼1015M⊙ . However clusters are rare objects, containing only 1% of all galaxies, while gravitationally bound groups contain up to 70% of the galaxies in the universe. In the scenario of an inhomogeneous Universe, rich clusters of galaxies act as nodal points in the filamentary structure, while groups of galaxies lie like beads within the filaments.
Furthermore, groups are an unstable environments, since while galaxy formation is on-going, the group itself may merge with other groups to build a large structure. In the current picture, dark matter cluster formation proceeds in a hierarchical bottom–up sequence: virialized haloes of small mass form first, and then grow by accretion and merging. In this sense galaxy groups are the “building blocks” of galaxy clusters. Galaxy groups are important laboratories to investigate the evolution of galaxies and the large scale structure formation. Galaxy evolution appears to be a complex, drawn– out process, involving the collapse of a matter overdensity, accretion of gas and dark matter, outright merging of distinct galaxies, gas outflows enriched with metals by supernova and active galactic nuclei (AGN) activity. Most galaxies conduct these transitions in the group environment: indeed, while 70% of the cluster galaxies are “red and dead” elliptical galaxies, the group population is a mixed bag of morpholo-gies, suggesting that galaxy evolution is still ongoing in groups while the same evolu-tion in clusters happened at earlier epochs (z>1.0). Also, the velocity dispersion in groups is lower than in clusters and comparable to that of individual galaxies, thus processes such as galaxy–galaxy merging are more prevalent in groups than in clusters.
1.2 X–ray properties of galaxy groups
Galaxy clusters are detected as bright, extended sources in the X–ray sky. Indeed massive clusters have internal line of sight velocity dispersion of 500–1000 km s−1 ,
(a)Galaxy Cluster
(b)Galaxy Group
Figure 1: (a) The Coma cluster is one of the richest clusters of galaxies in the Local Universe. Its total mass is ∼1015 M
⊙ . This image from the Hubble telescope is 9 arcmin across and
encloses only the central part of this rich cluster. (b) HCG 87 is a nearby compact galaxy group composed of only 4 galaxies. This image by the Gemini telescope is 4 arcmin across.
gas can reach up to 15% of the total system mass. The typical X–ray luminosity of galaxy clusters is ∼1044–1045 erg s−1.
somewhat different than in clusters: since groups have a lower velocity dispersion, thus a lower temperature, the abundant elements are not fully ionized, and part of the flux is due to line emission. The typical X–ray luminosity of galaxy groups is∼1041–1043 erg s−1.
There is a considerable range of morphologies in the X–ray appearance of observed groups. Most X–ray luminous clusters and groups (LX> 1043 erg s−1) tend to have
somewhat regular morphologies, where the peak of the emission is usually coincident with a luminous early–type galaxy, which tends to be the optically brightest member of their system (BCG). In this case, the position of the central galaxy defines then the centre of the potential well, so that it lies at the dynamical centre of the system. At lower luminosities, instead, more irregular X–ray morphologies are often found, and the X–ray emission is not centred on one particular galaxy, but rather distributed around several galaxies.
The extent of the hot gas, as estimated by tracing the X–ray surface brightness profile of the system until it approaches the background value, reaches approximately the virial radius of the system. Traditionally, the surface brightness profile of a cluster is described by a hydrostatic isothermal model (“β–model”, e.g. Jones and Forman 1984). By analogy, this model is also adopted for groups, thought this may be a coarser approximation, especially for those with an irregular morphology. However, since the sound crossing time in groups is short compared to the Hubble time2, the intra–group medium should generally be in hydrostatic equilibrium to a good approximation. With King’s (1962) analytic approximation to the isothermal sphere, the X–ray surface brightness at a projected radius R is then given by:
S(R) =S0
" 1 +
R rc
2#(−3β+0.5)
(1)
where rc is the core radius of the gas distribution and β is derived by the ratio of the specific energy in galaxies to the specific energy in the hot gas and depends on the temperature3. This profile can then be converted to a gas density profile by geometric deprojection and under the assumption of spherical symmetry. If the only source of heating of the gas is gravitational and there is no efficient cooling, it is true that the gas temperature is a direct measure of the potential depth, and therefore of the total mass.
2The Hubble time provides an estimate for the age of the universe by presuming that the universe
has always expanded at the same rate as it is expanding today.
3This is a theoretical profile (Cavaliere & Fusco-Femiano 1976) and the definition ofβ is motivated
In particular, when the conditions of hydrostatic equilibrium and spherical symmetry are met, the total mass interior to any particular radius is a simple function of the gas temperature and gas density. Thus it is possible to obtain the hydrostatic mass estimation within a given radius (R) as:
M(< R) =−kT(r)r
µmpG
dlnρ dlnr +
dlnT dlnr
(2)
where k is the Boltzmann’s constant, T is the gas temperature at the radius R, G is the gravitational constant,µis the mean molecular weight, mp is the proton mass and
ρ is the gas density. All the parameters of this equation may be computed directly form X–ray observations.
The typical group mass is approximately 1013 M
⊙ (one hundreds time less massive than a cluster like Coma).
Clusters and groups do not have a sharp, well defined boundary. The extent of a galaxy system is usually defined in terms of the radius within which the mass density of a group/cluster is equal to ∆ times the critical density of the Universe (R∆). X–ray
mass estimates can generally be applied out to R500, which is∼70% of the virial radius.
Beyond that, the gas density profile is not well constrained, due to the difficulty of detecting low emissivity of the X–ray gas in the cluster outskirts by past and present X–ray telescopes.
Another important property of the hot gas is the gas fraction. Groups have lower gas mass fractions within R2500 when compared to clusters (e.g. Sun et al. 2008). Since
the gas fraction in simulated groups and clusters is directly linked to the strengths of cooling and star formation (e.g. Kravstov et al. 2005), a small value at the groups regime may imply that these processes are more efficient there. The enclosed gas fraction may also be modified by AGN feedback (Puchwein et al. 2008), thus bearing the imprint of the whole intra–cluster gas heating history.
1.3 Cool Cores
Early X–ray observations revealed that the intra–cluster medium in the centre of many clusters is so dense that the cooling time of the gas is much shorter than the Hubble time (e.g. Fabian & Nulsen 1977). Indeed a large fraction of systems shows a sharp X–ray brightness profile and a temperature drop in the inner ∼100 kpc.
Figure 2: Chandra image of HCG 62, a galaxy group with LX∼1043 erg s−1[Credit: Chandra Archive]
layers. Hot gas from the outer regions of the ICM flows in to replace the compressed gas, generating a cooling flow. However, this model predicted a large amount of star formation to happen in the centre of clusters when the gas cooled below 104 KeV,
Den-nis & Chandran 2005), mechanical heating by AGN driven bubbles (e.g. Birzan et al. 2004; Birzan et al. 2008). The failure of the classical cooling flow model has changed the nomenclature of these centrally dense clusters to cool–cores (Molendi & Pizzolato 2001).
Many groups and clusters have large and dense cool cores (e.g. ∼50% in the HI-FLUGCS sample, Chen et al. 2007) but it is still a matter of debate whether or not this percentage is strongly dependent on the redshift (Vikhlinin et al. 2007; Santos et al. 2008). Cool core systems are generally more dynamically relaxed when compared to non cool core ones. Furthermore observations of cool core clusters and groups at radio wavelengths have shown that a large percentage of those systems has a central radio galaxy interacting strongly with the surrounding plasma (Blanton et al. 2004; Boehringer et al. 2004; Fabian et al. 2006, Forman et al. 2006).
1.4 X–ray scaling relations
Clusters of galaxies, being the outcome of the process of structure formation, are mostly ruled by the physics of gravitation. In a universe with a density close to the closure density 4, the amplitude of the initial density fluctuations is approximately a
power law function of the length scale. So these perturbations are scale free (Kaiser 1986). Neglecting dissipation, no additional physical scale is introduced into the prob-lem up to the gas infall into the potential wells, therefore the gas distribution in groups and clusters will also be scale–free. This condition is named “self–similarity”.
Self–similar models predict simple scaling relations between basic cluster properties and the total mass. In particular, three important correlations are the X–ray luminosity– temperature (LX–T), mass–temperature (M∆5–T) and entropy6–temperature (S–T)
relations. In formulas:
LX∝T2 M∆∝T1.5 S ∝T (3)
These relations are of great importance for the investigation of groups and clusters of galaxies and are important diagnostics for the astrophysics of the ICM. The M–T rela-tion constrains the scale of a system. It gives a direct measurement of the system mass when its X-ray temperature is known. The LX–T relation is a proxy for the structural
regularity of galaxy clusters. Since the X–ray luminosity depends on the baryon mass
4The mass density of the universe which just stops the expansion of space, after infinite cosmic time
has elapsed. The closure density is the boundary value between universe models that expand forever (open models) and those that recollapse (closed models).
5M
∆is the total mass computed at the overdensity ∆. 6defined as S= kT
n2e/3
and the temperature on the total mass, the LX–T relation can trace variations in the
gas fraction. Finally, the S–T relation reflects the thermodynamic and the accretion history of the ICM.
However, while clusters of galaxies seem to be mostly well behaved along these rela-tions, observational studies of galaxy groups report deviations from self similarity for systems below 4 keV. In particular the slope of the M–T (S–T) relation is consistent with the theoretical predictions only for high temperature clusters and steepens (gets shallower) for low temperature ones (e.g. Finoguenov et al. 2001; Arnaud et al. 2005; Pratt & Arnaud 2003; Ponman et al. 2003). Also, the slope of the L–T relation ob-tained from observations is considerably steeper than the theoretically predicted one for all systems (LX∝T3 from soft X–ray band observation), indicating that the gas
fraction depends on the temperature.
It is exactly such deviations that give us a precious diagnostic to study the thermody-namical history of the ICM. These findings indicate that non–gravitational processes may interfere with the groups physics, such as pre–heating during the systems collapse (e.g. due to star formation or shocks), radiative cooling and AGN activity.
1.5 AGN Feedback
It is now widely believed that supermassive black holes (M>106 M
⊙ ) are present in most if not all galaxies with a bulge component and that their masses are correlated with the stellar properties of their host galaxies (e.g. Ferrarese & Merrit 2000; Kor-mendy & Richstone 1995). The existence of these relations suggests that black holes interact strongly with their surroundings, and this interaction is called “feedback”. Observational and theoretical considerations suggest that different channels of AGN feedback exist. At high redshift, mergers of gas rich galaxies happen frequently and funnel large amounts of cold gas towards the central region of galaxies, which can be accreted onto the black hole at high rates. The radiation energy associated with the accretion can support the enormous luminosities of a class of observed AGN called quasars. Quasars produce high velocity winds, which affect the properties of the sur-rounding galaxies and gas (Silk & Rees 1998; Chartas 2003).
Figure 3: LX–T relation for the REXCESS galaxy cluster sample presented in Pratt et al. (2009). The quantities are computed in an aperture of 0.15R200 <R<R200 to avoid the con-tribution of the cool core (see section 1.3) and reduce the scatter in the relation.
cosmological framework has been proposed, by analogy with observational finding on X–ray binaries (Fender et al. 1999; Gallo et al. 2003). Indeed X–ray binaries switch between a low/hard state, where a radio jet is present and the observed spectrum is hard, and a high/soft state, in which the jet shuts off and a softer X–ray spectrum is observed. This dichotomy has been interpreted with a differently radiatively efficient accretion. In a similar fashion, a “two–mode” model has been proposed to explain AGN feedback in clusters (Sijacki et al. 2007): for high–accretion rates a quasar–like feedback occurs, while for states of low accretion feedback via mechanical bubbles ap-plies (radio–mode).
Simulations show that the bulk of the BH growth occurs at high accretion rates, cor-responding to radiatively efficient AGN activity, while the relative importance of the radio mode grows towards late times, and becomes large in clusters of galaxies at z<1 (Sijacki et al. 2007; Puchwein et al. 2008).
the thermal gas are now observed in many clusters with cool cores, clearly showing that the mechanical interaction of the radio plasma with the thermal gas is strong and that the gas is disturbed by the activity of the nucleus. Furthermore, bubbles of relativistic plasma, created by the supermassive black hole, move through the ther-mal gas, driven by buoyancy forces. Therefore, supermassive black holes are a very attractive solution as a source of heating, since they can provide large amounts of energy, extracted from the gravitational energy of accreting matter. The Eddington luminosity7 for a 109 M⊙ black hole is of the order of 1047erg s−1. This energy is more
than enough to offset the gas cooling losses in the strongest cooling flows, even if one considers a moderate efficiency of the heating mechanism. Moreover a self–tuning of the energy release is possible through the modulation of the accretion rate onto the black hole (e.g. Nulsen 2004, B¨ohringer et al. 2004b, Chandran 2005). Indeed AGN feedback is a self–regulated mechanism, which can be understood with a simple toy model (Churazov 2002): the ICM responds to the AGN heating by expanding and thus lowering the gas density and the accretion rate. The latter regulates the AGN energy output, lowering it. As the gas radiates away the energy, the atmosphere around the AGN contracts, and thus the accretion rate rises again, starting another cycle of AGN activity.
1.6 Optical Properties of galaxy groups
When observed with optical telescopes, galaxy groups appear as definite, localised overdensities of galaxies, with up to a few tens of galaxies concentrated in the plane of the sky. Groups of galaxies are classified by their optical properties: richness (number of members), galaxy content (spiral-rich, spiral-poor, or elliptical-rich), member galax-ies’ color, stellar mass. When considering the optical properties, galaxy groups provide a natural and continuous extension to lower richness, mass, size, and luminosity from the rich and rare galaxy clusters.
1.6.1 Richness of Galaxy Groups
Abell (1958) produced a first catalogue of several thousands clusters and groups de-tected through visual inspection of optical plates from the Palomar All Sky Survey. He also introduced a first classification based on richness, i.e. the approximate number of galaxies composing the system. This was estimated as the background-corrected number of galaxies brighter than m3 + 2 (where m3 is the magnitude of the third
7The Eddington luminosity is defined as the point where the gravitational force inwards equals the
Figure 4: The CHANDRA image of the Perseus Cluster along with the radio emission from the central regions. The radio emission fits neatly inside the cavities in the X-ray emission. (Image courtesy CHANDRA)
brightest cluster member) within a radius of R=1.5h−1 Mpc of the system’s center.
By this definition everything that contains more than 50 galaxies above this threshold is classified as a galaxy clusters.
1.6.2 The color of Galaxies
classified as “red”. Since the galaxy color is linked to the presence of star–formation activity, often red galaxies are referred to as passive, and blue galaxies as active. The former have older and more metal–rich stellar population with respect to the latter. Absorption and scattering of stellar light by interstellar dust modify the intrinsic stel-lar SED, thus can bias the color classification of a galaxy. Dust consists of fine particles and molecules, mostly made of O, C, Mg, Si, Fe and N, produced during the evolution of stars. The size of the particles ranges between 0.1 and 1µm, in general, which gives the wavelength dependence of the extinction. Thus, very dusty star forming galaxies can exhibit very red colors.
In order to avoid misinterpretation, the absorption by dust is somehow modelled (e.g. Calzetti et al. 2001) when analysing a galaxy SED.
Another effect that must be taken into account is that the cosmological redshift both shifts and stretches the SED: for example, the blue light emitted by a galaxy at z=1 is seen only in a red filter since its intrinsic blue emission has been redshifted into the red part of the optical spectrum. Thus, an accurate classification of galaxies at high redshift on the basis of their SEDs requires a very wide spectral coverage.
In general the occurrence of galaxies of a certain color depends strongly on the envi-ronment that hosts them. In rich galaxy clusters a large fraction of the galaxies are red. In particular, when representing the galaxies of a cluster on a color–magnitude diagram, many of those define a roughly linear sequence at a well defined red color: this feature is called “red–sequence”. The red sequence can be reproduced by a model assuming that the bright red galaxies have roughly the same stellar age but a metal-licity that diminishes at decreasing luminosity (Kodama & Arimoto 1997). Since the red sequence can be rather well predicted by such models, it has been used as an indication of the cluster’s redshift (e.g. Gladders & Yee 2000).
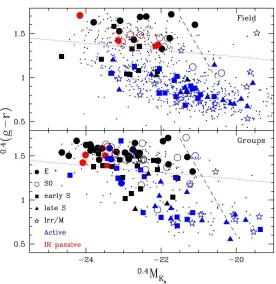
A red sequence is present also in galaxy groups, but seems to be formed later: while the galaxy cluster’s red sequence is in place at z∼1 that of groups is still building up (Tanaka et al. 2005). In general galaxy groups contain more red galaxies at a fixed stellar mass than the field (see Figure 5).
1.6.3 Galaxy Classification
Figure 5: A color–magnitude diagram for groups and the field at z=0.25–0.55 from Balogh et al. (2009). Galaxy groups contain more red galaxies than the field at a fixed stellar mass (traced by the K–band magnitude on the x axis). This picture also shows that the field does not have a defined red sequence.
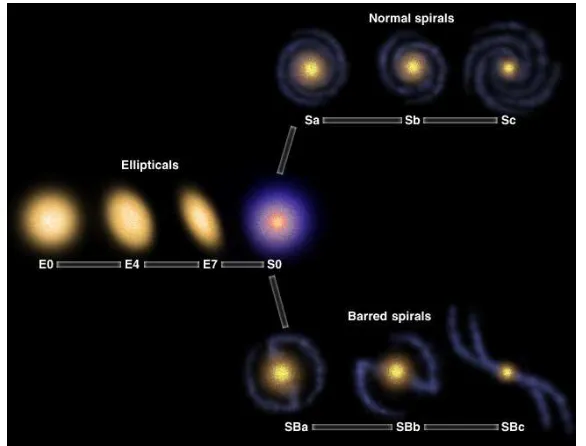
(1926). The Hubble classification recognizes four principal types of galaxies: elliptical, lenticular, spiral and irregular.
Essentially the Hubble classification scheme is based on the relative proportions of the two major structural parts of the luminous component of galaxies, namely the bulge and the disk.
The bulge is generally made of a relatively old and evolved stellar population, and is shaped like an ellipsoid with various degrees of flattening and oblateness (no flattening or oblateness means we are dealing with a sphere). In general bulges at z=0 contain no appreciable amount of dust and gas, and therefore host no star formation activity; when star formation ends the luminosity of a galaxy s dominated by the light of low mass stars, which emit at red and infrared wavelength8, and therefore bulges are
char-acterized by red colors.
8Stars are optically thick spheres of plasma, emitting light as a black body from the surface
The disk is composed by a mixture of old and young stars and by gas and dust, and it is frequently site of star formation activity. Its colors are generally bluer than those of the bulge, because massive stars on the red sequence dominate the spectral energy distribution at blue wavelengths. The most visually striking feature of the disk is the frequent presence of spiral arms: these are produced by density waves excited by the differential rotation of the disk and contain active regions of star formation.
From the point of view of dynamics, the bulge usually shows very little amount of rotation, and stars in it have large thermal motions whereas the motion of stars in the disk is governed by its rotational velocity , and self- gravity and centrifugal force balance each other.
In this sense, the Hubble diagram is not only a classification of galaxy morphology but it reflects some important physical properties of galaxies, such as the age and the dynamics of their stellar population.
Elliptical galaxies are composed by a spheroidal–like bulge and have no disk. Lenticu-lars are essentially elliptical galaxies with a very thin disk which gives them the shape of a lentil. Spiral galaxies have a central bulge surrounded by an extended disk with a pattern of spiral arms. In barred spiral galaxies the arms emerge from the ends of what looks like a rigid bar, or elongated ellipsoid of stars and luminous material that straddles the central nucleus. The Milky Way belongs to this category. Irregulars tend to resemble disk galaxies where the spiral arms are not regularly defined, or absent. The galaxies that occupied the left part of the Hubble diagram have been named “early–type”, while those on the right side “late–type”. Hubble took these terms from spectral classification of stars to signify a sequence related to complexity of appear-ance, albeit based on images, not spectra (see Baldry et al. 2008 for a review on Hubble’s nomenclature). Such nomenclature has remained, and today it is common to refer to ellipticals and lenticulars as early–type galaxies, and to spirals and irregulars as late types galaxies.
1.6.4 The morphology density relation and environmental effects in galaxy groups
The census of the morphology of galaxies within galaxy groups has shown a striking difference when compared to the field. In particular early type galaxies tend to pop-ulate galaxy clusters and groups, while the contribution of spiral galaxies to the total galaxy budget (spiral fraction) increases when moving towards less dense environment (Oemler 1974; Dressler 1980).
Figure 6: The “tuning fork” diagram compiled by E. Hubble. (Courtesy University of Texas, McDonald Observatory)
color is tightly bound to the galaxy morphology and to the level of star formation ac-tivity, red and passive galaxies are more frequent in high density environments, while blue and actively star forming objects populate mostly low density ones.
This relation, however, evolves with redshift, and recent studies conducted with HST have shown larger spiral fractions in higher redshift galaxy clusters (Dressler 1994; Dressler 1997).
The evidence of high occurrence of actively star forming galaxies in distant clusters has been found from photometric studies which analysed the distribution of blue galaxies at different redshifts (Butcher & Oemler 1978; Kodama & Bower 2001). The same studies show that the galaxies with red colors in distant clusters contain very old stel-lar populations formed at z >2, and evolved passively since then (Ellis 1997).
Figure 7: The morphology–density relation found by Dressler (1980) in galaxy clusters. The fraction of early–type galaxies increases with increasing density, while the fraction of late–types decreases.
1. Mergers: strong interactions between galaxies and merging are more efficient when the relative velocity among galaxies is low, therefore in groups of galaxies rather than in clusters (Toomre & Toomre 1972).
2. Harassment: the cumulative effect of the gravitational interactions in high ve-locity encounters truncates the galaxy star formation in ∼107 years (Moore et al. 1995).
3. Gas Stripping:The interaction between galaxies and the intergalactic medium. The stripping of the gas is mostly due to the effect of the ram pressure which is efficient in very dense environments, and when the relative velocity of galaxies is high. These conditions are achieved in the core of rich galaxy clusters (Gunn & Gott 1972).
1.6.5 The Galaxy Luminosity Function
One very powerful tool to describe quantitatively the properties of galaxies is a statistic called the “luminosity function”, which provides information on the relative frequency in space of galaxies with a given luminosity (Binggeli 1988).
The reason of coupling together the luminosity and the abundance of galaxies is that this reflects an important set of physical properties. The luminosity of the galaxies is a measure both of their stellar content and of their star formation activity: the for-mer is generally correlated with the total mass of the galaxy, the star formation and merging history, while the latter provides the rate at which the stellar content of a galaxy is increasing. On the other hand, the volume density of galaxies is a prediction of the theory of structure formation through gravitational instabilities, and is tightly linked to the cosmological parameters Ω and ΩΛ 9. Thus by coupling together the
information on the luminosity and numerical abundances of galaxies, the luminosity function provides synthetic information on the formation and evolution of both the star formation history of galaxies and the cosmological parameters.
The luminosity function of local galaxies has been measured with good accuracy: it shows that fainter galaxies are much more numerous than brighter ones. The shape of the luminosity function was predicted for the first time by Fritz Zwicky in 1942: ther-modynamical considerations naturally lead to the existence of a large number of low mass, faint galaxies, and consequently a steeply rising luminosity function towards low luminosities. Nowadays the most popular parametrization of the luminosity function is the so–called Schechter function (Schechter 1976):
dN dL ∝L
−αexp(−L/L∗) (4)
where L∗ is ∼1010L
⊙ and α ∼1–1.5, depending on the galaxy selection criterion. The characteristic luminosity L∗ indicates the maximum luminosity at which galaxy formation is efficient, while the slopeαdescribes the relative contribution of low mass galaxies. This relation has been found empirically, but Press & Schechter (1974) show that the mass distribution of the underlying dark matter haloes exhibits a Schechter form: since baryons fall into dark matter haloes and produce stars one might expect a Schechter function to hold for the galaxy mass distribution (which is related to the luminosity distribution).
9The cosmological parameters Ω and Ω
Λ measure the total mass content of the universe and the
Figure 8: The Schechter function.[Credit:http://zebu.uoregon.edu/]
1.6.6 Galaxy Stellar Mass and the Galaxy Stellar Mass Function
While luminosity is the most straightforward observable, the stellar mass of galaxies is more tightly linked to the physics of star (and then galaxy) formation: this makes the galaxy stellar mass function (GSMF) an even more valuable statistics than the luminosity function.
The origin and evolution of early type galaxies seem to follow different ways and timescales as a function of their stellar mass, the so–called “downsizing scenario” (e.g. Cowie et al. 1996). As recognised by Brinchmann & Ellis (2000), to put tight con-straints on the models of galaxy formation, an independent “accounting variable” is needed, which is capable of tracking the likely assembly and transformation of galax-ies. A comprehensive picture has been obtained on its evolution in the interval marked by 0< z <1. The luminosity and emission-line characteristics are transient properties and poorly suited for this purpose: during their evolution, galaxies transform form one kind to another, and their optical luminosity changes drastically during the phases of mergers. The stellar mass, instead is either conserved or slowly increasing, and is therefore an obvious choice.
his-tory of the galaxy stellar mass. However, to obtain robust galaxy stellar masses, deep infrared photometry is a basic requirement. Indeed the observed infrared flux (e.g. K–band) best traces the old stellar populations, which make most of the mass of a galaxy, and is therefore a good measurement of its total stellar mass (e.g. Kauffman & Charlot 1998). Moreover, the infrared flux is only weakly affected by extinction. The stellar mass can be derived from the direct conversion of the K–band luminosity by means of a stellar mass–to–light ratio supplied by stellar population evolutionary synthesis models. Another method is based on the combination of multi–band optical and infrared photometry, and entails the fit of the observed photometric points with a grid of synthetic galaxy templates (SED–fitting). The outcome of the SED–fitting is a set of best–fitting parameters which describe several properties of galaxies within a certain confidence; among these parameters stellar mass, photometric redshift and stellar spectrophotometric type are the most valuable.
The conversion of the infrared light into mass is an efficient method, but suffers from the lack of information on the galaxy spectral type, on which the mass–to–light ratio depends. On the other hand, the SED fitting is computationally very expensive in large surveys. A combined approach, as the one undertaken in the COSMOS survey, entails obtaining the galaxy type from the SED and then convert the K–band lumi-nosity using a type dependent mass–to –light ratio.
are more populate very massive clusters. The previous discussion refers to the galaxy luminosity and stellar mass function shape (see also Popesso et al. 2006).
This of course leaves several questions open: is there any significant difference between the GSMF of field and clusters, owing to their different densities and galaxy merging histories? Are groups more similar to the field or to rich clusters? What is the role of the groups in galaxy evolution?
By measuring the GSMF of galaxies in high redshift systems, and comparing to well established GSMF at low redshift, it is possible to determine how the distribution of stellar mass throughout the system’s population has evolved. Ellis & Jones (2004), for example, study the K–band luminosity function of rich clusters, finding it to be consistent with purely passive evolution10. Recent results from the deep field show a weak evolution of the GSMF up to redshift ∼1 for passive galaxies, followed by a strong evolution in number density between z=1 and 1.5 (Ilbert et al. 2010). Up to now no investigation of the role of groups in the build up of the GSMF exist at redshift>0.1.
Another debated issue is the shape of the galaxy stellar mass function. Generally, Schechter fits to the galaxy stellar mass function with a faint end slopeα∼1 have been found adequate to describe the galaxy population (even separated morphologically, by star–formation activity and color; e.g. Pannella et al. 2009). Recently,however, a steepening of the slope of the luminosity function at low luminosities (Mi <17) has been detected in the local universe, when considering galaxies belonging to clusters (e.g. Popesso et al. 2006), groups (e.g. Gonzalez et al. 2006) or the field (Blanton et al. 2005). Moreover Baldry et al. (2008) find that the local GSMF steepens as well below Log(M/M⊙)∼9.5 M⊙ . From the theoretical point of view, a steep mass func-tion of galactic halos is a robust predicfunc-tion of currently popular models of hierarchical growth for cosmic structure (e.g. Kauffmann et al. 1993; Cole et al. 1994). Never-theless hierarchical models predict that the ratio of low mass halos to massive halos is larger in low-density regions, such as the field, than in the dense cluster regions. Furthermore, a more complicated behaviour of the galaxy luminosity function has been detected in galaxy groups: there is a lack of galaxies at intermediate luminosities (MB=−18, Miles et al. 2004)
Lately the deviation from a simple Schechter function of the luminosity/stellar mass function has been interpreted as a bimodality in galaxy properties, according to which the mass function consists of the sum of two components. However, which bimodal
10In the traditional monolithic collapse picture of galaxy formation (Eggen et al. 1962) all the stars
Figure 9: The galaxy stellar mass function based on ∼50000 galaxies from SDSS (Baldry et al. 2008). It shows evidence for an upturn at the low mass end, and it is fitted with a double Schechter function (dashed line).
galaxy properties can explain the observed behaviour is still a matter of debate (Bol-zonella et al. 2009; Faltenbacher et al. 2010).
It has to be reminded that the major difficulties in constructing a galaxy luminos-ity or mass function in groups and clusters are (1) to avoid contamination from fore/background galaxies (2) to have a sufficient number of member galaxies. The best way to avoid contamination is to measure the redshift of galaxies from their spec-tra (spectroscopic redshift). This technique provides a precision on the measure of the distance of ∼14 Mpc comoving (limited by the cluster velocity dispersion,∼1000 km s−1 ), greatly reducing the contamination. Moreover it is impossible to have
at a reference redshift. Its precision is much reduced when compared to spectroscopic redshifts (the typical precision is 0.1 compared to 0.0001 for spectroscopic redshifts), but a fairly good and inexpensive measure can be obtained for large sample of galaxies. Furthermore redshifts for galaxies that are too faint for spectroscopy can be obtained in this way. The use of photometric redshifts has greatly improved our ability of producing luminosity and mass functions out of multi-wavelength data.
1.7 The baryon mass fraction
Galaxy clusters can be used to study the mix of baryonic and dark matter on a scale that is representative of the matter content of the Universe. Indeed, galaxy clusters form from density fluctuations on a scale of ∼10 Mpc, and no mechanism is known to easily segregate the matter on these scales. Therefore, it is often argued that the baryonic fraction within rich galaxy clusters should reflect the universal baryon frac-tion fb = ΩB/ΩM, where ΩB is the density parameter11 for baryonic matter and ΩM that of all clustered matter.
An independent measure of the baryonic fraction can be obtained from primordial nucleosynthesis constraints on the light–elements abundance. When the universe was about three minutes old, the initial protons and neutrons formed helium (at a mass fraction of ∼22–25%), together with some traces of deuterium,3H and 7Li, and these primordial light–element abundances depend only on the cosmic baryonic density. In particular, the deuterium abundance is most sensitive to ΩBh2, and that can be esti-mated by observing quasar absorption lines.
Also, observations of the Cosmic Microwave Background (CMB) power spectra con-strain very precisely the baryon-to-photon ratio by both the ratios of the odd and even acoustic peaks and by the Silk damping tail (Hu & White 1996, 1997). This information, together with the knowledge of the exact temperature of the CMB, fixes the value of ΩB.
Therefore, combining the value of fb from cluster measurements with primordial nu-cleosynthesis constraints and measurements of the CMB yields an estimate of the cosmological density parameter ΩM=ΩB/fb. This argument has been used by White et al. (1993) to prove that ΩM <1, requiring to abandon one of the basic tenets of the theories of structure formation at that time.
The two known baryonic components in galaxy groups and clusters are stars and gas. The total mass of stars in the galaxies may be estimated by converting the total
11In general the density parameter is the ratio of the density of the given component to the critical
light with an appropriate mass–to–light ratio, or by adding up the stellar masses of individual galaxies. The mass in galaxies in X–ray groups is typically in the range 3×10¹¹–2×10¹² h−1001 M⊙ (Mulchaey 2000). The mass of the ICM can be estimated by model fitting to the X–ray surface brightness profile and X–ray spectroscopy.
However, the exact value of the baryonic fraction from galaxy clusters and groups and its agreement with the CMB measurements is still a matter of debate. Many attempts at estimating the baryon mass fraction in clusters have reported smaller values than the expected ones (Ettori 2003; Lin et al. 2003; Biviano & Salucci 2006; McCarthy et al. 2007). In addition, the discrepancy appears to be larger for groups than for rich clusters (Lin et al. 2003).
Then, some interesting questions are still open: are galaxy clusters and groups repre-sentative of the baryon content of the universe? If not, why?
1.8 Surveys of Galaxy Groups
Although most of the galaxies reside in galaxy groups, their identification is more difficult than for rich galaxy clusters. The reason is straightforward: groups are fainter at all wavelengths. Galaxy groups contain a lower number of galaxies than rich clusters, therefore they are less well defined in the sky, and more affected by contamination from fore/background galaxies. Therefore deeper galaxy surveys are required to identify groups, especially at non local redshifts. Also, they often show a more complicated morphology than clusters, and it is more difficult to conduct an automated search in large galaxy catalogues. The largest optical catalogue of galaxy groups is the one compiled from theSloan Digital Sky Survey(SDSS; Yang et al. 2007), which contains ∼8000 groups with more than 3 galaxies atz <0.2.
However, the most robust way to identify gravitationally bound groups is via detection of their extended X–ray emission. X–ray information enables us to easily obtain an estimate of the total mass of the systems, and thus to define a physically motivated radius to characterise a cluster/group (the virial radius, or R∆). However, since X–ray
groups have a luminosity which is∼10-100 times lower than that of rich clusters and that X–ray flux suffers from a large dimming effect with redshift, a robust identification of groups requires a deep X–ray survey on an area which is representative of the large scale structure of the universe at different redshifts (∼100h−1Mpc; 1 degree at z∼ 1
corresponds to ∼40h−1 Mpc).
2000; Heldson & Ponman 2000). The number decreases drastically at high redshift (e.g. AEGIS Jeltema et al. 2007; Gonzalez et al. 2007; CNOC2 Finoguenov et al. 2009).
In order to perform a complete study of galaxy groups, the X–ray data should also be supplemented by:
• optical data with a sufficient depth to enable the study of the evolution of galaxies within X–ray detected groups (iAB >23);
• a multiwavelength coverage to enable the reconstruction of galaxy SEDs and a robust measurement of the galaxies’ photometric redshift and stellar mass;
• high resolution imaging (<0.1 arcsec), in order to reveal the galaxy morphology also at high redshift.
The only survey, up to now, which combines a large area, deep X–ray data, deep multi–wavelength information and high resolution imaging is the Cosmic Evolution Survey (COSMOS; Scoville et al. 2007).
1.8.1 The COSMOS survey
COSMOS is the largest survey ever made using the Hubble Space Telescope (HST). It covers 2 square degrees (a square field 1.4◦ on a side), with an exposure in I band obtained by a single orbit down to IAB =27 mag. The whole survey consists of data from 640 orbits, over a period of 2 years.
The coverage of such a large area enables the sampling of the large scale structure of the universe, and reduces the cosmic variance as a source of systematic error. Indeed large scale structures as voids, filaments, groups or galaxy clusters occur on scales up to 100 Mpc comoving, and the COSMOS field can adequately map the galaxy evolu-tion for a large range of environments. The COSMOS survey samples∼2×10⁶ galaxies
withIAB <27 mag
The field is centred at RA=10h:00m:28.6s, DEC=+02◦:12’:21.0” (J2000). Here galac-tic extinction is exceptionally low and uniform (<20% variation; Sanders et al. 2007), but the infrared background is higher than in dark fields like the Lockman Hole (Scov-ille et al. 2006a), which are not equatorial. On the other hand, it can be observed by telescopes located both in the northern and in the southern hemisphere.
& XMM–Newton), UV (GALEX), optical (SUBARU), near–infrared (CFHT), mid– infrared (Spitzer), sub–millimetric (MAMBO) and radio (VLA) imaging. In particular the X–ray information provided by the 1.5 Msec observation time with XMM–Newton (53 pointings on the whole field, 50 ksec each) and the additional 1.8 Msec observations withChandra in the central square degree enable a robust detection of galaxy groups down to z∼1.2 (Finoguenov et al. 2007). The imaging survey is complemented by a spectroscopic program (zCOSMOS; Lilly et al. 2007) which provided 20000 spectro-scopic redshifts down to iAB=22.5.
Such a wealth of information is an asset for a study of the coupled evolution of stellar populations, AGN and dark matter throughout an amount of cosmic time which cor-respond to ∼75% of the age of the universe.
1.8.2 The COSMOS photometric catalogue
The COSMOS photometric catalogue (Capak et al. 2007; 2009) includes photometric information for ∼2×10⁶ galaxies in the entire field. The position of the galaxies has
been extracted by the deep i–band imaging obtained with Suprime–Cam mounted on the SUBARU telescope (Taniguchi et al. 2007), and the number of galaxies is in agreement with he number counts in the same band obtained in other surveys. A limit of 80% completeness is achieved at iAB=26.5. The catalogue contains the estimated magnitude for each galaxy in 30 bands, from UV to infrared, and various parameters measured by the fitting of the spectral energy distribution, such as the photometric redshift (from the SED fitting) and the guess of the galaxy spectral type (early–type; Sb/Sc; Starburst; Irregular). The availability of 30 photometric points to constrain the SED, and the use of deep infrared information, enables us to get a typical photometric redshift error of 0.01×(1+z) (1σ). The galaxy stellar mass in the catalogue is measured by the conversion of the K–band magnitude, using mass to light ratio computed in Arnout et al. (2007), and depending on the galaxy type. The typical error on the galaxy stellar mass is ∼30%.
1.8.3 X–ray galaxy groups in the COSMOS field
From a composite mosaic of the XMM-Newton and Chandra X-ray data, it has been possible to detect and measure the flux of extended sources (i.e., groups and clusters) down to a limit of 10−15 erg s−1 cm−2, as described in the corresponding catalogue
(Finoguenov et al. 2007, in preparation).
image, as described in (Vikhlinin et al. 1998b), employing angular scales from 8′′ to 2.1′. Clusters and groups of galaxies were effectively selected by the spatial extent of their X-ray emission, following the approach of Rosati et al. (1998), Vikhlinin et al. (1998b), and Moretti et al. (2004).
The cluster detection algorithm consists of:
1. removal of the background;
2. detection of point–like sources (i.e. AGN);
3. removal of AGN flux from the large scale;
4. search for extended emission.
As a result, a total of ∼300 X-ray extended sources were identified in the redshift range 0 < z < 1.6; they span the rest–frame 0.1–2.4 keV luminosity range 1041 ≤
LX≤1044 erg s−1, which is typically populated by groups and poor clusters.
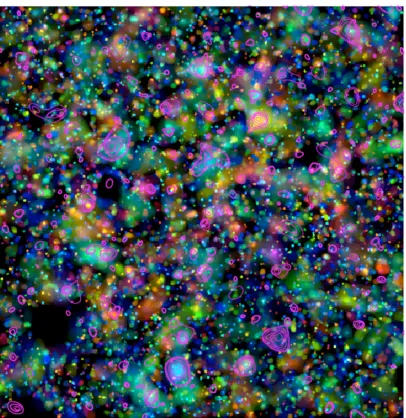
Figure 10: The wavelet reconstruction of the early-type galaxy concentrations searched in the photometric redshift catalogue is color coded according to the average redshift: blue, 0.2; cyan, 0.4; green, 0.6; yellow, 0.8; and red, 1.0. The magenta contours outline the area of the X-ray emission associated with∼300 extended source. The image is 1.5◦on a side [Credit: A.
(a) (b)
(c) (d)
Figure 11: Three–color images for a selection of 4 groups in the COSMOS field. The images are produced using the B-V-Z filters from SUBARU. Images are 3×3 arcmin and centered on the group center. The white line shows the contours of X–ray flux signifi-cance. The contours correspond to [3,9,15,21,27]σ X–ray flux significance. (a) XID11 at z=0.22, M200=1.5×10¹⁴M⊙ (b) XID29 at z=0.35, M200=6×10¹³M⊙ (c) XID64 at z=0.43,
M200=3×10¹³M⊙ (d) XID220 at z=0.73, M200=2×10¹⁴M⊙ is the most massive system in the
Chapter
2
Stellar and total baryon mass fraction in
groups and clusters since z=1
S.Giodini, D. Pierini, A. Finoguenov, G.W. Pratt, H. Boehringer, L. Guzzo, P. Capak, M. Elvis, G. Hasinger, O. Ilbert, J. Kartaltepe, A. Leauthaud, S.J. Lilly, H.J.
McCracken, M. Salvato, D.B. Sanders, N.Z. Scoville, S. Sasaki, Y. Taniguchi
The Astrophysical Journal, Volume 703, Issue 1, pp. 982-993
Abstract
We investigate if the discrepancy between estimates of the total baryon mass fraction obtained from observations of the cosmic microwave background (CMB) and of galaxy groups/clusters persists when a large sample of groups is considered. To this purpose, 91 candidate X-ray groups/poor clusters at redshift 0.1≤z≤1 are selected from the COSMOS 2 deg2survey, based only on their X–ray luminosity and extent. This sample is complemented by 27 nearby clusters with a robust, analogous determination of the total and stellar mass inside R500. The total sample of 118 groups and clusters with
z≤1 spans a range in M500of∼1013–1015M⊙. We find that the stellar mass fraction associated with galaxies at R500 decreases with increasing total mass as M−5000.37±0.04,
independent of redshift. Estimating the total gas mass fraction from a recently derived, high quality scaling relation, the total baryon mass fraction (f500stars+gas=f500stars+f500gas) is found to increase by ∼ 25% when M500 increases from hMi = 5×10¹³ M⊙ to hMi= 7×10¹⁴M
light (11–22% of the total stellar mass), and gas depletion through the hierarchical assembly process (10% of the gas mass), the estimated values of the total baryon mass fraction are still lower than the latest CMB measure of the same quantity (WMAP5), at a significance level of 3.3σ for groups of hMi = 5 ×10¹³ M
⊙. The discrepancy decreases towards higher total masses, such that it is 1σ at hMi = 7×10¹⁴ M⊙. We discuss this result in terms of non–gravitational processes such as feedback and filamentary heating.
2.1 Introduction
The baryon mass fraction is a parameter which can be constrained by the primordial light element abundance set by the nucleosynthesis at very early times. It has been measured to a very high precision from the 5 years Wilkinson Microwave Anisotropy Probe (WMAP5) observations of the Cosmic Microwave Background (CMB), giving a value offbWMAP5= 0.171±0.009 (Dunkley et al., 2009)1. An independent measure of this quantity can also be achieved with galaxy clusters. These structures are large enough to be representative of the baryon content of the universe, which exists mainly in the form of X–ray emitting gas and stars. In the absence of dissipation, they are expected to provide a baryon mass fraction fb comparable to the one measured from the CMB (White et al., 1993; Evrard, 1997).
Galaxy systems appear in a wide range of masses, from ∼1013 to ∼1015 M⊙. In a hierarchical scenario (White & Frenk, 1991) the less massive ones, (M< 1014M
⊙, referred as groups) are the building blocks for the most massive ones (clusters). How-ever, the vast majority of the attempts to estimate the baryon mass fraction in nearby clusters have reported smaller values than expected (Ettori, 2003; Lin et al., 2003; Biviano & Salucci, 2006; McCarthy et al., 2007). In addition this discrepancy appears to be larger for groups than for clusters (Lin et al., 2003). Explanations for this invoke physical processes which lower fb in clusters relative to the universal fraction (see e.g.
Bialek et al., 2001; He et al., 2006), baryon components that fail detection by standard X-ray and/or optical techniques (see Ettori, 2003; Lin & Mohr, 2004), or a systematic underestimate of Ωm by WMAP (McCarthy et al., 2007).
McCarthy et al. (2007) extensively discuss possible explanations for the missing baryons. They concluded that the observed stellar mass function limits the contribu-tion by low mass stars and brown dwarfs to a negligible fraccontribu-tion of the total stellar
1When the WMAP5 data are combined with the distance measurements from the Type Ia supernovae
(SN) and the Baryon Acoustic Oscillations (BAO),fb = Ωb/Ωm = 0.1654±0.0062 (Komatsu et
mass; furthermore they rule out a contribution by large amounts of centrally concen-trated gas, on the bases of inconsistencies with current X–ray data and the assumption of hydrostatic equilibrium. Consideration of the so called intra–cluster light (ICL) re-sults into a discrepancy at the 3.2σlevel with respect to WMAP3 across the mass range 6×10¹³ –1015M⊙ (Gonzalez et al., 2007). As discussed by these authors, systematics may help reconciling their results with the WMAP estimate.
In this respect, the correct determination of the gas mass fraction may be crucial. In fact, studies of the individual baryon components (stars associated with galaxies and gas) have shown that the stellar (fstars
500 =Mstars500 /M500) and gas mass fractions within
R5002(f500gas=M gas
500/M500) exhibit opposite behaviours as a function of the total system
mass. In particular clusters have a higher gas mass fraction than groups (Vikhlinin et al. 2006; Arnaud et al. 2007; Sun et al. 2009), but a lower stellar mass fraction (Lin et al., 2003). This has been interpreted as a difference in the star formation efficiency between groups and clusters (David et al. 1990; Lin et al. 2003; Lagan´a et al. 2008)
On the other hand the mass dependence of the gas fraction and the discrepancy between the baryon mass fraction in groups/clusters and the WMAP value can be understood in terms of non–gravitational processes. In fact AGN–heating (which can drive the gas outside the potential well) or gas pre–heating (which inhibites the gas from falling towards the center of the potential) can explain the lack of gas within r500
in groups. Therefore groups appear as the critical systems to assess the universality of the baryon fraction, and to understand complex physical processes affecting both the gas and the stellar components.
Little work has been conducted on estimation of the baryon mass fraction at the group regime, mainly because of the lack of groups in existing catalogues and the diffi-culty of estimating masses for the individual components and the total. An insufficient sampling of the range in total mass spanned by groups and clusters is problematic for studying their overall properties in terms of mean and scatter of the population 3.
A galaxy group/cluster is the result of the assembly history of the dark matter halo, as well as of the star formation processes affecting the gas. Both processes lead to multivariate outcomes and produce a large intrinsic scatter in the distribution of the observed properties of groups and clusters. Therefore it is essential to have a large enough sample to be representative of the population, and unbiased by selection effects, to be able to investigate the mean trend precisely.
2R
∆(∆=500,200,2500) is the radius within which the mass density of a group/cluster is equal to ∆
times the critical density (ρc) of the Universe. Correspondingly, M∆ = ∆ρc(z) (4π/3)R3∆ is the
mass inside R∆.
3The conclusions of Lin et al. (2003) and Gonzalez et al. (2007), for example, are based only on,
respectively, 27 and 23 systems, but only 3 and 5 of them are less massive than 1014h−1 M
Once such a sample is available, interesting questions to address are: (1) How does the stellar mass fraction behave across the total range of masses? (2) Does the relation between the stellar mass fraction and the total system mass evolve with redshift? (3) How does the gas mass fraction change as a function of the system total mass? (4) Is the total baryonic fraction in groups/clusters of galaxies consistent with the WMAP5 value?
In this paper we select the currently largest X-ray selected sample of groups from the COSMOS 2 deg2 survey which consists of 91 high–quality systems at 0.1≤z≤1.
Existing observations currently do not give constraints on the evolution of the baryonic components in individual systems at z≥0.1. Our data allow us to put constraints on the redshift evolution of the average stellar fraction with mass, which we find to be consistent with zero (§4.2). Observational constraints on the evolution of the average gas mass fraction also suggest zero evolution in the cluster regime (Allen et al., 2004). We assume that this is applicable to our groups in the absence of observations to the contrary and we note that simulations support this hypothesis (Kravtsov et al., 2005). We complement our sample with 27 nearby clusters investigated by Lin et al. (2003) in order to achieve a span of two orders of magnitude in total mass (1013 <M<
1015M
⊙). In§4.3 the total mass of stars associated with galaxies is directly determined for each group, and we investigate the relation between the stellar mass fraction and the total mass of the system. In §4 we combine the stellar mass fraction estimates with the most recent determination of the relation between gas mass fraction and total mass based on a compilation of 41 local (z ≤0.2) X–ray groups and clusters, spanning the same range in mass as ours (Pratt et al., 2009), and we compute the total baryon fraction. We discuss results in § 4.5. We adopt a ΛCDM cosmological model (Ωm = 0.258, ΩΛ = 0.742) with H0 = 72 km s−1 Mpc−1, consistently with
WMAP5 (Dunkley et al., 2009; Komatsu et al., 2009). Unless otherwise stated all quantities are estimated at an overdensity of 500.
2.2 The sample
2.2.1 The COSMOS survey of galaxy groups
photo-metric redshifts (Scoville et al., 2007b), weak lensing convergence maps (Massey et al., 2007), diffuse X-ray emission (Finoguenov et al., 2007) and a combination of these (Guzzo et al., 2007). In particular, the entire COSMOS region was imaged through 54 overlapping XMM-Newton pointings (1.5 Ms, Hasinger et al. 2007). Additional
Chandra observations (1.8 Ms, Elvis et al. 2006) mapped the central region to higher resolution.
In this study we use X–ray detection, gravitational lensing signal, optical photo-metric and spectroscopic data of the clusters and groups identified in the COSMOS survey. The X-ray data reduction is described in detail in Finoguenov et al. (2007) and Finoguenov et al. (in preparation). From a composite mosaic of the XMM-Newtonand
Chandra X-ray data, it has been possible to detect and measure the flux of extended sources (i.e., groups and clusters) down to a limit of 10−15 erg s−1 cm−2, as described
in the corresponding catalogue (Finoguenov et al. in preparation). Extended source detection was based on a wavelet scale-wise reconstruction of the image, as described in Vikhlinin et al. (1998), employing angular scales from 8′′ to 2.1′. Clusters and groups of galaxies were effectively selected by the spatial extent of their X-ray emission, fol-lowing the approach of Rosati et al. (1998), Vikhlinin et al. (1998), and Moretti et al. (2004). The cluster detection algorithm consists of: (1) removal of the background, (2) detection of AGN, (3) removal of AGN flux from large scale, and (4) search for extended emission. As a result, a total of 219 X-ray extended sources were identified in the redshift range 0 < z < 1.6; they span the rest–frame 0.1–2.4 keV luminosity range 1041 ≤ LX ≤ 1044 erg s−1, which is typically populated by groups and poor
clusters.

![Figure 2: Chandra image of HCG 62, a galaxy group with LX∼1043 erg s−1[Credit: ChandraArchive]](https://thumb-us.123doks.com/thumbv2/123dok_us/8129501.1354759/18.595.154.402.109.356/figure-chandra-image-hcg-galaxy-group-credit-chandraarchive.webp)