a
Corresponding author: [email protected]
Counter-Flow Cooling Tower Test Cell
Lukáš Dvořák1,a and JiříNožička1
1CTU in Prague, Faculty of Mechanical Engineering, Department of Fluid Dynamics and Thermodynamics, Technická 4,
Praha 6 - Dejvice, 166 07
Abstract. The article contains a design of a functional experimental model of a cross-flow mechanical draft cooling tower and the results and outcomes of measurements. This device is primarily used for measuring performance characteristics of cooling fills, but with a simple rebuild, it can be used for measuring other thermodynamic processes that take part in so-called wet cooling. The main advantages of the particular test cell lie in the accuracy, size, and the possibility of changing the water distribution level. This feature is very useful for measurements of fills of different heights without the influence of the spray and rain zone. The functionality of this test cell has been verified experimentally during assembly, and data from the measurement of common film cooling fills have been compared against the results taken from another experimental line. For the purpose of evaluating the data gathered, computational scripts were created in the MATLAB numerical computing environment. The first script is for exact calculation of the thermal balance of the model, and the second is for determining Merkel’s number via Chebyshev’s method.
1 Introduction
The need for highly accurate information on the parameters of the different sections of cooling towers, particularly the section containing the cooling fills, proves to be of increasing importance for correct design of high-performance power assemblies today. Cooling fills have come a very long way since their origins, whether in terms of geometry, manufacturing technology or materials used. Thanks to this evolution, the market today offers a great many cooling fills, differing not only in their geometry but often also their working principle.
Due to the complexity of determining the degree of transfer of momentum, heat and mass in two-phase convection in such complex geometries, one needs to make use of experimental methods so that the readings are as little influenced by marginal phenomena as possible, and to ensure the highest possible transferability of the experimental results to actual construction designs.
For these reasons, there is a recognised need for test cells for cooling fills that are of sufficient size to enable measurement of fills of various heights without a major impact on the data.
2 Analysis
The cooling effect in cooling towers is achieved by heat convection and evaporation of the cooled water into the air
flowing through the tower [1]. Evaporation occurs mainly in the fills, which expand the cooling surface. A thin layer of water, known as film, in contact with the flowing air is formed on the walls of so-called film cooling fills.
Cooling towers are highly complex devices in terms of the processes taking place inside. One-dimensional computational models of cooling towers have been compiled in order to simplify the calculations concerning multiple-phase flow or transfer of heat and mass. These models neglect some of the processes taking place in cooling towers in order to attain the simplest computational procedure possible. Some one-dimensional models are highly accurate in spite of their neglect of some processes [2].
The models are formulated as sets of differential equations and composed of equations of the law of conservation of mass and the law of conservation of energy, along with the kinetics of the transfer of mass and energy. Merkel’s method is the oldest and most commonly used; it simplifies the cooling fill model and neglects some less important attributes of the processes taking place during heat and mass exchange. The result is a single ordinary differential equation that can be integrated manually.
There are various numerical integration methods used for approximation of Merkel’s integral equation. These methods differ in their accuracy as well as calculation complexity. The mathematician Chebyshev’s method is a frequently used calculation option.
C
Owned by the authors, published by EDP Sciences, 2014
According to Chebyshev, Merkel’s integral can be replaced with the formula [1]:
ℎ
=
ℎ
=
ℎ
=
(− )
=( − 4 )∆
()+
∆()+
∆()+
∆( )! =
=(4 − )∆1
()+
1 ∆()+
1 ∆()+
1 ∆( )!
(1)
The literature typically denotes Merkel’s number as "# = $ ∙ ∙ &/, where $ = ℎ, = , & = and = .
This simplest method has been used for evaluation of the data and corresponds to the methodology for cooling fill testing issued by the CTI (Cooling Technology Institute) [3].
3 Apparatus
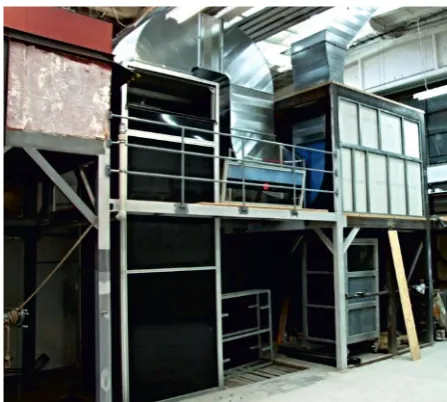
Based on the above assumptions, an experimental assembly had to be built (Figure 1 and Figure 2) that would make it possible to measure all the required quantities with such accuracy as to enable a total energy balance, thus making the overall accuracy as good as possible. This assembly is composed of an air and water system with control SW and the actual test cell, which is a model of a counter-flow cooling tower. This cell allows the installation of fills up to a height of 3.5 m without biasing the readings with the difference in fill heights.
3.1 Experimental line
The entire experimental equipment is built inside a hall laboratory and partly situated over a water channel. Near the cell itself is a control computer, from which the entire experimental stand can be controlled and monitored. The
connection of the water and air branches is the foundation of the stand.
3.1.1 Water system
The keystone of the water system is an elevated water reservoir. The reservoir is equipped with submersible heaters for heating the measurement water and an overspill to maintain a constant flow through the tower. The water is brought into the cooling tower from the elevated water reservoir via a PVC pipeline. The water is transported from the reservoir via the pipeline into the cooling tower model using a pump with an output of 0.72 kW and a flow rate of 24-60 m3/hr. An induction flow meter is installed outside
the water pipeline inlet into the tower model, in order to allow for continuous monitoring of the amount of water flowing through the pipeline and the test cell. A control valve is installed immediately in front of the water pipeline inlet into the tower to regulate the irrigation of the fill. The water circuit discharges into the uppermost part of the model, where hoses connect it to five spray nozzles of a commonly used type. After the water exits the cooling fills, it falls into a collection vessel, from where the water is taken down the centre into a more spacious water channel. The collection vessel is used due to the uneven velocity field and the associated uneven temperature field.
3.1.2 Air system
The design of the air system had to make allowances for sufficient draft through the cooling tower model. A radial medium-pressure fan was designed to provide this. In addition, the influence on the input parameters of the operating condition of the cooling tower model has to be minimised. This requirement led to the design of a discharge for the saturated warm air via a ventilation line outside the laboratory area. A nozzle, installed on the discharge end of the fan, includes readings of both total and static pressure, a thermometer and a humidity sensor to enable correct determination of the air flow rate through the cell.
Figure 2. Experimental line
Figure 1. Experimental line - schematic : 1 – exit valve, 2 – Twout,
3.2 Testing cell
The frame of the model is composed of aluminium profile bars of square and rectangular cross-section of various sizes. The cooling tower model has a square footprint with dimensions of 1.67 x 1.67 metres and is 5 m high. The walls of the model are made of two types of materials. Parts of the walls are made of transparent Plexiglas, allowing one to visually inspect the processes taking place inside the tower and to use optical measurement methods. The remaining walls are made of plates of black opaque polypropylene. The use of black material is an advantage when using optical methods because it reduces noise in the readings.
The lower part of the tower has a door going from the bottom up to 2 m, providing improved access into the tower to allow for installation of any inner structures. Two windows are situated in opposing walls to enable access to the interior of the upper storeys of the model tower.
The model cooling tower is designed as an exhaust system. A radial fan accelerates the air flow. The fan speed, and thus the air flow rate through the tower, can be adjusted using a frequency converter. The air system is connected to the discharge end of the radial fan; it is channelled to the laboratory roof via an air shaft. The air is discharged outside the laboratory in order to achieve invariable input air parameters. If the discharged air went inside the laboratory, the input parameters would be influenced during prolonged measurements.
The chief advantage of the entire cell is the possibility of adjusting the spray system height. This makes it possible to measure fills of different heights without the readings being influenced by the different height of the spray or rain zone. The basis of the adjustable spray system is a frame over a square footprint with dimensions of 1.45 x 1.45 m. Liquid phase drift eliminators are attached to this frame using threaded rods. Spray nozzles are installed in the eliminators. The sliding movement of this adjustable inner structure is achieved using two pulleys and a wire rope.
3.3 Measurement methods
As follows from equation (1), the calculation of Merkel’s number for the fill measurement requires the determination of only a few basic values. Nevertheless, the experimental attainment of these values requires measurement of a relatively large quantity of data. Due to the difficulty in measuring processes that take place in two-phase flow in a cooling tower, and the required levels of accuracy, we had to develop or refine some of the measurement methods used and use some not entirely common gauges. Some of these innovative measurement methods are enumerated and described here.
3.3.1 Air flow
One of these less common measurements is the determination of the air flow rate through the tower. A
vane anemometer is used in normal operational measurements in cooling towers. However, the service life of such anemometers is seriously reduced due to the high humidity of the output air, and the readings are distorted by small droplets exiting the tower sticking to the anemometer vanes. Another drawback of using a vane anemometer lies in its low accuracy at very low velocities (up to 10% at 1 m/s); what is more, the mass flow of air through the tower would be derived from point velocity, which again reduces the accuracy given the uneven velocity profile.
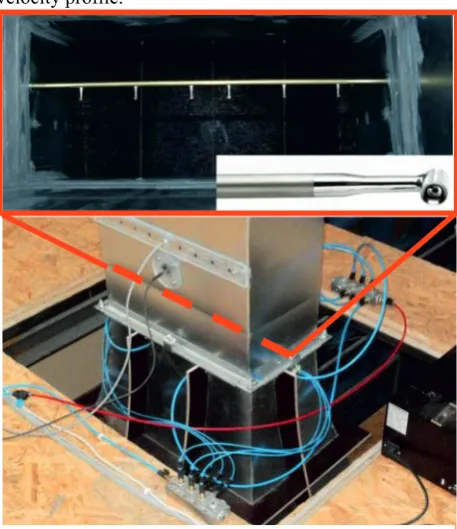
These reasons led to the attachment of a contraction in the form of a nozzle to the fan output; a multi-pitot probe with six readings of total pressure and six of static pressure was inserted in its narrowest point (Figure 3). The accuracy of the air flow rate measurement using this method had been verified by measuring a velocity field in 154 points using a five-opening probe. The results indicate an agreement between the volume flow rate measured by the five-opening probe and the multi-pitot probe of less than 1%. The chart in Figure 4 shows a relatively uniform velocity field except for a massive wake situated approx. 160 mm past the multi-pitot probe body.
Figure 3. Airflow measurement
Figure 4. Velocity field in contraction
0 0.1 0.20.3
0.40.5
0 0.05 0.1 0.15 0.2 0.25
30 40 50
x (m) y (m)
v
(m
s
3.3.2 Air humidity
The problem with the majority of current humidity probes is their reduced accuracy when measuring very high relative humidities; the air exiting a cooling tower is typically at the saturation threshold, and there are even cases where the air exiting a cooling tower is misty and over-saturated.
For these reasons, a new aspiration psychrometer was designed, built and tested for measurement of the amount of water vapour suspended in the dry air (Figure 5). The psychrometer is based on a small radial fan whose suction side has a pipeline attached to it with a Pt100 resistance temperature probe. A stocking hose is mounted on the temperature probe; its bottom end is submersed in a container of distilled water.
Two such psychrometers are installed at the outlet side of the model cooling tower, and two more at the inlet. All of the psychrometers used were tested for several different humidities before installation in the experimental stand.
3.3.3 Static pressure
Due to the liquid phase contained in the flow of air through the tower and the segmented nature of the tower walls, it is impossible to use a normal approach to measuring the static pressure by reading in a wall. Such reading points are often blocked by water droplets and often require cleaning with a compressed air jet. A special probe (Figure 6) was designed for measuring the static pressure inside the tower for this reason; it enables continuous measurement without the need for any blow cleaning. The functionality of the probe was tested inside a wind tunnel before installation.
4 Results and observations
4.1 Pressure loss
The pressure loss of the fills was measured for three different water loads of the film cooling fill. For each of the water loads, the dependency of the static pressure above the fill was compiled for 10 different velocities. The pressure conditions were measured using a Rosemount 3051SC differential pressure sensor with a maximum range from -750 Pa to 750 Pa with a restriction for 0 – 200 Pa, at which the rated accuracy of the device is 0.025%.
Given the large size of the fills and the geometry and location of the measurement cell, an even velocity profile cannot be expected at the inlet of the fill. The profile will most likely alter considerably depending on the size of the pressure loss. For that reason, it is not possible to simply determine the pressure loss according to the normal pattern, where the difference in pressures in front of and behind the measured item (cooling fill, in our case) is measured first, and then the measurement is repeated in the same configuration but without the measured item. This approach can be employed assuming only minor changes in the velocity fields due to the installation of the measured item. The approach outlined in Figure 7 was designed in order to minimise this error. In this approach, the error arising from the difference in the velocity field is minimised by measuring the difference between five and six layers of the fill. The difference in the static pressures measured behind five fills and six fills is also increased with a water rain that forms on the spot of the removed sixth fill. The pressure loss due to this water shower can be determined, with a minor neglect, as the length portion of the pressure loss defined as the difference between the irrigated and non-irrigated cell without any fills.
Chronologically speaking, we first measured the dependency of the static pressure in the cell alone without any fills, and for a zero water flow rate and three more
Figure 5. Psychrometer
Figure 6. Static pressure probe
Figure 7. Pressure drop measurement schematic
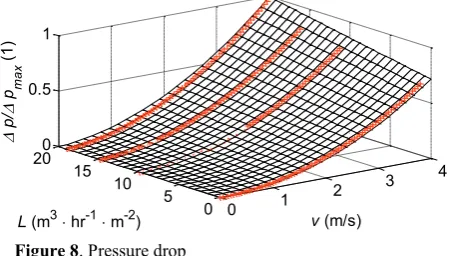
Figure 8. Pressure drop
0 1
2 3
4
0 5 10 15 200 0.5 1
v (m/s)
L (m3 hr-1 m-2)
'
p/' p ma
x
water flow rates. Subtracting the pressures measured for the empty cell without any water flow from the pressures measured for the different flows, and dividing that by the height of the measurement cell, yields the equivalent for the unit pressure loss due to the water shower.
In the next measurements, the fills were installed in the cell, and the dependence of the static pressure on the water velocity and flow rate for the fill heights of 1.8 and 1.5 m was measured. Subtracting the pressures measured for each height and identical water flow rate would yield the pressure loss per layer of cooling fill, assuming that no pressure loss due to rain occurs on the spot of the removed sixth fill when measuring the five layers of fill. Applying the pattern outlined above, and shown in Figure 7, to the data from all the flow rates results in the dependence outlined in Figure 8. If we use the mass flow rate through the cell as another variable, we can unfold these dependencies areally.
4.2 Heat and mass transfer
The stand testing as part of the thermodynamic measurements was conducted on six layers of film fill identical to that used for the pressure drop measurement. The measurements were carried out for three different air flow rates in combination with three different water flow rates, always at an inlet water temperature of 40 ± 0.6°C.
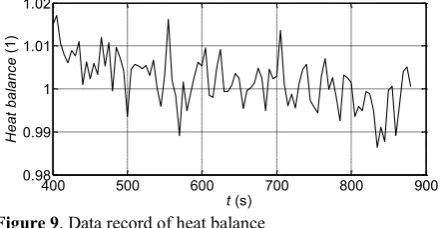
Continuous measurement is impossible due to the relatively high power taken by the test cell at these settings (approx. 0.5 MW). Each of the nine points was interpreted from data that are evaluated continuously during the measurement and recorded in a file for subsequent post-processing. The points are recorded every five seconds, and the measurement takes approx. 30 minutes (depending on the water flow rate); the processes taking place in the tower can be considered stabilised after approx. 10 min. The heat balance between the enthalpy of water and air and Merkel’s number are then calculated from the data recorded after the stabilisation. An example of a stabilised balance depending on time is shown in Figure 9. The figure indicates an excellent agreement between the heat added to the air and that taken away from the water. It must be noted that if we make a 1% mistake, e.g., in the water or air flow, the balance will also shift by approx. 1%.
After all the nine points were measured, the Merkel’s number values were calculated, standardised and plotted in the chart (Figure 10) depending on the proportion of the mass flows of water and air. These data could then be compared with the data obtained from another experimental stand and provided by the fill manufacturer.
5 Conclusion
A laboratory stand was built to allow experimental determination of aerodynamic and thermodynamic processes in cooling fills as well as other parts of cooling towers. The stand makes it possible to measure cooling fills used in ordinary cooling towers. A great advantage of the test cell is the possibility of measuring cooling fills of various heights up to 3.5 m without any influence on the results of a greater rain or spray zone. The device was tested and its functionality was verified by measuring pressure loss and Merkel’s number for several modes. The result charts (10) indicate that they are in excellent agreement with the values measures in other experimental stands.
6 Acknowledgement
This work has been supported by Technology Agency of the Czech Republic under the project Advanced Technologies for Heat and Electricity Production - TE01020036.
Some of the measuring equipment has been purchased by Centre for research of multiphase flow and thermodynamics processes in renewable sources and energetics - NEW ENERGY reg. n. CZ.2.16/3.1.00/22130 supported by European Union.
References
1. D. G. Kröger, Air-Cooled Heat Exchangers And
Cooling Towers: Thermal-Flow Performance Evaluation
And Design (PennWell Books, 2004)
2. T. Hyhlík, Engineering Mechanics 2013, 19th
International Conference, Svratka, (2013)
3. Cooling Technology Institute, Acceptance Test Code
for Water Cooling Towers, ATC-105, (Houston, Texas,
2000)
4. B. Širok, B. Blagojevič, M. Novak, M. Hočevar, F. Jere, Energy and Mass Transfer Phenomena in Natural
Draft Cooling Towers (Heat Transfer Engineering,
24(3):66–75, 2003)
5. H.C.R. Reuter, D.G. Kröger, Effects of Wettability on
the Performance of Cross-Fluted Counterflow Film Fill (R
& D Journal of the South African Institution of Mechanical Engineering 25, 2009)
Figure 9. Data record of heat balance
400 500 600 700 800 900
0.98 0.99 1 1.01 1.02
t (s)
H
eat
balanc
e
(1)
Figure 10. Comparison of data
0.5 0.6 0.7 0.80.9 1 1.25 1.5 1.75 2 2.5 3 4 0.25
0.3 0.4 0.5 0.6 0.7 0.91
L/G (1)
Me
/Me
ma
x
(1)