Electronic Thesis and Dissertation Repository
11-29-2013 12:00 AM
Essays on Worker Promotion and Wage Growth
Essays on Worker Promotion and Wage Growth
Hugh Cassidy
The University of Western Ontario
Supervisor Dr. Audra Bowlus
The University of Western Ontario
Graduate Program in Economics
A thesis submitted in partial fulfillment of the requirements for the degree in Doctor of Philosophy
© Hugh Cassidy 2013
Follow this and additional works at: https://ir.lib.uwo.ca/etd
Part of the Labor Economics Commons
Recommended Citation Recommended Citation
Cassidy, Hugh, "Essays on Worker Promotion and Wage Growth" (2013). Electronic Thesis and Dissertation Repository. 1728.
https://ir.lib.uwo.ca/etd/1728
This Dissertation/Thesis is brought to you for free and open access by Scholarship@Western. It has been accepted for inclusion in Electronic Thesis and Dissertation Repository by an authorized administrator of
GROWTH
(Thesis format: Integrated Article)
by
Hugh Cassidy
Graduate Program in Economics
A thesis submitted in partial fulfillment of the requirements for the degree of
Doctor of Philosophy
The School of Graduate and Postdoctoral Studies The University of Western Ontario
London, Ontario, Canada
c
This thesis consists of three chapters in the field of labor economics related to worker promotion, hierarchical levels, and wage growth.
Chapter two examines the impact of the skill requirements of an occupation on the likelihood that a worker receives a promotion. Promotion data are taken from the National Longitudinal Survey of Youth 1979, while skill requirements data come from the Dictionary of Occupational Titles. I find that the higher the cognitive skill requirement of an occupation, and the lower the motor and strength skill requirements, the higher the probability that the worker receives a promotion. Introducing skill requirements reduces the effect of the worker’s Armed Forces Qualification Test score on promotion, while it increases the gen-der gap in promotion.
Chapter three assesses the importance of hierarchical levels to skill accu-mulation and career outcomes by estimating an occupational choice model. Us-ing labor market history data from the German Socio-Economic Panel, and task usage data from the German Qualification and Career Survey, I demonstrate that hierarchical level significantly impacts labor market outcomes and task usage within the occupation. To capture these features of the data, I build an occupational choice model with levels where workers accumulate both task-specific and occupation-task-specific human capital through learning-by-doing. I use indirect inference to estimate versions of the model with and without lev-els. Omitting hierarchical levels causes occupation-specific human capital to
levels, eliminating occupation-specific skill accumulation reduces mean wage level by 16.6%, while eliminating task-specific skill accumulation results in a 29.8% reduction.
Chapter four is coauthored with Jed DeVaro and Antti Kauhanen. We in-vestigate the theory that promotion serves as a signal of worker ability using the German Socio-Economic Panel and the Confederation of Finnish Indus-tries. Controlling for worker performance using bonus data and performance-related-pay, we find that promotion probabilities are increasing in educational attainment whereas wage increases from promotion are decreasing in educa-tional attainment for some educaeduca-tional groups, with both results stronger for first than for subsequent promotions. Women have lower promotion probabil-ities than men, though this difference dissipates after first promotions. Evi-dence of promotion signaling is stronger for within-firm than for across-firm promotions.
To the extent that this dissertation has succeeded, it is because of the enormous patience and support, and the thoughtful guidance of my supervisor, Audra Bowlus. She has been, and continues to be, a steadfast supporter and advocate for her students. Without her, I simply would not have completed this thesis.
I would like to thank the many other faculty members who contributed greatly this work, including Chris Robinson, Jed DeVaro, Todd Stinebrick-ner, Greg Pavlov, Ben Lester, Igor Livshits, Jim MacGee, Salvador Navarro, and Lance Lochner. Participants in the Applied Economics workshop and the weekly Labor Lunch meetings are also gratefully acknowledged.
The support staff at Western have been critical to my success. I especially want to thank Yvonne Adams, who showed genuine concern and provided in-dispensable help to all of the graduate students in economics, and Sharon Phillips, who guided me skillfully through the job market process.
My fellow graduate students have been a tremendous source of both per-sonal and academic support during my time at Western. In particular, I would like to thank David Fieldhouse, James Partridge, Andrew Agopsowicz, Jon Rosborough, Eda Bozkurt, Ke Xian Au Yong, Jackie Zhao, Jacob Wibe, Chris Mitchell, Dan Montanera, Javier Cano-Urbina, Mike McCausland, and the many others who have come and gone over the years. You made this expe-rience worthwhile, and helped me to see the light at the end of the tunnel.
I am blessed to have the love and support of the whole Cassidy family. In
this degree.
Most of all, I would like to thank my wife, Theresa, who agreed to marry a graduate student before he had a job. Your faith in me has been constant and without it I could not have kept going.
Manhattan, Kansas Hugh Cassidy
October 18, 2013
Abstract ii
Acknowledgements iv
Table of Contents vii
List of Tables x
List of Figures xiii
List of Appendices xiv
Co-Authorship xv
1 Introduction 1
1.1 Bibliography . . . 9
2 Worker Promotion and Occupational Skill Requirement 11 2.1 Introduction . . . 11
2.2 Existing Literature . . . 16
2.3 Data . . . 19
2.3.1 NLSY79 . . . 19
2.3.2 Dictionary of Occupational Titles . . . 24
2.4 Skill Requirements . . . 26
2.4.1 Principal Component Analysis . . . 26
2.4.2 1970 vs 2000 Census Occupation Codes . . . 31
2.4.3 Skill Requirement Levels and Wages . . . 35
2.5 Results . . . 36
2.6 Conclusion . . . 47
3.1 Introduction . . . 53
3.2 Data . . . 59
3.2.1 German Socio-Economic Panel . . . 59
3.2.2 German Qualification and Career Survey . . . 62
3.2.3 Hierarchical Levels . . . 66
3.3 Model . . . 77
3.3.1 Environment . . . 78
3.3.2 Tasks and Skills . . . 79
3.3.3 Wages . . . 82
3.4 Estimation . . . 83
3.4.1 Occupation Aggregation . . . 84
3.4.2 Simulation and Indirect Inference . . . 87
3.4.3 Sampling Method . . . 88
3.4.4 Auxiliary Model . . . 90
3.4.5 Estimating Standard Errors . . . 98
3.5 Results . . . 100
3.5.1 Parameter Estimates . . . 100
3.5.2 Model Fit . . . 103
3.5.3 Counterfactuals . . . 108
3.6 Conclusion . . . 111
3.7 Bibliography . . . 113
4 The Signaling Role of Promotions: New Evidence from Euro-pean Firms 118 4.1 Introduction . . . 118
4.2 Data and Measures: Finland . . . 130
4.2.1 Variables and Data Selection: Finland . . . 131
4.2.2 Worker Performance Measures: Finland . . . 133
4.3 Empirical Analysis: Finland . . . 136
4.3.1 Promotion Probability: Finland . . . 136
4.3.2 Wage Growth and Promotion: Finland . . . 142
4.4 Data and Measures: Germany . . . 150
4.4.1 Variables and Data Selection: Germany . . . 151
4.4.2 Worker Performance Measurement: Germany . . . 154
4.5 Empirical Analysis: Germany . . . 156
4.5.1 Promotion Probability: Germany . . . 156
5 Conclusion 182
A Chapter 2 Appendix 186
A.1 Additional Tables . . . 186
B Chapter 3 Appendix 191 B.1 Hierarchical Level Assignment . . . 191
B.2 Value Functions . . . 192
B.3 Model Fit: No Levels . . . 194
B.4 Auxiliary Model Moments . . . 196
Curriculum Vitae 201
2.1 Skill Levels and Promotion: Financial Manager versus Building
Manager . . . 14
2.2 Summary Statistics . . . 21
2.3 Log Wage Changes by Event Type . . . 22
2.4 Factor Loadings . . . 29
2.5 Skill Level Correlations . . . 30
2.6 Skill Changes . . . 30
2.7 Skill Levels . . . 30
2.8 Skill Levels: 1970 and 2000 Codes . . . 32
2.9 Skill Levels: 1970 and 2000 Codes, Transition Years . . . 33
2.10 Skill Level Changes: 1970 and 2000 Codes, Transition Years . . . 34
2.11 Wage Regressions with Skill Levels . . . 36
2.12 Promotion Determinants: Marginal Effects of Random Effects Probit, Demographic and Human Capital Variables, Annual Pe-riod (1988-1990) . . . 39
2.13 Promotion Determinants: Marginal Effects of Random Effects Probit, Demographic and Human Capital Variables, Biannual Period (1996-2008) . . . 40
2.14 Promotion Determinants: Marginal Effects of Random Effects Probit, Skill Levels, Annual and Biannual Periods . . . 42
2.15 Wage Change from Promotion . . . 46
3.3 Task Usages . . . 65
3.4 Wages and Hierarchical Level . . . 70
3.5 Occupation Change and Hierarchical Level . . . 72
3.6 Unemployment Wage Change and Hierarchical Level Change . . 75
3.7 Task Usage and Hierarchical Level . . . 77
3.8 Model Parameter Estimates . . . 102
3.9 Auxiliary Model: Wage Change During Unemployment . . . 106
3.10 Auxiliary Model: Occupation Change Regression . . . 106
3.11 Auxiliary Model: Occupation Change Probabilities . . . 107
3.12 Counterfactual Simulations . . . 110
4.1 Autocorrelation Matrix for Worker Performance . . . 135
4.2 Descriptive Statistics, Finland . . . 137
4.3 Multinomial Probit, Promotion Within and Across Firms, Finland 139 4.4 OLS Estimates, Changes in Wage Levels and Log-Wage, Finland 145 4.5 Descriptive Statistics, Germany . . . 157
4.6 Multinomial Probit, Promotion Within and Across Firms, Germany158 4.7 OLS Estimates, Changes in Wage Levels and Log-Wage, Germany 164 A-1 Skill Levels: White-Collar . . . 186
A-2 Skill Levels: Blue-Collar . . . 187
A-3 Skill Level Correlations, Men Only . . . 187
A-4 Skill Level Correlations, Women Only . . . 187
A-5 Skill Level Correlations: 1970 and 2000 Codes . . . 187
A-6 Skill Changes: 1970 and 2000 Codes . . . 188
A-7 Skill Levels: AFQT Quintiles . . . 188
A-8 Skill Levels: High School vs College . . . 188
A-10 Promotion Determinants: Marginal Effects of Random Effects
Probit, Job Variables, Biannual Period (1996-2008) . . . 189
A-11 Wage Change from Promotion (1988-1990) . . . 190
A-12 Wage Change from Promotion (1996-2008) . . . 190
A-1 Auxiliary Model: Fixed Effect Wage Regression . . . 196
A-2 Auxiliary Model: Event Probabilities . . . 197
A-3 Auxiliary Model: Employment to Unemployment Regression . . . 197
A-4 Auxiliary Model: Linear Probability Regressions . . . 198
A-5 Auxiliary Model: Wage Change Regression . . . 198
A-6 Auxiliary Model: Initial Wages . . . 199
A-7 Auxiliary Model: Wages by Age . . . 199
A-8 Auxiliary Model: Wage Change by Events . . . 199
A-9 Auxiliary Model: Overall Occupation-Level Make-up . . . 200
A-10 Auxiliary Model: Occupation Change by Occupation and Age . . . 200
A-11 Auxiliary Model: Other Moments . . . 200
3.1 Overall Wages . . . 104
3.2 Wages: Blue-Collar . . . 105
3.3 Wages: White-Collar . . . 105
3.4 Occupation Composition . . . 105
3.5 Unemployment . . . 105
B.1 Overall Wages, No Levels . . . 194
B.2 Wages: Blue-Collar, No Levels . . . 195
B.3 Wages: Blue-Collar, No Levels . . . 195
B.4 Occupation Composition, No Levels . . . 195
B.5 Unemployment, No Levels . . . 195
A Chapter 2 Appendix . . . 186 B Chapter 3 Appendix . . . 196
The following thesis contains material co-authored by Jed DeVaro and Antti Kauhanen. All authors are equally responsible for the work which appears in Chapter 4 of this thesis.
Chapter 1
Introduction
The underlying themes of my dissertation are worker promotion and hierar-chical level. In chapter two, I investigate the effects of job characteristics, as measured by the skill requirement of a job, on the probability that a worker receives a promotion. In chapter three, I estimate a structural occupational choice model where occupations are composed of hierarchical levels. Chapter four, which is co-authored with Jed DeVaro and Antti Kauhanen, tests the role of promotions in signalling worker ability using two European data sets.
Second, Waldman (1984) analyzes the effect of promotion as a signalling device, where outside firms see only a worker’s hierarchical level (and thus a change in hierarchical level). Lastly, Gibbons and Waldman (1999) model promotions as the movement of workers to a job assignment with higher returns to ability. There have been numerous empirical studies that investigate the effects of job level on worker outcomes such as wages. Notably, Baker, Gibbs, and Holm-str¨om (1994) study a large U.S. financial services firm and document many stylized facts, including that wages are closely tied to job level, and changes in job level correspond to large changes in wages.
In chapter two, I investigate the determinants of promotions using the Na-tional Longitudinal Survey of Youth 1979. While there is a large literature in this area, it has focused mainly on the impacts of worker characteristics on promotion probability. The role of gender in promotion, investigated by Cobb-Clark (2001) and Pekkarinen and Vartiainen (2010), among others, has received particular attention.1 While there has been some investigation of the
effects of job characteristics on promotion, work in this area is minimal. This chapter partly addresses this gap by investigating how the skills required to perform a job impact the probability that a worker receives a promotion. I assign skill requirements to each Census occupation using data from the Dic-tionary of Occupational Titles. This provides a four-dimensional vector for each occupation that describes the Cognitive, Interpersonal, Manual, and Strength 1Other works including Pergamit (1999) and da Silva and van der Klaaw (2011) investigate
skill requirements in that occupation. I use this vector as my control for job characteristics, and run probit estimations to determine what effect skill re-quirements have on the likelihood that a worker receives a promotion.
I find that workers in more cognitively-intense occupations have signifi-cantly higher probabilities of receiving a promotion. Higher motor and strength skill requirements decrease the probability of a worker receiving a promotion, while the effect of the interpersonal skill is either negative or insignificant. In addition to impacting promotion receipt directly, the inclusion of these job characteristics changes the effects of other variables. The effect of education is reduced by 40% when skills are introduced, while a similar reduction occurs in the importance of the Armed Forces Qualification Test (AFQT) scores. I also find that omitting job characteristics causes the gender gap in promotion to be significantly understated: without skill requirement controls, women are 18.5% less likely than men to be promoted in a given year, while with skill re-quirements this difference rises to 29.5% points. I also find little evidence that skill requirement affects the wage change upon promotion, which might offset the impact of higher promotion probability. Overall, these results point to the importance of controlling for job characteristics when investigating promotion outcomes.
confirm previous studies that find job level significantly impacts worker wages. I also show that the probability of occupational change is higher for work-ers in the lowest hierarchical level. Lastly, workwork-ers who experience an un-employment spell and return to a lower hierarchical level than in their pre-unemployment job suffer significantly higher wage losses (roughly 10%) than those who return to the same or a higher level. The latter two empirical ob-servations confirm the importance of level not only to overall wages, but also to job mobility and wage change. They also point to the existence of alloca-tional frictions in the job search process, where workers are not free to move to their preferred occupation-level immediately. I investigate this possibility by estimating an occupational choice model where each occupation is composed of multiple levels and where workers must receive a job offer to change jobs.
however, is that tasks are typically assigned based on a worker’s occupation alone. This is because panel data sets with task usage information are rare. As a result, task usage by occupation is estimated in another data set and as-signed to workers in the panel data set based on their occupation. However, Autor and Handel (2013) find that task usages vary significantly within oc-cupations. Thus, assigning tasks based only on occupation misses potentially important task usage variation. Task usage data are taken from the German Qualification and Career Survey (GQCS), which contains the same job level variable as in the GSOEP. I show that task usage varies within an occupation by level, with cognitive task usage typically increasing with level while man-ual task usage declining. Since the GQCS contains both occupation and level information, I am able to assign task usages by both of these characteristics. This allows for at least some of the within-occupation variation described in Autor and Handel (2013).
and having a higher probability of changing occupations, and the negative im-pacts on wage changes from exiting unemployment to a lower level. I find that both sources of human capital accumulation are important but task-specific skill growth dominates. Counterfactual simulations where task-specific skill growth is eliminated cause a 32.7% decline in overall mean wage level, while eliminating occupation-specific skill accumulation results in only a 17.6% drop. Occupation-specific skills are more important to wage growth for the blue-collar occupation, while task-specific skills dominate in the white-blue-collar occu-pation. I also run counterfactuals on the model version without hierarchical levels. Omitting levels significantly understates the importance of occupation-specific skills to wage growth for the blue-collar occupation, while also under-stating the importance of task-specific skills for the white-collar occupation.
that would be more productive if they were moved to a higher level are not promoted, as the firm would lose their informational advantage, and so there is an inefficient allocation of workers across levels.
DeVaro and Waldman (2012) extend this framework by including a worker characteristic, such as education, that is publicly observable and correlated with the worker’s innate ability. Two key findings result: (1) promotion proba-bility is increasing in education, even conditional on aproba-bility; and (2) wage gains from promotion are decreasing in education level, again conditional on ability level. Also, these results dissipate after the worker receives their first promo-tion. The intuition beyond these results is that the promotion of a less educated worker is more of a surprise to outside firms, who had a low initial belief about their ability, than the promotion of a more educated worker. This requires the current firm to bid up the less educated worker’s wage upon promotion more so than the more educated worker to avoid turnover, making the promotion of less educated workers more costly even controlling for ability. This reduces the pro-motion probability of less educated workers. DeVaro and Waldman (2012) then test these predictions using data from the U.S. firm analyzed by Baker, Gibbs, and Holmstr¨om (1994), and the results largely confirm the theory. However, since this is only a single firm, generalizing the results is problematic.
1.1
Bibliography
BAKER, G., M. GIBBS,ANDB. HOLMSTROM¨ (1994): “The internal economics of
the firm: evidence from personnel data,”The Quarterly Journal of Economics, 109(4), 881–919.
COBB-CLARK, D. A. (2001): “Determinants of and Payoffs to Internal
Promo-tion for Young U.S. Men and Women,”Worker Wellbeing in a Changing Labor
Market, 20, 339–372.
DA SILVA, A., AND B. VAN DER KLAAUW (2011): “Wage Dynamics and Pro-motions Inside and Between Firms,”Journal of Population Economics, 24(4), 1513–1548.
GATHMANN, C.,ANDU. SCHONBERG¨ (2010): “How General Is Human Capital? A Task-Based Approach,”Journal of Labor Economics, 28(1), 1–49.
GIBBONS, R.,ANDM. WALDMAN(1999): “A Theory of Wage and Promotion Dy-namics Inside Firms,”Quarterly Journal of Economics, 114(4), 1321–1358.
MCCUE, K. (1996): “Promotions and wage growth,” Journal of Labor
Eco-nomics, 14(2), 175–209.
PEKKARINEN, T., AND J. VARTIAINEN (2006): “Gender Differences in Promo-tion on a Job Ladder: Evidence from Finnish Metalworkers,”Industrial and
Labor Relations Review, 59(2), 285–301.
PERGAMIT, M. (1999): “What is a promotion,” Industrial and Labor Relations
Review, 52(4), 581–601.
POLETAEV, M., AND C. ROBINSON (2008): “Human Capital Specificity:
Evi-dence from the Dictionary of Occupational Titles and Displaced Worker Sur-veys, 1984-2000,”Journal of Labor Economics, 26(3), 387–420.
SANDERS, C. (2012): “Skill Uncertainty, Skill Accumulation, and Occupational
Choice,”Working Paper, pp. 1–46.
WALDMAN, M. (1984): “Job Assignments, Signalling, and Efficiency,” RAND
Journal of Economics, 15(2), 255–267.
YAMAGUCHI, S. (2010): “Career progression and comparative advantage,”
Labour Economics, 17(4), 679–689.
(2012): “Tasks and heterogeneous human capital,” Journal of Labor
Chapter 2
Worker Promotion and
Occupational Skill Requirement
2.1
Introduction
This chapter estimates the impact of occupational characteristics on the prob-ability that a worker receives a promotion. Specifically, it examines the effects of occupational skill requirements, as measured by the requirements of cog-nitive, interpersonal, motor, and strength skills, on promotion receipt. I find that the skills required in an occupation do, in fact, have a significant effect on the probability that a worker receives a promotion. In particular, workers in occupations with higher cognitive skill requirement have a significantly higher probability of receiving a promotion.
life-cycle wage growth.1 As a result, there is a large literature studying both the determinants and effects of promotions on workers. The current literature has focused mainly on the effects of worker characteristics and, to a lesser ex-tent, firm characteristics, on the likelihood of promotion. Particular focus has been given to the role of gender in the promotion process, while little atten-tion has been paid to the effects of job characteristics on a worker’s promoatten-tion probability.
I use the skills required to perform a job as measures of a job’s characteris-tics. The occupational skill requirement measure employed here, used in both Ingram and Neumann (2006) and Poletaev and Robinson (2008), incorporates a measure of the skills required to perform a job from the Dictionary of Occupa-tional Titles (DOT). Every DOT job title consists of a large, 63-element vector of characteristics, and includes variables such as numerical aptitude, strength, eye-hand-foot coordination, etc. Each measures the importance of that par-ticular characteristic in performing a given job. Using Principal Component Analysis (PCA), I reduce this vector to four components: cognitive, interper-sonal, motor and strength. DOT to three-digit Census occupation crosswalks are used to move from DOT job titles to both 1970 and 2000 Census occupa-tion codes. The result is that each three-digit Census occupaoccupa-tion is assigned a 4-dimensional skill vector measuring the skill requirements of that job.
I combine these skill requirements with the National Longitudinal Survey 1Cobb-Clark (2001) estimates the wage gain at around 30% for promotions alone in a sample
of Youth 1979 (NLSY79). The advantage of this data set is twofold: first, as a panel data set with rich data on workers, it allows me to control for individ-ual worker effects; and second, for certain years (1988-1990 and 1996-2008) it includes a question that asks if the worker has received a promotion at any job since the previous interview. These features have motivated other studies, such as Pergamit (1999) and Cobb-Clark (2001), to use this data set to study promotions. However, these papers consider only the 1988-1990 timeframe. This narrow timeframe restriction is especially limiting for the NLSY79 since the survey’s participants were between the ages of 14-22 in 1979; thus, study-ing a small number of years will miss potentially important life-cycle effects due to the respondents’ narrow age range.
Table 2.1: Skill Levels and Promotion: Financial Manager versus Building Manager
Financial Manager Building Manager Difference Marginal Effect
Cognitive 12.081 9.996 2.085 0.033 Interpersonal 3.789 3.009 0.780 −0.009 Motor 4.557 5.265 −0.708 0.0003 Strength .035 .285 −0.250 0.022
Total 4.63%
Promotion probability difference from skill level differences, Financial Manager versus Building Manager.
The effects of skill requirements on promotion are non-trivial in magnitude. For example, consider two white-collar occupations, Financial Manager and Building Manager, both of which are classified in the same one-digit occupation coding group. Table 2.1 shows the skill levels for these two groups as well as the marginal effects of their skill differences on the probability of promotion.2
Overall, as a result of their differing occupational skill requirements, a Finan-cial Manager has a predicted promotion rate which is 4.63 percentage points higher than a Building Manager, which corresponds to a roughly 25% higher overall promotion rate. Though these occupations have fairly similar skill re-quirement vectors compared to the overall distribution, the relatively small differences between them nonetheless generate a large gap in the predicted promotion rates. As promotions are associated with substantial increases in wages, 9.6% vs 2.4% for promoted vs non-promoted workers in the data used in this chapter, a 4.63% difference in the probability of promotion per year has a significant impact on a worker’s expected future earnings.
2Skill requirements for these occupations are taken for men in the 1970 coding period.
Apart from the skill requirement levels’ direct effects on the probability of promotion, their inclusion also changes the effects of other non-skill variables, often substantially. In both survey periods, the lower promotion probability for high-school versus college graduates is reduced by roughly 40% after skills are included. A similar reduction occurs in the importance of Armed Forces Quali-fication Test (AFQT) scores. These results indicate that at least part of the im-pacts of some individual characteristics, such as education and intelligence, on the receipt of promotion act through their impact on the individual’s job type. College graduates and those with higher AFQT scores tend to be employed in higher-cognitive jobs than high-school graduates and those with lower AFQT scores, and a higher cognitive skill requirement is associated with a higher promotion probability. Though the selection of a worker into a job is impor-tant, individual characteristics persist even after controlling for skills, which indicates that worker heterogeneity plays a role in the promotion process.
2.2
Existing Literature
The importance of promotions has been recognized in the economics literature for some time, and there are large bodies of both empirical and theoretical work on the topic. Three main theories about the effects and uses of promo-tions exist: 1) they serve as rewards in tournaments to induce effort (Lazear and Rosen (1981)); 2) they send a signal to outside employers about a worker’s ability (Waldman (1984)); and 3) promotions are a means of optimally allo-cating a worker to the “correct” production technology, i.e. level, as a result of learning about a worker’s ability and/or a worker’s accumulation of human capital (Gibbons and Waldman (1999)). While these three models of promotion are not necessarily mutually exclusive, and a role for each is almost certainly present to some extent, the Gibbons and Waldman (1999) model is the one that has become the standard in the literature for analyzing within-firm promotion dynamics.
and Dohmen, Kriechel, and Pfann (2004), perform similar analyses on British and Dutch firms, respectively, largely confirming results from Baker, Gibbs, and Holmstr¨om (1994).
Pergamit (1999) and Cobb-Clark (2001) extend the analysis in Baker, Gibbs, and Holmstr¨om (1994) beyond a single firm by studying promotions using the NLSY79. Using data from the 1988-1990 survey period these studies examine both the determinants and outcomes of promotions.3 Cobb-Clark (2001) focuses
on the role of gender in the promotion process, and finds that women are less likely to be promoted and they face higher promotion standards than men; however, the wage growth from promotion for women is larger than for men. Pergamit (1999) examines how the type of promotion, i.e. reports to a higher supervisor or has an increase in responsibilities, affects the determinants and outcome of promotion.
A major limitation of the current work has been its sparse controls for job characteristics. The question of how promotion probabilities are affected by the type of job a worker is performing has not been adequately addressed. While Cobb-Clark (2001) notes the importance of occupation group for promotion re-ceipt, there is substantial variation within any given one-digit occupation code in the skills required to perform a job.4 This chapter more precisely controls for the characteristics of a job by including these skills, and shows that not only 3Francesconi (2001) and Booth, Francesconi, and Frank (2003) use British Household Panel
Survey data and perform similar studies on the determinants and outcomes of promotions in Britain.
do they have statistically significant effects on promotion probabilities them-selves, but their inclusion also affects the impacts of other variables on the likelihood of promotion.
The process used to measure an occupation’s skill requirements derives from work by Ingram and Neumann (2006) and Poletaev and Robinson (2008). Both of these papers utilize the DOT measure of a job’s skill requirements, which, using factor analysis, are reduced to a four-dimensional vector. In In-gram and Neumann (2006), these skills are classified as intelligence, fine mo-tor, coordination and strength, while the four skills in Poletaev and Robinson (2008) are denoted as general intelligence, fine motor, strength and gross mo-tor, and visual skills.5 Based on work suggesting a close match between a job’s
skill requirements and the worker’s actual skill level,6 the skill requirement
levels derived from the DOT can then be interpreted as appropriate measures of a worker’s skill level. As this chapter uses the DOT data to measure features of the job, not the worker, the link between the job’s skill requirements and the worker’s skill level is less important than in other studies.
Instead of the factor analysis approach for deriving skill requirements vec-tors, this chapter uses the principal component analysis technique employed by Bacolod and Blum (2010) and Yamaguchi (2010a). This method requires a
smaller than the population, they are nonetheless large. See Tables A-1 and A-2 in the Ap-pendix, which show the summary statistics for skill levels by white-collar, blue-collar and one-digit occupation group.
5Since a single DOT characteristic can contribute to several skills, and factor analysis is
insensitive to rotations, it is difficult to categorize these skills precisely. However, examination of the main characteristics contributing to the skills yields these interpretations.
priori assumptions about which DOT characteristics contribute to which skills, but allows for correlations to exist between skill levels.7 Furthermore, impos-ing which characteristics contribute to which skills clarifies their interpreta-tion. While neither of these methods is clearly superior to the other, I choose the PCA approach for both the ease of interpretation and to allow for skill cor-relations.
2.3
Data
2.3.1
NLSY79
Worker data come from the National Longitudinal Survey of Youth 1979. This is a panel data set with rich information about a cohort of individuals who were between the ages of 14 and 22 in 1979. These data are useful for this analy-sis since there are two periods, 1988-1990 and 1996-2008, during which the respondent is asked if he or she received a promotion since the previous inter-view. The definition of promotion used here is self-reported, and is not based on a measured change in a worker’s tasks.8 While the self-reported nature of the
promotion variable is of potential concern, it has the advantage of not having to 7There are, in fact, strong correlations between the factors that are derived. See Table 2.5. 8The NLSY79 also includes questions for whether the worker’s responsibilities increased or
rely on either wage or occupational changes to define a change in hierarchical level.9
Spurious occupation changes between periods is a well-known issue plagu-ing many panel data sets, the NLSY79 included. As skill requirement lev-els are linked to occupations, these spurious changes are of concern in this analysis. Some papers, including Neal (1999) and Pavan (2011), assume that all within-firm occupation changes are miscodings. However, as I am inter-ested specifically in promotions, and many promotions would reasonably in-volve changes in occupations, this assumption is not appropriate in this case. Instead, I follow Yamaguchi (2010a) and consider an occupation change as gen-uine only if the worker does not return to the previous occupation during the current firm-employment spell. For example, if a worker begins in occupation A in year 1, moves to occupation B in year 2, then back to occupation A in year 3, I assume the worker is in occupation A for all three periods, and thus no change in occupation has occurred. This correction procedure results in a 31% reduction in the number of occupation changes.10
9Frederiksen, Halliday, and Koch (2010), for example, relies on changes in the occupation
code to denote a promotion. However, as is discussed below, only 39% of promotions in the NLSY79 correspond with occupation changes, while data from the German Socio-Economic Panel suggests that only roughly 20% of promotions in Germany correspond to occupation changes.
10Yamaguchi (2010a) cites a reduction of roughly 40% in occupation changes. The difference
Table 2.2: Summary Statistics
All Men Women
Mean/% s.d. Mean/% s.d. Mean/% s.d.
Age (years) 34.36 6.69 34.19 6.65 34.60 6.72 Black 0.27 0.45 0.25 0.44 0.30 0.46 Hispanic 0.17 0.38 0.18 0.38 0.17 0.38 Two-year Interviews 0.65 0.48 0.64 0.48 0.65 0.48 2000 Codes 0.24 0.43 0.23 0.42 0.25 0.43
Human Capital
Tenure (years) 5.55 5.44 5.58 5.52 5.50 5.34 Experience (years) 12.79 4.81 13.03 4.81 12.48 4.79 AFQT 1 0.16 0.37 0.18 0.38 0.13 0.34 AFQT 2 0.22 0.41 0.20 0.40 0.24 0.43 AFQT 3 0.20 0.40 0.18 0.39 0.23 0.42 AFQT 4 0.21 0.41 0.21 0.41 0.22 0.41 AFQT 5 0.21 0.40 0.22 0.42 0.18 0.38 High School 0.47 0.50 0.52 0.50 0.39 0.49
Job
ln Wage (cents/hr) 6.65 0.46 6.72 0.47 6.55 0.44 Overtime (# hours/week) 1.10 3.69 1.29 4.07 0.83 3.09 Union 0.18 0.39 0.20 0.40 0.16 0.37 Promotion 0.17 0.38 0.17 0.38 0.17 0.38 # promotions 0.42 0.77 0.43 0.80 0.41 0.74
Firm Size
Small Firm (<100 employees) 0.57 0.49 0.61 0.49 0.53 0.50 Medium (100-500) 0.24 0.43 0.22 0.41 0.26 0.44 Large(>500) 0.19 0.39 0.17 0.38 0.21 0.41
Occupation
Blue-Collar 0.46 0.50 0.60 0.49 0.26 0.44 Managers and Prof. 0.16 0.36 0.15 0.35 0.17 0.38 Sales 0.04 0.19 0.04 0.20 0.04 0.19 Admin. and Support 0.17 0.38 0.07 0.26 0.31 0.46 Service 0.09 0.29 0.07 0.25 0.13 0.34 Precision Craft 0.17 0.38 0.27 0.44 0.03 0.18 Operators and Laborers 0.19 0.39 0.26 0.44 0.10 0.30 Technicians 0.18 0.38 0.14 0.35 0.22 0.41 Occupation Change 0.20 0.40 0.21 0.40 0.20 0.40
Observations 39,546 22,720 16,826
Note 1: If units specified, means presented; otherwise, percentages given
Note 2: Statistics of final estimation sample only
Overall, after implementing the preceding correction procedure, 22% of in-dividuals change occupations between two survey periods.11 Among promoted
Table 2.3: Log Wage Changes by Event Type
All Men Women Mean/s.d. Mean/s.d. Mean/s.d.
Promotion 9.50 9.26 9.83 (21.77) (21.67) (21.90) Occupation Change 4.69 4.27 5.27
(23.73) (24.42) (22.73) Promotion/Occupation Change 10.80 9.94 11.87
(21.97) (21.33) (22.71) Promotion/No Occupation Change 8.76 8.89 8.58
(21.62) (21.85) (21.29) No Promotion/Occupation Change 1.99 1.91 2.10
(23.97) (25.23) (22.06) No Promotion/No Occupation Change 2.58 2.19 3.10
(22.53) (23.39) (21.33)
Observations 39,546 22,720 16,826
Note: 100*Log wage changes; wages in cent/hr, 1983 dollars.
occupation stayers.
I consider workers who have stayed with the same firm for at least two con-secutive survey periods during the years when promotion data are available, from 1988-1990 and 1996-2008. As the NLSY79 is biannual after 1994, I have a total of ten years of promotion data. Values included in the estimation are those that occur in the initial period. Thus, the results that are obtained reflect the probability of a worker receiving a promotion between the current and sub-sequent interview periods. There are a total of 113,520 instances of a worker staying with the same firm for two consecutive survey periods. I consider only full-time workers, defined as those working 35 hours per week or more, leaving 88,724 observations. Demotions are dropped,12 eliminating 1379 observations.
11This figure includes the final estimation sample, excluding the 2000-2002 transition period,
since occupation change is impossible to determine due to the change in Census occupation coding scheme.
12Demotions are a rare event in this data; each year roughly 2.3% of workers are demoted,
I clean wage data by dropping observations with wages either in the current or pre-promotion year lower than $3.00/hr, and I trim the top of the wage distribu-tion at the 99% level. I also trim wage change observadistribu-tions at the 1% and 99% levels. This leaves 46,104 observations.13 Other missing data, such as miss-ing tenure and firm size information, eliminate 6558 observations. In total, I am left with 39,546 observations - 13,992 in the one-year (1988-1990) sam-pling period, and 21,468 in the two-year (1996-2008) samsam-pling period. These data represent 8413 individuals and 15,707 worker-firm spells. Table 2.2 shows summary statistics for this sample. There are 6821 promotions and 8069 occu-pation changes, resulting in promotion and occuoccu-pation change rates of 17.3% and 20.4% respectively. Roughly 39% of promotions coincide with occupation changes. These values vary little by gender.
In 2002, the NLSY79 changed from the 1970 Census occupation coding scheme, which had been used since 1979, to the 2000 Census coding scheme. Unfortunately, there exists no one-to-one crosswalk between these two meth-ods of coding occupations. As a result, skill levels derived during these dif-ferent periods may not be fully comparable. This issue is discussed further in Section 2.4.2. In the following two sections, I describe the process by which each three-digit Census occupation code is assigned a four-dimensional skill requirement vector.
2.3.2
Dictionary of Occupational Titles
One of this chapter’s contributions is to incorporate a detailed description of a job, i.e. the skills required to perform that job, into the analysis of promo-tion receipt. The importance of occupapromo-tional skill requirements is supported by Poletaev and Robinson (2008), which provides evidence that human cap-ital is largely specific to a small number of basic skills, as opposed to being primarily firm- or industry-specific. The source of these skill requirements is the Dictionary of Occupational Titles (DOT) and a special version of the 1971 Current Population Survey (CPS). The DOT assigns each of its over 12,000 job titles a vector of characteristics, which measures the requirements of the job. The first component of the DOT code is the worker functions ratings, which de-scribe a job’s complexity of interaction with data, people and things. The DOT code definition trailer includes information on several other groups of charac-teristics, including measures for aptitudes, general educational development and temperament. Each of these groups contains several characteristics. For example, the aptitudes group includes a numerical variable describing the de-gree of numerical aptitude needed to perform a job.14 Together, these provide a
comprehensive vector of characteristics describing each DOT job title.
Since the NLSY79 contains only Census occupation coding, and not DOT coding, it is necessary to convert the DOT job title vector of characteristics 14As an example, the numerical aptitude variable is measured from 1-5, where: 1 = top 10%
into a Census occupational vector of characteristics. For each job title, the DOT master file includes the corresponding three-digit Census occupational code. However, as there are many more DOT job titles than occupations, some occupations have multiple job titles mapping into them. Two DOT job titles mapping to the same Census occupation code may have different characteristic vectors; therefore it is necessary to weight these job titles correctly to properly calculate an occupation’s characteristic vector. To do this, a measure for the fraction of employment in each DOT job title is needed. This construction of weights is made possible by a unique data set, a special version of the Current Population Survey in 1971, in which each of the 60,441 workers are coded with a DOT job title. Using these data, it is therefore possible to assign employment weights to each DOT job title. These weights are then used when assigning characteristic vectors to each three-digit Census occupation code.
is combined with a SOC to Census 2000 crosswalk to generate a DOT to 2000 Census crosswalk. However, some occupations are missing from this crosswalk. To fill in these gaps, a crosswalk developed from dual-coded samples is used.
2.4
Skill Requirements
Having assigned a vector of characteristics to each Census occupation, the next step is to reduce the size of this vector to a more manageable, four-dimensional vector of skill requirements. The following section describes this process.
2.4.1
Principal Component Analysis
the interpretation of what each skill is measuring more difficult.
I use the same skill assignment as Bacolod and Blum (2010) and Yamaguchi (2010a). The DOT characteristics that measure the cognitive skill requirement of a job are: complexity of the interaction with data, three general educational development variables (reasoning, mathematical, and language), and three ap-titude factors (general reasoning ability, verbal, and numerical). The interper-sonal skill is calculated using: complexity of the interaction with people, adapt-ability to influencing people (influ), adaptadapt-ability to accepting responsibility for direction (dcp), and adaptability to dealing with people (depl). Motor skill is measured from variables: complexity of the interaction with things, seven ap-titudes (motor coordination, finger dexterity, manual dexterity, eye-hand-foot coordination, spatial perception, form perception, and color discrimination), and setting limits, tolerance or standards. The last skill requirement, strength, is measured with a single characteristic, strength.15
I perform the PCA separately for men and women and for the 1970 and 2000 Census occupation coding periods, using the entire NLSY79 sample.16 15See Bacolod and Blum (2010) Appendix A for more detailed descriptions of each of these
variables.
16I use the entire sample period to generate the factor loadings, from 1979-2000 for the 1970
The purpose of PCA is to represent a higher-dimensional vector with a lower-dimensional vector of “components”, while maintaining as much of the vari-ation present in the original data as possible.17 The procedure involves cal-culating the eigenvector decomposition of the largest eigenvalue of either the covariance or correlation matrix. The choice of method is potentially impor-tant, since the calculated factor loadings are sensitive to units as well as to differences in the variances of characteristics. This chapter uses the correla-tion matrix approach, since it is advised in the presence of large differences in variance between characteristics.18,19,20 The results, however, change little
when the covariance method is used instead.
Table 2.4 reports the factor loadings for men and women for the two cod-ing schemes. The pattern of factor loadcod-ings is similar to Bacolod and Blum (2010), but not surprisingly differs from Yamaguchi (2010a) where the covari-ance method is used. Using these factor loadings, skill requirements are as-signed to each occupation in my data. Summary statistics for skill levels, male and female, are reported in Table 2.7, while correlations between the skills are
17See Jolliffe (2002) for additional details. 18See Jackson (1991), pp 64-65
19For example, the data variable has a standard deviation of 1.58, while the numerical
ap-titude variable’s standard deviation is only 0.65. Such large differences in the characteristics’ variations advises against using the covariance matrix method.
20Yamaguchi (2010a) uses the covariance method, while Bacolod and Blum (2010) seem to
Table 2.4: Factor Loadings
1970 2000
Men Women Men Women
Cognitive
data 0.373 0.378 0.368 0.368 gedr 0.387 0.384 0.391 0.392 gedm 0.378 0.380 0.376 0.371 gedl 0.385 0.384 0.388 0.390 aptitudg 0.382 0.386 0.381 0.390 aptitudv 0.377 0.383 0.381 0.389 aptitudn 0.363 0.349 0.360 0.343
Interpersonal
people 0.560 0.583 0.568 0.590 tempi 0.403 0.491 0.327 0.399 tempp 0.532 0.402 0.561 0.471 tempd 0.491 0.508 0.506 0.520
Motor
things 0.400 0.409 0.393 0.381 aptitudk 0.384 0.393 0.385 0.402 aptitudf 0.372 0.413 0.366 0.416 aptitudm 0.354 0.357 0.373 0.365 aptitude 0.109 0.031 0.183 0.123 aptitudc 0.272 0.224 0.277 0.260 aptitudp 0.344 0.405 0.328 0.360 aptituds 0.340 0.295 0.341 0.293 tempt 0.330 0.280 0.301 0.300
Note: 1970 codes: prior to 2002; 2000 codes: 2002 to 2008
reported in Table 2.5.21,22 In general, the jobs women hold have higher
cogni-tive and interpersonal skill requirements than the jobs men hold, and lower motor and strength requirements.
There exists a strong, positive correlation between cognitive and interper-sonal skills, a more weakly positive motor and strength correlation, and neg-ative correlations with strength and both cognitive and interpersonal skills. Lastly, Table 2.6 reports summary statistics for skill level changes, both for 21Skill correlations and summary statistics are reported only for the final sample used in
estimation.
22Separate correlations for men and women are shown in Appendix Tables A-3 and A-4.
Table 2.5: Skill Level Correlations
Cognitive Interpersonal Motor Strength
Cognitive 1.00
Interpersonal 0.69 1.00
Motor -0.06 -0.45 1.00
Strength -0.63 -0.51 0.27 1.00
Table 2.6: Skill Changes
All Promoted Only Mean/s.d. Mean/s.d.
Cognitive Change 0.28 0.72 2.43 2.47 Interpersonal Change 0.16 0.39 1.31 1.46 Motor Change −0.11 −0.29 1.96 1.98 Strength Change −0.01 −0.03 0.18 0.18
Observations 8,069 2,476
Note: Only occupation changes included; 2000-2002 omitted
Table 2.7: Skill Levels
All Men Women Mean/s.d. Mean/s.d. Mean/s.d.
Cognitive 8.67 8.49 8.92 2.41 2.50 2.26 Interpersonal 2.14 1.97 2.37 1.32 1.27 1.35 Motor 6.78 7.01 6.47 1.72 1.77 1.60 Strength 0.32 0.39 0.22 0.21 0.20 0.17
Observations 39,546 22,720 16,826
all occupation changes and for only the promoted group.23 A clear pattern
move workers into more managerial and administrative roles, where cognitive and interpersonal skills are especially important.
2.4.2
1970 vs 2000 Census Occupation Codes
The NLSY79 records a Census occupation code for each job. From 1979 to 2000, inclusive, these occupations are encoded using the 1970 Census occu-pation codes, while from 2002 to 2008 the NLSY79 uses the 2000 Census oc-cupation codes. The differences between the 1970 and 2000 coding schemes are substantial. In fact, there is no clear crosswalk between the 1970 to 2000 codes for many occupations. Earlier Census occupation codes, including the 1970 codes, are based on a hierarchical structure, whereas the 2000 occupa-tional codes are organized by “job families”, grouping workers by the output produced, not by services provided.24
As the central focus of this chapter is the effect of skills on promotion re-ceipt, the comparability of the 1970 and 2000 occupation codes is important. I first compare the distribution of worker skill requirement levels in years with 1970 codes versus 2000 codes, shown in Table 2.8. While the 2000 occupation codes yield higher levels of cognitive and interpersonal skills, and lower levels of motor and strength, these changes may be driven by life cycle effects, which 23Only occupation changers are included since skills change only if occupation changes,
ex-cluding the 2000-2002 transition.
Table 2.8: Skill Levels: 1970 and 2000 Codes
1970 2000
All Men Women All Men Women Mean/s.d. Mean/s.d. Mean/s.d. Mean/s.d. Mean/s.d. Mean/s.d.
Cognitive 8.65 8.47 8.90 8.75 8.56 8.99 2.38 2.47 2.24 2.49 2.60 2.32 Interpersonal 2.08 1.92 2.32 2.31 2.13 2.54 1.26 1.20 1.31 1.48 1.47 1.45 Motor 6.80 7.01 6.51 6.71 7.00 6.34 1.69 1.72 1.60 1.80 1.91 1.58 Strength 0.32 0.39 0.21 0.31 0.38 0.22 0.20 0.20 0.16 0.22 0.21 0.19
Observations 30,049 17,462 12,587 9,497 5,258 4,239
Note: 1970 codes: prior to 2002; 2000 codes: 2002 to 2008
correspond to changes described in Table 2.6. It is more appropriate, there-fore, to consider skill levels in periods directly surrounding the coding scheme change, from 1998 to 2002. A large difference in the levels before and after the coding change would imply the existence of a significant break that results from a move to the new coding scheme. Table 2.9 shows the skill level distributions around the time of transition. From 2000 to 2002, cognitive skill levels drop somewhat, which is contrary to their usual upward trend, though the drop, less than a twentieth of a standard deviation, is minor. The increase in interper-sonal skills is slightly greater than typical, though as with cognitive skills the difference is small, while motor and strength levels change little. Thus, there does not appear to be a significant break in the overall distributions of skills around the change in coding scheme.
Table 2.9: Skill Levels: 1970 and 2000 Codes, Transition Years
1970 2000
1998 2000 2002 2004 Mean/s.d. Mean/s.d. Mean/s.d. Mean/s.d.
Cognitive 8.81 8.84 8.73 8.74 2.41 2.39 2.50 2.47 Interpersonal 2.20 2.23 2.31 2.29 1.31 1.31 1.48 1.46 Motor 6.68 6.66 6.72 6.72 1.68 1.68 1.80 1.81 Strength 0.31 0.31 0.31 0.31 0.20 0.20 0.22 0.22
Observations 3,990 3,864 3,273 3,062
negligible net effect on skill level distributions. I investigate this possibility by examining the changes in skill levels between years, again surrounding the change in coding that occurs in 2002. For years before and after 2000-2002, only workers who change occupations have a change in their skill requirement levels, since these levels are associated with their occupation. However, be-tween 2000 and 2002, all workers’ skill levels can change, as their occupations necessarily change between these two years. If there is a significant break be-tween the coding schemes, this will result in a greater variance in the skill change levels between 2000 and 2002 than between other years.
Table 2.10: Skill Level Changes: 1970 and 2000 Codes, Transition Years
1970 Transition 2000
1996 1998 2000 2002 2004 Mean/s.d. Mean/s.d. Mean/s.d. Mean/s.d. Mean/s.d.
Cognitive Change 0.09 0.07 0.11 0.02 0.07 1.23 0.85 1.41 0.83 0.94 Interpersonal Change 0.04 0.04 0.18 0.02 0.05 0.66 0.46 0.95 0.57 0.64 Motor Change −0.03 0.00 0.08 −0.01 −0.03 1.04 0.75 1.26 0.64 0.73 Strength Change −0.00 −0.00 −0.01 −0.00 −0.01 0.09 0.06 0.12 0.06 0.07
Observations 4,117 3,990 3,864 3,273 3,062
change is not as significant as if workers were all changing occupations during either coding period, there does appear to be a non-trivial amount of change occurring.
Robinson (2011) examines involuntary mobility and uses skills to calculate a distance between two occupations related to the differences in their skill re-quirements. The issue of the comparability between the 2000 Census occu-pation coding and earlier schemes is also present in this work. To compare these schemes, an expected distance measure from a worker randomly moving from one occupation to another is calculated for the different coding periods. The result is that, for either coding period, the distances from random mobility have nearly identical distributions. This indicates that there is no break be-tween the coding periods in terms of distance, which provides evidence of the comparability of skills derived from these separate coding schemes.
periods, I estimate the effects of skill levels separately for the 1970 and 2000 coding periods.
2.4.3
Skill Requirement Levels and Wages
In order to demonstrate the importance of the estimated skill requirement lev-els, I perform a regression of the worker’s log hourly wage on their occupational skill requirements. While the estimations include human capital variables (ex-perience, tenure, and education level), demographic variables (age, sex, race, and AFQT scores), and industry and year controls, for brevity, only skill re-quirement levels are shown.25 This is performed for the entire sample, as well
as for men and women separately. As this analysis does not rely on promotion data, the entire NLSY79 panel is used, from 1979 to 2008. Table 2.11 shows the results.
The skill requirement levels have a statistically significant effect on wages, and alone they can explain a large fraction of wage variation. The cognitive skill has a consistently positive effects on wages, while interpersonal and motor have consistently negative effects. The strength skill, though positive overall, has a negative effect for men but a positive effect for women. In addition to this difference in sign between men and women, the effects also vary in magnitude by gender. Overall, women’s wages appear to be more sensitive to the skill requirements of the job, with the absolute value of each coefficient higher for 25Again, for simplicity and brevity, I ignore the potential incomparability between the 1970
Table 2.11: Wage Regressions with Skill Levels
All Men Women
Skills Only Full Model Skills Only Full Model Skills Only Full Model Skill Levels
Cognitive 0.092∗∗ 0.058∗∗ 0.075∗∗ 0.044∗∗ 0.109∗∗ 0.071∗∗ (0.001) (0.001) (0.002) (0.001) (0.001) (0.001) Interpersonal −0.028∗∗ −0.032∗∗ −0.011∗∗ −0.021∗∗ −0.049∗∗ −0.048∗∗
(0.002) (0.002) (0.003) (0.002) (0.003) (0.002) Motor −0.009∗∗ −0.011∗∗ 0.005∗∗ −0.002 −0.021∗∗ −0.014∗∗
(0.001) (0.001) (0.002) (0.001) (0.001) (0.001) Strength 0.079∗∗ 0.104∗∗ −0.057∗∗ −0.041∗∗ 0.168∗∗ 0.188∗∗
(0.010) (0.009) (0.016) (0.014) (0.014) (0.012)
Observations 82,147 82,147 46,942 46,942 35,205 35,205 R2 0.205 0.430 0.168 0.407 0.213 0.442
Standard errors in parentheses
Note 1: Linear regression. Dependent variable: log hourly wage in cents.
Note 2: Columns “Full Model” include age, AQFT, tenure, experience, industry, gender, and race, while columns “Skills Only” include gender.
∗p <0.05,∗∗p <0.01
women than men. Skill requirement levels alone can explain 21% of variation in wages, while the model with demographic characteristics, human capital characteristics, and skills explains 43% of variation.
The conclusions from this regression are twofold: first, the skill require-ments of the job are useful predictors of workers’ wages; and second, the im-pact of skill requirements vary by gender. The latter result motivates the sub-sequent analysis being performed independently for men and women.
2.5
Results
The goal of this chapter is to examine the determinants of promotion, in particular the effects of job characteristics as measured by occupational skill requirements. I explore this question by estimating a probit model, and I take advantage of the panel nature of the NLSY79 by estimating a random effects model.26 Each observation represents a worker staying at a firm for two
con-secutive survey periods, and the dependent variable is whether or not a worker received a promotion between the first and second survey years.
I include several controls for demographic characteristics, including age, race and gender. Human capital is controlled for with tenure, experience, a dummy for high-school versus college graduate, and AFQT quintiles.27 Under
job characteristics, I include the log wage level, firm size, overtime hours,28 and
union status. Year dummies are also added.29
Lastly, I include controls for workers’ occupational skill requirement levels (cognitive, interpersonal, motor and strength). Two separate models are used, one that includes the skill measures and one that does not, and both of these models are estimated for men, women, and the entire sample combined, sepa-rately for the annual and biannual survey periods.
For ease of exposition, the random effects probit results for demographic 26The pooled model results are available upon request. As with Cobb-Clark (2001), the
like-lihood ratio test rejects the hypothesis that no individual effects are present; results discussed are, therefore, based on the random effects model.
27Revised 1989 AFQT scores used.
28Tournament theory predicts that effort exerted is positively related to probability of
pro-motion, thus overtime hours is included.
29Industry controls have negligible effects on promotion probability, thus are excluded from
and human capital variables for annual and biannual periods are presented in Tables 2.12 and 2.13, while skill level coefficients for the two periods are presented in Table 2.14.30 Marginal effects at the population average are re-ported.31 As the gap between periods differs for the annual versus biannual samples, I refrain from quantitative comparisons in the results between these groups, and focus instead on qualitative differences.
I find that women have a 3.2% lower probability of receiving a promotion in a given year during the annual period than men when skills are omitted. How-ever, in the biannual period, the gender gap disappears entirely. Also, while Pergamit (1999) finds that blacks have a lower probability of promotion, I find little effect of race on promotion receipt in the annual period.32 In the
bian-nual period, however, both black and Hispanic men have a higher probability of promotion, 1.6% and 2.8% respectively. For women, race continues to have no effect in the two year period.
I find positive effects of AFQT scores on promotion probability for men in both periods, while only one quintile of scores shows significance in each pe-riod for women when skills are included. Previous studies have shown little effect of these scores on promotion, perhaps due to their linear specification.33 Conditional on being outside of the bottom quintile, AFQT scores in the annual
30Job characteristics are presented in Appendix Tables A-9 and A-10.
31Changes in probability are evaluated at the sample means. Continuous approximation is
used for discrete variables.
32Pergamit (1999) consider only one year, 1990, in their estimation, which might account for
this discrepancy.
33If AFQT scores are included linearly in my model, they similarly have no impact on
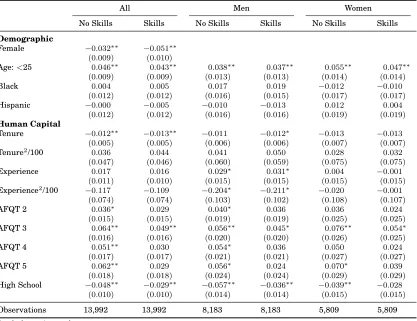
Table 2.12: Promotion Determinants: Marginal Effects of Random Effects Pro-bit, Demographic and Human Capital Variables, Annual Period (1988-1990)
All Men Women
No Skills Skills No Skills Skills No Skills Skills
Demographic
Female −0.032∗∗ −0.051∗∗
(0.009) (0.010)
Age:<25 0.046∗∗ 0.043∗∗ 0.038∗∗ 0.037∗∗ 0.055∗∗ 0.047∗∗ (0.009) (0.009) (0.013) (0.013) (0.014) (0.014) Black 0.004 0.005 0.017 0.019 −0.012 −0.010
(0.012) (0.012) (0.016) (0.015) (0.017) (0.017) Hispanic −0.000 −0.005 −0.010 −0.013 0.012 0.004
(0.012) (0.012) (0.016) (0.016) (0.019) (0.019)
Human Capital
Tenure −0.012∗∗ −0.013∗∗ −0.011 −0.012∗ −0.013 −0.013
(0.005) (0.005) (0.006) (0.006) (0.007) (0.007) Tenure2/100 0.036 0.044 0.041 0.050 0.028 0.032
(0.047) (0.046) (0.060) (0.059) (0.075) (0.075) Experience 0.017 0.016 0.029∗ 0.031∗ 0.004 −0.001
(0.011) (0.010) (0.015) (0.015) (0.015) (0.015) Experience2/100 −0.117 −0.109 −0.204∗ −0.211∗ −0.020 −0.001
(0.074) (0.074) (0.103) (0.102) (0.108) (0.107) AFQT 2 0.036∗ 0.029 0.040∗ 0.036 0.036 0.024
(0.015) (0.015) (0.019) (0.019) (0.025) (0.025) AFQT 3 0.064∗∗ 0.049∗∗ 0.056∗∗ 0.045∗ 0.076∗∗ 0.054∗
(0.016) (0.016) (0.020) (0.020) (0.026) (0.025) AFQT 4 0.051∗∗ 0.030 0.054∗ 0.036 0.050 0.024
(0.017) (0.017) (0.021) (0.021) (0.027) (0.027) AFQT 5 0.062∗∗ 0.029 0.056∗ 0.024 0.070∗ 0.039
(0.018) (0.018) (0.024) (0.024) (0.029) (0.029) High School −0.048∗∗ −0.029∗∗ −0.057∗∗ −0.036∗∗ −0.039∗∗ −0.028
(0.010) (0.010) (0.014) (0.014) (0.015) (0.015)
Observations 13,992 13,992 8,183 8,183 5,809 5,809
Standard errors in parentheses
Note 1: Dependent variable: promotion receipt between interviews; Time period: 1988-1990; Interviews annual
Note 2: Average marginal effects reported; derivatives w.r.t. entire varlist and continuous approximations of discrete variables
Note 3: Job variables and year dummies included in estimation but not displayed
Note 4: Columns labelled skills include skill requirement levels in estimation
∗p <0.05,∗∗p <0.01
Table 2.13: Promotion Determinants: Marginal Effects of Random Effects Pro-bit, Demographic and Human Capital Variables, Biannual Period (1996-2008)
All Men Women
No Skills Skills No Skills Skills No Skills Skills
Demographic
Female 0.007 −0.007 (0.005) (0.005)
Age: 36-45 −0.005 −0.003 −0.002 −0.002 −0.010 −0.007 (0.006) (0.006) (0.008) (0.008) (0.010) (0.010) Age: 46-55 −0.020 −0.017 −0.022 −0.021 −0.021 −0.015
(0.012) (0.012) (0.016) (0.016) (0.019) (0.019) Black 0.010 0.011 0.016∗ 0.017∗ 0.003 0.005
(0.006) (0.006) (0.008) (0.008) (0.010) (0.010) Hispanic 0.022∗∗ 0.021∗∗ 0.029∗∗ 0.029∗∗ 0.013 0.010
(0.006) (0.006) (0.008) (0.008) (0.010) (0.010)
Human Capital
Tenure −0.004∗∗ −0.004∗∗ −0.004∗ −0.004∗ −0.004∗ −0.004∗ (0.001) (0.001) (0.001) (0.001) (0.002) (0.002) Tenure2/100 0.007 0.007 0.007 0.007 0.008 0.008
(0.005) (0.005) (0.007) (0.007) (0.009) (0.009) Experience 0.001 0.002 −0.002 −0.002 0.005 0.004
(0.003) (0.003) (0.004) (0.004) (0.005) (0.005) Experience2/100 −0.007 −0.008 0.002 0.003 −0.013 −0.012
(0.012) (0.012) (0.016) (0.016) (0.018) (0.018) AFQT 2 0.024∗∗ 0.018∗ 0.019 0.016 0.025 0.016
(0.008) (0.008) (0.010) (0.010) (0.013) (0.013) AFQT 3 0.034∗∗ 0.026∗∗ 0.035∗∗ 0.030∗∗ 0.027 0.013
(0.009) (0.009) (0.011) (0.011) (0.014) (0.014) AFQT 4 0.037∗∗ 0.026∗∗ 0.037∗∗ 0.028∗ 0.030∗ 0.017
(0.009) (0.009) (0.012) (0.012) (0.015) (0.015) AFQT 5 0.068∗∗ 0.050∗∗ 0.072∗∗ 0.056∗∗ 0.052∗∗ 0.035∗ (0.010) (0.010) (0.013) (0.013) (0.017) (0.017) High School −0.025∗∗ −0.016∗∗ −0.032∗∗ −0.021∗∗ −0.016 −0.010
(0.006) (0.006) (0.007) (0.008) (0.008) (0.008)
Observations 25,554 25,554 14,537 14,537 11,017 11,017
Standard errors in parentheses
Note 1: Dependent variable: promotion receipt between interviews; Time period: 1996-2008; Interviews biannual
Note 2: 1970 Codes: 1996-2000; 2000 Codes: 2002-2008
Note 3: Average marginal effects reported; derivatives w.r.t. entire varlist and continuous approximations of discrete variables
Note 4: Job variables and year dummies included in estimation but not displayed
Note 5: Columns labelled skills include skill requirement levels in estimation
∗p <0.05,∗∗p <0.01
higher AFQT scores in the biannual period than the annual period.34
Extending the sample also allows for greater age effects to be considered.35 34This observation mirrors the increase in the importance of AFQT scores on wages over a
worker’s career. In the NLSY79, AFQT quintile explains little wage variation in 1979, but the fraction steadily increases over the years, rising to 17% in 2008.
In the annual period, I find that workers under 25 years have a 3.7% higher probability of promotion per year than those in the 26-35 age range - the only other age group in that sample. In the biannual period, the age coefficients are not sufficiently significant to conclude that any real age effect is present.
I turn now to the main findings of this chapter, the effects of skill require-ment levels on promotions. These results are divided into the effects of the skill levels themselves and the effects of including skills on other variables, which can be determined by comparing the non-skill and skill columns. The most sig-nificant and consistent finding in the former group is the importance of cogni-tive skill requirements on promotion probability. For both men and women, in both sample periods, higher levels of cognitive skills are associated with large increases in promotion probability. In the annual period, a one-unit increase in this skill requirement results in a 1.7% increase in the probability of promo-tion in a given year - or, put differently, a one standard deviapromo-tion increase in cognitive skill requirement yields a 4.1% higher probability of promotion each year. This gap is similar in size to the difference between a Financial Manager and a Building Manager from the example considered above.