Analysis of statistical model properties from discrete nuclear
structure data
Richard B. Firestone1,a
Lawrence Berkeley National Laboratory, Berkeley, CA 94720 USA
Abstract. Experimental M1, E1, and E2 photon strengths have been compiled from ex-perimental data in the Evaluated Nuclear Structure Data File (ENSDF) and the Evaluated Gamma-ray Activation File (EGAF). Over 20,000 Weisskopf reduced transition proba-bilities were recovered from the ENSDF and EGAF databases. These transition strengths have been analyzed for their dependence on transition energies, initial and final level ener-gies, spin/parity dependence, and nuclear deformation. ENSDF BE1W values were found to increase exponentially with energy, possibly consistent with the Axel-Brink hypothesis, although considerable excess strength observed for transitions between 4-8 MeV. No sim-ilar energy dependence was observed in EGAF or ARC data. BM1W average values were nearly constant at all energies above 1 MeV with substantial excess strength below 1 MeV and between 4-8 MeV. BE2W values decreased exponentially by a factor of 1000 from 0 to 16 MeV. The distribution of ENSDF transition probabilities for all multipolarities could be described by a lognormal statistical distribution. BE1W, BM1W, and BE2W strengths all increased substantially for initial transition level energies between 4-8 MeV possibly due to dominance of spin-flip and Pygmy resonance transitions at those excitations. Anal-ysis of the average resonance capture data indicated no transition probability dependence on final level spins or energies between 0-3 MeV. The comparison of favored to unfa-vored transition probabilities for odd-A or odd-Z targets indicated only partial support for the expected branching intensity ratios with many unfavored transitions having nearly the same strength as favored ones. Average resonance capture BE2W transition strengths generally increased with greater deformation. Analysis of ARC data suggest that there is a large E2 admixture in M1 transitions with the mixing ratioδ≈1.0. The ENSDF reduced transition strengths were considerably stronger than those derived from capture gamma ray data implying that those data are strongly biased by favored, unhindered transitions.
1 Introduction
The statistical model of the nucleus requires models of average level density and spin/parity depen-dence and the average photon strengths for M1, E1, and E2 transitions. Traditionally level densities have been described by variations of the constant temperature or backshifted Fermi gas models, and spin distributions by Bethe’s spin cutoffparameter [9]. No intrinsic model of the parity distribution is available although the empirical description of Al-Quraishi [10] is sometimes applied. E1 photon strengths are described by the Axel-Brink model [1, 2] and its variations based on the tail of the Giant Dipole Resonance. M1 and E2 photon strengths have no adequate model and are often described by a simple single particle model. They are often ignored as too weak affect statistical model calcula-tions even though at lower level energies in most nuclei there is a significant parity imbalance making then dominant. A necessary feature of statistical models is the that level and gamma ray properties vary smoothly with level or transition energy. No consideration is given to nuclear shell effects which might lead to sharp variations in level density or transition strength.
a e-mail:[email protected] DOI: 10.1051/
C
Owned by the authors, published by EDP Sciences, 2012 epjconf 20122104007/
Much recent discussion of the results of statistical model analysis of experimental data concerns the observation of nonstatistical fluctuations from the models which may be interpreted as nuclear structure effects. This analysis is often stymied by the experimental difficulty determining whether their origin stems from the level density or the transition strength which are usually inseparable in the analysis. Analysis of the transition strengths is further complicated by difficulty in directly determining the relative contributions of M1, E1, and E2 strength. The issue is further complicated by the problem that different experiments on the same nucleus populate different compound nucleus spin/parity com-binations making their comparison more difficult. It is therefore desirable to study level densities and transition strengths independently in order to better understand the underlying processes.
In this paper I will discuss the transition probability data for individual gamma ray transitions that is available from the Evaluated Nuclear Structure Data File (ENSDF) [11] and the Evaluated Gamma-ray Activation File (EGAF) [12]. These data were measured independently of the level density and can provide a clearer picture of the gamma-ray strength functions with respect to transition energy, level excitation, and spin/parity.
2 Photon Strengths
The statistical model E1 photon strength function SXL(E
γ) for multipolaritiesXL is assumed to be independent of spin and parity and defined as
SXL(Eγ)= 1 E2L+1
γ ⟨Γ(J)
ab⟩a
⟨DJ⟩ (1)
where⟨Γab(J)⟩ais the partial radiation width for a transitiona→baveraged over an ensemble of initial levels aof fixed parity πand spin J.DJ is the average level spacing neara.E1 transitions can be described by Axel-Brink theory[1, 2] as
SE1(Eγ)= 1 3π2~2c2E
γ 2 ∑
i=1
σγabs(Eγ|σ(0Ei1),E0(Ei1), Γi(E1)) (2)
wherei=1,2 refers to the two electric Giant Dipole Resonances associated with the dipole vibrations of a deformed nucleus. The Lorentzian resonance photoabsorption cross section is given by
σγabs(Eγ|σ(0Ei1),E0(Ei1), Γ(iE1))= σ0E 2 γΓ2 (E2
γ−E02)2+(EγΓ)2
(3)
andEγis the gamma ray energy,σ0is the maximum cross section,E0is the energy of the maximum, andΓ is the damping width. Additional modifications of the Axel-Brink theory have been proposed by Kopecky and Chrien[3] and Kadmenskij, Markushev, and Furman[4].
The statistical model M1 photon strength is typically defined like the Axel-Brink E1 description where the parametersσ(0Mi1),E0(Mi1), andΓ(iM1) fori = 1,2 refer to the magnetic dipole spin-flip and scissors vibrations. Similarly for E2 transitions
SE2(Eγ)= 1 5π2~2c2E3
γ 2 ∑
i=1
σγabs(Eγ|σ (E2) 0i ,E
(E2) 0i , Γ
(E2)
i ) (4)
where the parameters σ(0Ei2), E0(Ei2), andΓ(iE2) for i = 1,2 correspond to the isoscalar and isovector quadrupole vibrations of the nucleus. Alternately the E1, M1, and E2 photon strengths can be described by the single particle approximation in which case the photon strength is constant.
form electric transitions as
t1/2(γ)(EL)S P=
ln(2)L[(2L+1)!!]2~ 2(L+1)e2R2L (
3L 3)
2(~c Eγ)
2L+1 (5)
and for magnetic transitions as
t1/2(γ)(EL)S P=
ln(2)L[(2L+1)!!]2~ 80(L+1)µ2
NR2L−2 (3L
3) 2(~c
Eγ)
2L+1 (6)
wheree2 =1.440×10⁻¹⁰keV cm,µ2
N =1.5922×10−
38keV cm3, andR=1.2×10⁻¹³A1/3cm. This simplifies to
t1/2(γ)(M1)S P=
2.20×10⁻⁵
Eγ3 s, t1/2(γ)(E1)S P=
6.76×10⁻⁶
E3γA2/3 s, t1/2(γ)(E2)S P=
9.52×10⁶ Eγ5A4/3 s (7) The reduced single particle Weisskopf valuesB(EL;ML)W.u.are given by
B(EL;ML)(W.u.)= t1/2(γ)(EL;ML)S P t1/2(γ)(EL;ML)exp.
(8)
3 ENSDF Transition Probabilities
Evaluators of the ENSDF file have compiled approximately 3202BE1Wvalues, 4549BM1Wvalues and 8797BE2W values. Most values are calculated from the level half-lives where for thekthgamma ray deexciting a level with half-lifet1/2the partial transition half-lifet1/2(γk) is given by
t1/2(γk)=t1/2 n ∑
i=1
Iiγ(1+αi
Ikγ) (9)
summed over all gamma rays i = 1,n deexciting a level and correcting for internal converaionαi. Some values were calculated from Coulomb excitation measurements where
t1/2(γk)EL= C
e2bLB(EL)↓ (10)
t1/2(γk)ML=
C µ2
NbL−1B(ML)↓
(11)
and
C= ln(2)L[(2L+1)!!] 2~
8π(L+1) ( ~c Eγ)
2L+1. (12)
3.1 Transition Energy Dependence
0.000 0.002 0.004 0.006 0.008 0.010 0.012 0.014
0 2 4 6 8 10 12 14
Gamma-ray Energy (MeV)
A
v
e
ra
g
e
B
E
1
W
Exponential fit
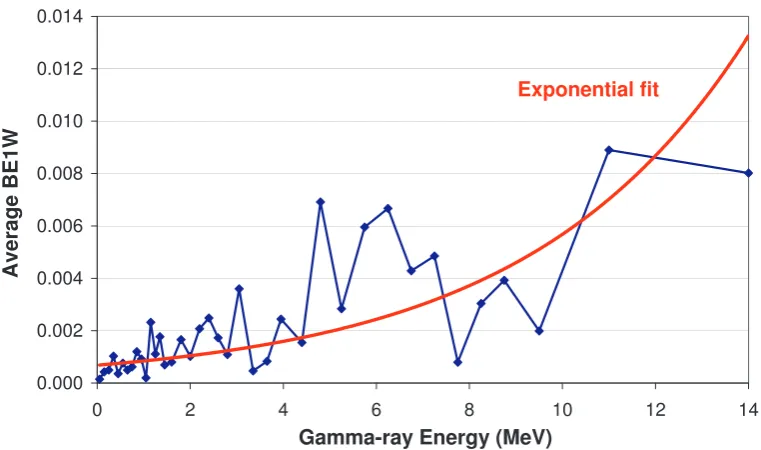
Fig. 1.Energy dependence of ENSDF BE1W values. The smooth line is an exponential fit to the BE1W trend as a function of energy.
0.00 0.05 0.10 0.15 0.20 0.25 0.30 0.35 0.40
0 2 4 6 8 10 12 14 16 18 20
Gamma-ray Energy (MeV)
A v e ra g e B M 1 W Linear fit
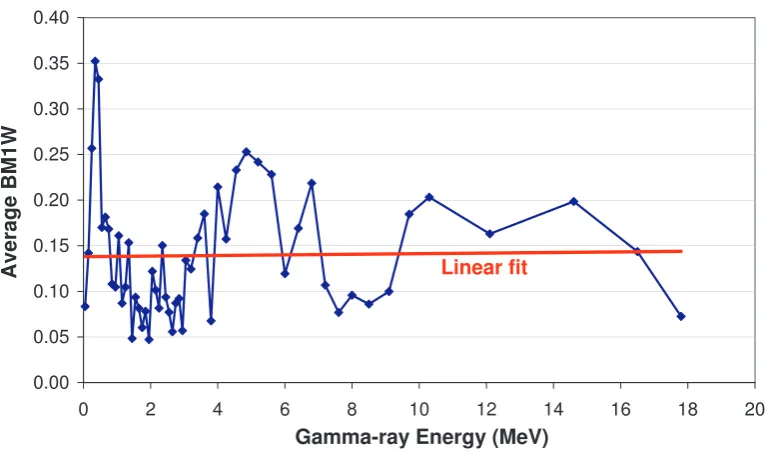
Fig. 3.Energy dependence of ENSDF BM1W values. The straight line is a linear fit to the BM1W trend as a function of energy.
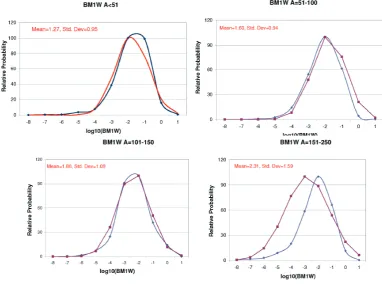
The energy dependence of the BM1W values from ENSDF is shown Fig. 3. The BM1W strength is approximately constant over most of the energy range withBM1W ≈1.4. Significant BM1W strength is seen below 1 MeV and between 4-8 MeV. The ENSDF BM1W values are distributed in a log-normal as shown in Fig. 4.
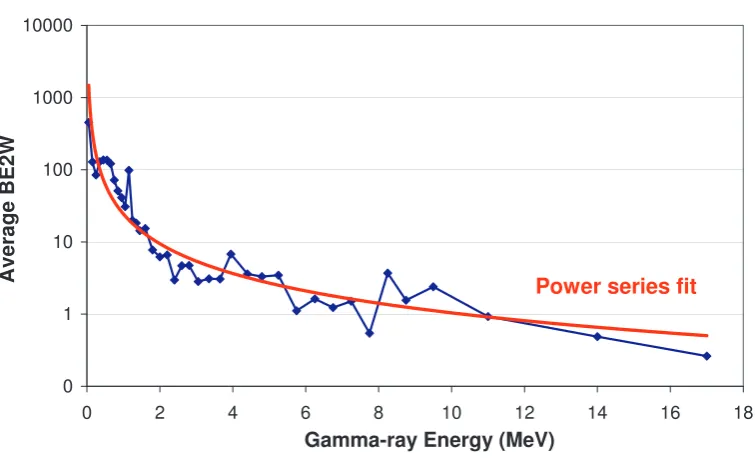
The energy dependence of the BE2W values from ENSDF is shown Fig. 5. The BE2W strength varies dramatically over the energy range and can be fitted by the power series BE2W ∼ 3.15× 10⁵E−γ1.37. The ENSDF BE2W values are distributed in a log-normal as shown in Fig. 6.
3.2 ENSDF Level Energy Dependence
The variation of ENSDF BE1W with initial level energy is shown in Fig. 7, variation of ENSDF BM1W with initial level energy is shown in Fig. 8, and ariation of ENSDF BE2W with initial level energy is shown in Fig. 9. BM1W strength is sharply peaked from levels at 1-2 MeV and in each case there are strong resonances observed at 4-8 MeV. These resonances are clear evidence of nuclear structure effects not included in the statistical model.
4 EGAF Transition Probabilities
The Evaluated Gamma-ray Activation File includes thermal neutron capture gamma ray cross sections measured with the guided neutron beam at the Budapest Reactor [13]. These measurements were performed on all stable elemental targets with Z=1,3-60,62-83,90,92. They were internally calibrated with stoichiometric compounds and mixtures containing the cross sections standards H, N, Cl, S, Na, Ti, and/or Au. For primary gamma rays the reduced transition probabilities BXLW can be determined, as discussed above, from the partial primary gamma ray half-lives which can be calculated by
t1/2(γ)=ln(2) σ0 σγ
~ ⟨Γ0
γ⟩
Fig. 4.Distribution of ENSDF BM1W values for various mass distributions.
where the total radiative cross sectionσ0 and the total gamma ray width⟨Γγ0⟩can be taken from the Atlas of Neutron Resonances [7]. It is noted that⟨Γ0
γ⟩is nearly constant for all levels of a given spin for the heavier elements.
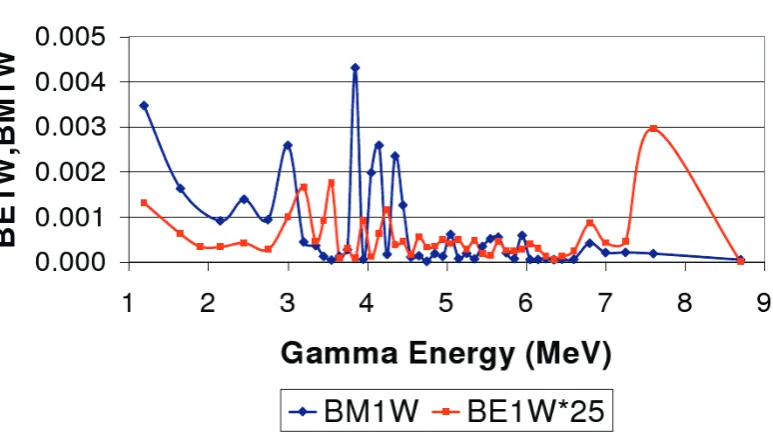
Approximately 2000 primary gamma rays were analyzed for this paper. The variation of the BE1W and BM1W values derived from these data are shown as a function of transition energy in Fig. 10. Both BE1W and BM1W are constant over much of their energy range with strong resonances observed between 3-5 MeV. Unlike the ENSDF transition BE1W probability, the expected increase in BE1W strength with increasing transition energy predicted by Brink-Axel is not observed in these data.
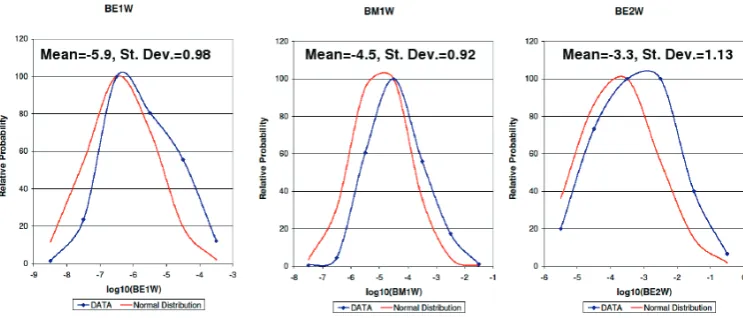
Fig.11 shows the dependence of the EGAF BE1W and BM1W transition probabilities on the neu-tron binding energy. Significant increased photon strength is observed near an excitation of 6 MeV as was the case for the ENSDF data. It should be noted that for capture gamma ray data only a limited number of values of excitation energy can be explored with the few availableSN examples. The dis-tribution of EGAF BE1W, BM1W, and BE2W transition probabilities is shown in Fig. 12. The data can be fit in each case by a log-normal distribution although it is noted that the mean photon strength is significantly weaker in these data than in the ENSDF data.
5 Average Resonance Capture Transition Probabilities
0 1 10 100 1000 10000
0 2 4 6 8 10 12 14 16 18
Gamma-ray Energy (MeV)
A v e ra g e B E 2 W
Power series fit
Fig. 5.Energy dependence of ENSDF BM1W values. The straight line is a linear fit to the BM1W trend as a function of energy.
Table 1.Favored/unfavored ratio for BE1W andBM1W transition probabilities from 2-keV Average Resonance Capture.
Isotope Target Unfavored/Favored Unfavored/Favored
J-1
2 J+
1
2
J-3
2 J+
3 2
spin BE1W BM1W BE1W BM1W BE1W BM1W
106Pd 5 2 +
0.74 0.74 1.00 1.36 0.94
156Gd 3 2
−
0.55 0.67 0.82 0.71 1.19
162Dy 5 2 +
0.55 0.50 1.26 1.12 0.78 0.90
164Dy 5 2
−
1.06 0.89 1.10 1.25 1.91
168Er 7 2 +
0.51 0.53 0.98 1.12 0.78 0.98
174Yb 5 2
−
0.55 1.30 1.21 1.08 1.33 4.32
198Au 3 2 +
0.50 1.13 0.93 0.66
transition probabilities at those excitations. In this paper I have analyzed≈1750 ARC primary tran-sitions measured in95Mo,106Pd,146Nd,155,156,157,158,159Gd,162,164Dy,168Er,174Yb,198Au,233Th, and 239U.
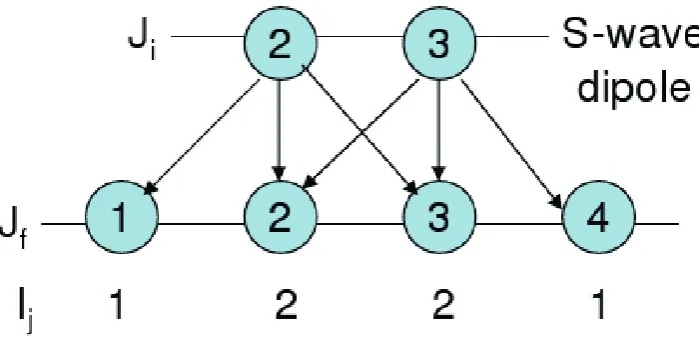
As discussed by Bollinger and Thomas [8], odd-N and odd-Z targets epithrmal neutron capture has favored primary transitions populating levels of the same possible spins of the capture state and unfavored transitions to to levels 1~ higher or lower as described in Fig. 13. This distribution of gamma ray strengths has been tested here for several cases shown in Table 1. In most instances the expected favored/unfavored ratios are observed although for106Pd and164Dy the favored and unfavored transition strengths are nearly equal. Although it is possible that there is an unequal contribution of capture state spins although this should not affect the total favored/unfavored ratio. For 174Yb there appears to be an enhanced population of 2+states from the 2+,3+parent suggesting an overabundance of 2+states in the resonance region.
Fig. 6.Distribution of ENSDF BM1W values for various mass distributions.
probabilities from 2- and 24-keV ARC to final levels in157Gd,162Dy,168Er, and239U. The transition probabilities are remarkably constant populating levels below 3 MeV
The variation of ARC BE1W and BM1W strength with neutron separation energy is shown in Fig. 15. Although the number of cases is small, a significant increase in both transition strengths is observed near 7-8 MeV, similar to what has been observed in the ENSDF and EGAF data.
ARC BE2W strengths have been plotted as a function of deformation in Fig. 16. Although the general trend is for BEW2 to increase with deformation as expected anomalously weak BE2W strength is seen for156Gd (β
2=0.27) and unusually large strength is observed for159Gd (β2=0.28). It should be noted that these are ground state deformations and the situation may differ near the capture state.
Throughout these discussions we have treated the M1 transitions as pure dipole transitions. This is technically incorrect significant E2 admixture is often observed in the ENSDF database. A typical value for the M1/E2 mixing ratioδ∼0.5−1 is generally recommended for ENSDF evaluators when no measured value exists. In ARC data most E2 primary gamma rays are observed and we can de-termine the average BE2W strength. Assuming that the average BE2W strength should compete with BM1W we can apply this correction, as described earlier, and determine the expected mixing ratio. The mixing ratios calculated in this way for ARC are shown in Table 2. The average mixing ratio
δ=1.02 determined in this way is significant but consistent with values found in ENSDF.
6 Discussion
de-Fig. 7.Initial Level Energy dependence of ENSDF BE1W values.
Fig. 9.Initial Level Energy dependence of ENSDF BE2W values.
Fig. 10.Transition energy dependence of EGAF BE1W and BM1W values.
Fig. 11.The dependence of EGAF BE1W and BM1W values on the neutron separation energySN.
Fig. 12.The distribution of EGAF BE1W, BM1W, and BE2W values follows a log-normal distribution (smooth curves).
partly due to the predominance of fast superdeformed and scissors mode transitions in ENSDF that skew the average strengths. It is also likely that experimental data is generally dominated by strong, observable transitions.
Fig. 13.Primaryγ-rays from Average Resonance neutron Capture for odd-A,Z target nuclei populate lower lying levels with the sameJπas the capture state, e.g. J=2 or 3, with twice the probability as transitions to levels with differentJπ, e.g J=1 or 4.
Fig. 15.Variation of Average Resonance Capture BM1W and BE1W strengths with neutron separation energy
SN.
Table 2.M1/E2 mixing ratios determined from BE2W strengths in Average Resonance Capture Data.
Isotope EresARC δ= E2
M1
MeV
106Pd 1 1.15
106Pd 2 1.50
155Gd 2 0.90
156Gd 1 0.86
156Gd 2 0.84
157Gd 1 1.13
159Gd 2 1.32
164Dy 2 0.72
168Er 2 0.57
198Au 2 1.11
233Th 0 1.18
233Th 2 1.02
239U 2 0.89
Average 1.02
From a shell model perspective the origin of increased transition strength at higher excitations can be traced to the shell gaps. At each shell all levels except the highest spin state have the same parity. For E1 gamma rays there are no possible transitions within a shell and only higher seniority states that may be mixed with the GDR are possible. Faster E1 transitions will occur between shells of opposite parity at energies of 4-8 MeV. For M1 gamma rays many fast transitions are possible within the same shell. This appears to indicated in the ENSDF data where a strong peak in BM1W strength is observed below 1 MeV. Conversely the intruder state of opposite parity in each shell can deexcite to its L+1 partner in the neighboring shell, e.gh9/2→h11/2, with a very fast transition with E=4-8 MeV. In beta decay we observe analogous fast, intershell spin-flip transitions with nearly superallowed strength that completely dominate the slower statistical transitions and have largely invalidated the Gross Theory of beta decay. Even as we move away from spherical symmetry the basic transition strengths implied by the statistical model should be retained although distributed over more levels and thus broadened in energy. It is apparent that nuclear structure cannot be ignored in statistical model calculations.
For E2 transitions it is apparent that collectivity plays an important role. We have determined that statistical M1 transitions should be corrected to include substantial E2 admixtures. In nuclei that are highly collective it may be important to treat the E2 contribution more carefully than is often done in statistical model calculations.
It is important to observe that this research only begins to scratch the surface of what might be learned from experimental data. We have yet to look into possible spin/parity and N/Z dependence. For example it would be valuable to verify the relevance of theA2L/3 dependence for EL transitions predicted in the single particle model. The transition probability database developed for this research may be of interest to others and can be obtained by contacting the author.
7 Acknowledgements
This work was supported in part by the U.S Department of Energy under Contract No. DE-AC02-05CH11231.
References
1. P. Axel, Phys. Rev.126, (1962) 671.
3. J. Kopecky and R.E. Chrien, Nucl. Phys.468, (1987) 285.
4. S.G. Kadmenskij, V.P. Markushev, and V.I. Furman, Sov. J. Nucl. Phys.37, (1983) 165. 5. C.E. Porter and R.G. Thomas, Phys. Rev.104, (1956) 483-491.
6. J.M. Blatt and V.F. Weisskopf, Theoretical Nuclear Physics(John Wiley and Sons, New York, 1952) p. 627.
7. S.F. Mughabghab,Atlas of Neutron Resonances(Elsevier, Amsterdam, 2006) 8. L.M. Bollinger and G.E. Thomas, Phys, Rev. Lett.23, (1968) 233-237. 9. A. Gilbert and A.G.W. Cameron, Can. J. Phys.43, (1965) 1446-1496. 10. S.I. Al-Quraishiet al., Phys. Rev.C 67, 015803 (2003).
11. Evaluated Nuclear Structure Data File, a computer file of evaluated experimental nuclear structure data maintained by the National Nuclear Data Center, Brookhaven National Laboratory.
12. R.B. Firestoneet al., IAEA STI/PUB/1263, 2007, 251 pp.