Article
1
Quality Assurance Framework Development based
2
on Six New ECV Data Products to Enhance User
3
Confidence for Climate Applications
4
Joanne Nightingale1, Folkert Boersma2, Jan-Peter Muller3, Steven Compernolle4, Jean-Christopher
5
Lambert4, Simon Blessing5, Ralf Giering5, Nadine Gobron6, Isabelle De Smedt4, Pierre Coheur7,
6
Maya George8, Jörg Schulz9, Alex Wood10
7
8
1 National Physical Laboratory, UK; [email protected]
9
2 Royal Netherlands Meteorological Institute and Wageningen University; [email protected]
10
3 Mullard Space Sciences Laboratory, University College London, UK; [email protected]
11
4 Royal Belgian Institute for Space Aeronomy (BIRA-IASB), Brussels, Belgium; [email protected];
j-12
[email protected]; [email protected]
13
5 FastOpt GmbH, Hamburg, Germany; [email protected]
14
6 European Commission, Joint Research Centre (JRC), Italy; [email protected]
15
7 Université Libre de Bruxelles, ULB, Atmospheric Spectroscopy, Quantum Chemistry and Photophysics,
16
Brussels, Belgium ; [email protected]
17
8 Laboratoire Atmosphères, Milieux, Observations Spatiales, University of Paris, France;
18
19
9 European Organisation for the Exploitation of Meteorological Satellites (EUMETSAT), Germany;
20
21
10 CGI, UK; [email protected]
22
23
* Correspondence: [email protected]; Tel.: +44-777-554-275
24
25
26
Abstract: Data from Earth Observation (EO) satellites are increasingly used to monitor the
27
environment, understand variability and change, inform evaluations of climate model forecasts and
28
manage natural resources. Policy makers are progressively relying on the information derived from
29
these datasets to make decisions on mitigating and adapting to climate change. These decisions
30
should be evidence based, which requires confidence in derived products as well as the reference
31
measurements used to calibrate, validate or inform product development. In support of the
32
European Union’s Earth Observation Programmes Copernicus Climate Change Service, the Quality
33
Assurance for Essential Climate Variables (QA4ECV) project fulfilled a gap in the delivery of climate
34
quality satellite derived datasets by prototyping a robust, generic system for the implementation
35
and evaluation of Quality Assurance (QA) measures for satellite-derived ECV climate data record
36
products. The project demonstrated the QA system on six new long-term, climate quality ECV data
37
records for surface Albedo, Leaf Area Index, FAPAR, NO2, HCHO and CO. Provision of
38
standardized QA information provides data users with evidence-based confidence in the products
39
and enables judgement on the fitness-for-purpose of various ECV data products their specific
40
applications.
41
Keywords: Essential Climate Variables; Climate Data Records; Earth Observation Satellites; Quality
42
Assurance; Traceability; User Requirements; Climate Applications; Surface Albedo; LAI; FAPAR;
43
NO2; HCHO; CO.
44
45
46
1. Introduction
47
Climate change mitigation and adaptation have risen to the top of the agenda for many
48
governments and international organisations [1]. In particular, the Paris Agreement from 2015 [2]
49
aiming at strengthening the global response to the threat of climate change is requesting systematic
50
observation of the climate system. This has led to the establishment of space and research agency
51
programs dedicated to increasing scientific understanding of the Earth system and its response to
52
natural and/or human-induced changes. Key to this is the derivation of quantitative variables
53
describing the chemical and physical properties of the biosphere using Earth Observation (EO)
54
satellites. More recently, emphasis has been placed on the development of Climate Data Records
55
(CDRs) of Essential Climate Variables (ECVs) to characterize and monitor long-term (20+ years)
56
trends and fluctuations. There are currently 54 ECVs defined by the Global Climate Observing
57
System (GCOS) spanning the atmospheric, oceanic and terrestrial domains [3, 4]. These variables can
58
be derived directly from in situ observations or indirectly from remote sensing instruments flown on
59
airborne or satellite platforms.
60
Fundamental to the scientific understanding of the Earth System and its response to change and
61
progress in policy making, is a rigorous quantification of the accuracy and validity of these CDRs
62
produced from EO satellites [3-5]. Although EO data and products are widely available, it is still rare
63
for them to have reliable and fully traceable information concerning their generation process and
64
their quality. Setting achievable accuracy requirements that can be quantified with confidence is a
65
challenging task that is dependent on the intended use of the data. Both GCOS and OSCAR (WMO’s
66
Observing Systems Capability Analysis and Review tool) publish and regularly review the quality
67
requirements that satellite-derived variables should satisfy to support the work of the UNFCCC
68
(United Nations Framework Convention on Climate Change), IPCC (Intergovernmental Panel on
69
Climate Change) and WMO (World Meteorological Organization) Programmes. But these
70
requirements do not specifically address specific applications and their usage to quantify confidence
71
in existing data products remains difficult. The situation is exacerbated because different versions of
72
the same ECV parameter are offered by various data providers. For example, an internet search (2018)
73
revealed upward of 30 satellite-derived LAI and FAPAR data products are available for download,
74
with even more for other ECVs such as Sea Surface Temperature (~55), Soil Moisture (~62) and Ozone
75
and Aerosols (~180). Further, most operationally derived ECV products adhere to different
76
definitions and assumptions, which are not standardised among the international EO and ecological
77
communities. These data products are created with independent or multiple sources of EO data using
78
an array of retrieval algorithms and assumptions. They are also provided at different spatial and
79
temporal resolutions over varying time periods.
80
Regulatory frameworks requiring EO data and product producers to be held accountable for
81
ensuring the quality, accuracy and validity of the information provided, do not currently exist, nor
82
do the standards against which data quality should be monitored [6]. However, given the
83
increasingly prominent role that quantitative EO products assume in climate monitoring
84
applications, it is inevitable that the quality of these data will come under increasing scrutiny in the
85
future [6]. There is a clear requirement for continued investment by data product providers for: 1)
86
detailed assessment of EO data product quality including characterization of their associated
87
uncertainties; 2) provision of this product quality information in a standardized and comprehensible
88
format to help data users navigate the wealth of ECV data products available to them and ensure
89
they are applying the best data for their application, and 3) progression of internationally endorsed
90
methods and good practices for this purpose.
91
92
2. QA4ECV
94
QA4ECV (Quality Assurance for Essential Climate Variables) was a EU Seventh Framework
95
Programme (FP7) funded project (2014-2018) comprising of a partnership of key European scientists,
96
data providers, developers of future climate services, as well as a national metrology institute. The
97
partners have significant roles in: international metrology; EO coordinating bodies such as CEOS
98
(Committee on Earth Observation Satellites) and CGMS (Coordination Group for Meteorological
99
Satellites); space programs such as the European Space Agency’s Climate Change Initiative (ESA
100
CCI), the EUMETSAT operational provision of CDRs, international satellite data validation activities;
101
ground-based reference measurement networks such as NDACC (Network for the Detection of
102
Atmospheric Composition Change); as well as various related FP7 and H2020 projects.
103
The project had three main objectives: 1) Development of a robust, generic system for quality
104
assurance of satellite data products that can be applied to many ECVs as a prototype of a sustainable
105
service; 2) Generation of multi-decadal CDRs for atmospheric and terrestrial ECVs that are based on
106
inter-satellite calibrated data, state of the art retrievals and are traceable with uncertainty metrics;
107
and 3) Engagement with stakeholders, governance bodies and end-users to demonstrate how trusted
108
satellite data and a reliable means of interoperability can facilitate users in judging the
fitness-for-109
purpose of the ECV CDRs. All project information is available online at: http://www.qa4ecv.eu/.
110
111
3. QA4ECV QA System
112
The purpose of developing and implementing a Quality Assurance (QA) system is two-fold: 1)
113
to provide ECV data product producers/science teams with the necessary resources (internationally
114
endorsed tools, standards, methodologies) to develop products with embedded QA information that
115
is presented in a clear and common format throughout the EO community; and 2) to provide data
116
users with robust QA information as a means to quantitatively assess uncertainty and
fitness-for-117
purpose of the data and derived products. Provision of such QA information demonstrates
118
traceability of products and simplifies comparisons between the same ECV produced by independent
119
science teams. It also provides data users with evidence-based confidence in the products and enables
120
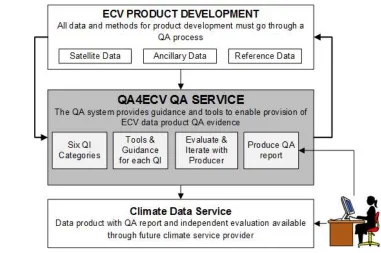
judgement on the fitness-for-purpose of various ECV CDRs for their specific applications. Figure 1
121
outlines the QA system framework. Essentially, all the data and methodologies used to derive these
122
data products (i.e. satellite, ancillary (climate/elevation models etc) and reference (in situ or model
123
data used to calibrate and validate the algorithms)), should go through a quality checking process
124
before being made available for climate data usage. The QA service components are highlighted in
125
the grey box and will be described in more detail throughout the following sections. The utility of
126
this QA system is demonstrated on the six QA4ECV data products: Albedo, Leaf Area Index (LAI),
127
Fraction of Absorbed Photosynthetically Active Radiation (FAPAR), Nitrogen Dioxide (NO2),
128
Formaldehyde (HCHO) and Carbon Monoxide (CO), which are described in Section 4.
129
130
131
132
133
134
136
137
138
139
140
141
142
143
144
145
Figure 1. The QA4ECV Quality Assurance (QA) System Framework Overview. The system
146
comprises a set of six Quality Indicator categories to extract meaningful quality information
147
about the data product that users should take into account when applying the data for climate
148
applications.
149
150
3.1 QA System Development
151
The QA4ECV QA system has been developed over a 4 year period and is described in detail
152
within the Service Specification Document [7]. Initial requirements were scoped within a User
153
Requirements activity that employed a survey to gauge the current state of and need for quality
154
assurance in satellite-derived data products [8]. The QA4ECV QA system framework aligns with
155
IPCC guidelines [9] and builds upon other relevant and successful EU projects that consider EO data
156
quality and provenance issues, for example CHARMe (http://charme.org.uk/) and CORE-CLIMAX
157
(http://www.coreclimax.eu/) as well as international coordination bodies including the CEOS
158
Working Group on Calibration and Validation (WGCV), the joint CEOS-CGMS Working Group on
159
Climate, and GCOS (Global Climate Observing System), among others. In order to ensure content is
160
current and captures relevant findings and user endorsed methods from other initiatives a review of
161
12 projects and initiatives dedicated to improving the quality of satellite derived data streams was
162
conducted [10]. The QA4ECV system collates the following types of Quality Indicators (QIs)
163
associated with EO derived ECV products: Product Details; Algorithm Traceability; Quality Flags;
164
Validation; Uncertainties; and Assessment against Standards.
165
3.1.1 Product Details
166
Product details summarizes the basic meta-information about the product including for example:
167
product DOI, spatial resolution, temporal resolution, spatial coverage, temporal coverage, in situ /
168
reference datasets, satellite and/or airborne datasets used. Documentation which describes the data
169
product including the Algorithm Theoretical Basis Document (ATBD) and Product User Manual
170
(PUM)/Product User Guide (PUG)/Product Specification Document (PSD) are also captured here.
171
3.1.2 Algorithm Traceability Chain
175
A QA4ECV traceability chain is a diagrammatic and partly interactive representation of the
176
processing steps taken to produce the final data product. It shows sub-processing chains and
177
intermediate products/parameters as well as provides a short description of each step and where to
178
find more detail on the process implemented. The traceability chain aids a user in understanding the
179
data production and the assumptions that are made during implementation. It also helps producers
180
identify and understand potential sources of discrepancies between two similar data products
181
produced by different methods or algorithms. Traceability chains for the 6 QA4ECV demonstrator
182
products are shown in section 4 and interactive versions can be found at: http://www.qa4ecv.eu/ecvs/.
183
3.1.3 Quality Flags
184
Quality Flags (QFs) are provided as a product data layer and indicate quality information about
185
the product at ground pixel level. There are currently no standards specifying if and what QF’s
186
should be provided with a product and therefore the content can vary in complexity and detail of
187
information for different data products. Commonly implemented flags have been recommended in
188
the QA system to provide information such as: number of observations used in the calculation;
189
snow/cloud cover; back-up algorithm implementation; fill-values utilized; and pixel-based
190
uncertainty estimates etc.
191
3.1.4 Validation and Inter-comparison
192
Validation is the process of assessing by independent means the quality of the data products
193
derived from the system outputs [11]. The content of the validation section is dependent on the ECV
194
domain chosen however all data producers are asked to provide the validation report(s), comparisons
195
with independent reference data and comparisons with other satellite derived ECV datasets (i.e.
196
inter-comparisons). Given the ambiguity associated with determining if a global data product is
197
“validated”, a hierarchical approach to classify validation stages was adopted by CEOS through
198
consensus of the Land Product Validation (LPV) community [12]. While for the atmospheric domain
199
the data producer is asked to provide information about the validation protocol steps which the
200
product has been subjected to, i.e. those developed in the context of CEOS initiatives and ESA projects
201
[17,18] and tailored to QA4ECV in the Prototype QA/Validation Service for Atmospheric ECV
202
Precursors - Detailed Processing Model [13]. Building on this prototype, the QA4ECV Atmosphere
203
ECV Validation Server, available online at https://qa4ecv-dev.stcorp.nl, was implemented to validate
204
all QA4ECV atmospheric ECV datasets, and transferred recently to the Sentinel-5p Mission
205
Performance Centre for the operational validation service for TROPOMI atmospheric data products
206
(see http://www.tropomi.eu).
207
3.1.5 Uncertainties
208
The QA system captures details about the uncertainty information and derivation of the
209
uncertainty estimates associated with the ECV data products. This includes information on how the
210
uncertainties from each dataset have been included into the final uncertainty estimate and how
211
uncertainties introduced at each stage of the processing have been accounted for. The concept of
212
metrological traceability with EO data and products is a multi-faceted problem that, although is being
213
tackled with greater detail in dedicated projects such as FIDUCEO (www.fiduceo.eu) and others,
214
requires considerable further research
215
3.1.6 Assessment against Standards
216
This QI of the QA System seeks to determine the fitness-for-purpose of the data product for
217
various applications, including climate based applications, and the degree of how well the data
218
producers follow good practises, e.g., for uncertainty estimation and validation in generating the data
219
products. Two key standards are addressed including the GCOS ECV product requirements for
220
222
GCOS – The ECV product target numerical requirements for climate applications can be found
223
within GCOS-200 [3]. The requirements specify the physical quantities (products) as well as the
224
frequency, resolution, uncertainty and stability necessary to meeting climate monitoring needs.
225
226
System Maturity Matrix (SMM) – The maturity model for assessing the completeness of CDR
227
production systems developed within the CLIMAX project has been applied [14]. The
CORE-228
CLIMAX maturity model is an adaptation of Bates et al. (2012) [15], which was revised to be more
229
generic so that it can be applied not only for satellite data sets, but for all CDRs (in situ, combined
230
satellite and in situ, and reanalyses). The aim of adopting the SMM in QA4ECV (described at [14]) is
231
to evaluate the production process of the ECV CDRs to ensure they follow best practices for science,
232
engineering and utilization; it is not to assess the quality of the data itself. The results of this exercise
233
help the data user to build confidence into data producers that systematically apply best practises. In
234
addition, the maturity scores help to determine the strengths and weaknesses in the data record
235
generation process. This information is useful for data record producers and agencies responsible for
236
such data products to steer activities to mitigate weaknesses in the process, e.g., insufficient
237
validation activities. This should indeed lead to improved data quality.
238
3.2 QA System Process
239
In order for the QA4ECV QA system to be successful and widely adopted, it must be simple and
240
intuitive, offer a wide range of tools and resources relevant to multiple EO disciplines, be
241
documented appropriately, and ensure the evaluation process is streamlined and follows a
user-242
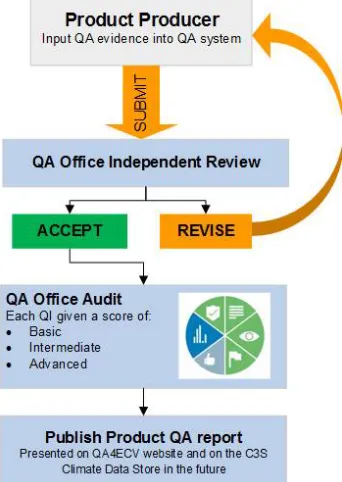
friendly ‘checklist’ type strategy. Figure 2 outlines the process of the QA4ECV QA system, the specific
243
detail of each component is discussed below. To effectively develop, implement and operate the
244
system, the organizational structure and the skill sets of specific persons involved must be defined
245
for a suite of tasks. This section outlines the requirements for the QA evaluation organization that
246
should implement the QA4ECV framework, as well as the responsibilities of the ECV CDR
247
developing organization.
248
249
250
251
252
253
254
255
256
257
258
259
260
261
262
263
264
265
266
267
Figure 2: Overview of the QA4ECV QA system process including role of product producers and
268
the QA administration. Within the QA4ECV project the QA administration refers to domain
269
experts for land products (NPL) and atmosphere products (BIRA-IASB). The revision loop
270
provides product producers the opportunity to improve their QA evidence for each category to
271
3.2.1 A Dedicated QA Administration
273
A dedicated QA administration provides the backbone for the operation of the QA system. The
274
office is responsible for a range of tasks including: preparing QA evaluation criteria; ensuring the
275
tools, information, templates and training modules provided within the QA system are current and
276
state of the art, and do comply with higher level requirements or recommendations; offering
277
guidance and support for use of the QA system; conducting the independent evaluation (“audit”) by
278
at least 2 domain expert evaluation officers; providing evaluation feedback to the product producer
279
in an iterative process; and awarding endorsement for QA compliance. Noting that this type of QA
280
system and evaluation activity is ‘new territory’ for the EO community, the framework set out within
281
this document has been designed to allow ‘levels of QA compliance’, which will be key in
282
encouraging ECV developers to continually improve their product QA evidence through time as the
283
algorithm and evaluation work matures, to aid data users understanding of the products. For the
284
purpose of the prototype QA system, land and atmosphere measurement experts from the National
285
Physical Laboratory (NPL) UK and Royal Belgian Institute for Space Aeronomy (BIRA-IASB)
286
performed the role of administrators and product evaluators.
287
3.2.2 Product Producers
288
The data product producers are responsible for completing all of the required information
289
within each of the Quality Indicators. This includes uploading references and documentation,
290
providing justification for processes and statements made concerning the development and
291
validation of the data product and being responsive to constructive analysis and recommendations
292
for improvement provided by the QA office assessor. This is because the product producer knows
293
their product best. The ECV product producer is consulted through the evaluation process and
294
producer consent must be gained before a QA evaluation report is made publically available. ECV
295
Product Producers need to be well-motivated to complete the QA report, i.e., they need to understand
296
that systematic assessment of product quality and processes to generate them is advantageous for
297
further evolution of the data products. It needs to be clear to them that the whole process, including
298
multiple interaction and feedback, takes approximately 2-4 hours to complete.
299
3.2 Training and Guidance
300
The training developed to accompany the QA system consists of guidance to support product
301
developers in navigating and completing the required fields of quality information. A ~3 minute
302
video provides a visual overview of the QA system categories. A short 5 page quick start guide is
303
provided to accompany the video. While a detailed QA System User manual has been produced [16].
304
This documentation as well as the video can be found on the QA4ECV website at:
305
http://www.qa4ecv.eu/qa-system/training. Further, face-to-face and web conferencing training
306
sessions have been run by NPL and BIRA-IASB to demonstrate functionality and use of the QA
307
system.
308
3.3 QA Evaluation (“Auditing”) Process
309
This section describes a formalized process undertaken by the QA office to ensure effective and
310
traceable implementation of the QA4ECV framework. This includes consideration of the level of
311
compliance to be achieved, the process for undertaking each stage of compliance demonstration and
312
how the framework is driven by continual improvement. An overview of the process is given in
313
Figure 2. The QA4ECV Service uses the term “audit” (Systematic, independent and document process
314
for obtaining objective evidence and evaluating it objectively to determine the extent to which the
315
audit criteria are fulfilled: ISO9001:2015 [17]).
316
317
The aim of checking quality records is to ensure the consistency of information between ECV
318
datasets. Once the ECV data product producer has completed the QA system QI categories to the best
319
process for checking records is demonstrated in Figure 2. A quality evaluation checklist has been
321
derived which contains three levels of increasing compliance (amount of detail/justification
322
provided), for each Quality Indicator. The three levels include:
323
324
Basic – Some information is provided on the quality of the product to allow the users to make
325
a simple distinction between the product and others. (Light grey).
326
Intermediate – Detailed information is provided on the product, allowing the user to
327
understand how it was made and the quality and uncertainty information available to
328
them. (Blue).
329
Advanced – Significant detailed information is provided on the product, providing the user
330
with enough information to make an informed decision about how the product should be
331
used. (Green).
332
333
Further, the QA system generates a QA label which will be applied to a dataset. This label
334
provides a quick visual overview of the quality ranking a product has achieved for each QI (basic –
335
light grey; intermediate – blue; advanced – green). The label is based on the GEO Label utilized by
336
GEOSS in their datasets (http://www.geolabel.info/).
337
338
The QA evaluation/audit should be undertaken by at least two independent product experts and
339
consolidated by an impartial QA officer to ensure a fair and robust assessment. Once the QA
340
assessment has been completed, the product producer is invited to review the audit. This provides
341
them with the chance to improve, update or provide further justification for their answers. When
342
both parties are in agreement with the evaluation, the final product Quality Summary Report will be
343
made publically available. The QA summary reports are generated for two main purposes: 1) to allow
344
the data producers to gauge how well they are achieving standardized quality assessment criteria,
345
and where they may need to focus their efforts; and 2) for data product users to use the reports and
346
identify suitable datasets for their requirements and/or discover information about the existing
347
datasets they use to improve knowledge and value of applications. For detailed information on the
348
QA Evaluation process see [7]. Development of QA summary reports for multiple data products will
349
also have the added benefit of signaling key research gaps for future funding efforts.
350
351
4. Six New ECV Climate Data Records
352
The second key objective of the QA4ECV project was to generate multi-decadal CDRs for
353
atmospheric and terrestrial ECVs that are based on inter-satellite calibrated data, state of the art
354
retrievals and are fully traceable with uncertainty metrics. Each CDR is described below and the static
355
top level traceability chain is shown. The traceability chain key is shown in Figure 3. Dynamic
356
versions of these traceability chains along with access to the 8 data products produced within the
357
QA4ECV project are available at http://www.qa4ecv.eu/.
358
359
360
361
362
363
364
Figure 3: Traceability Chain Key.
365
4.1 Broadband Albedo
371
The QA4ECV Broadband Albedo product is based on processing a 35 year (1982-2016) daily time
372
series of 0.05º polar orbiting NOAA-AVHRR (Advanced Very High Resolution Radiometer ) and
re-373
projected geostationary (METEOSAT, GOES, GMS) level-2 surface Visible and Near Infrared (NIR)
374
Bidirectional Reflectance Factors (BRFs) into top-of-canopy bi-directional reflectance distribution
375
functions (BRDFs) and thence integrating these into surface albedo. The daily polar orbiting (BRFs)
376
were generated within the AVHRR Long Term Data Record (LTDR) V5 developed by [18]. The
377
geostationary BRFs were generated using the standard SCOPE-CM processing scheme [19]. The
378
processing used to retrieve BRDF uses the ESA GlobAlbedo processing chain which employs optimal
379
estimation [20] to generate daily 0.05º (≈5 x 5 km) products over the 35-year time period. In addition,
380
as part of the QA4ECV processing chain automated machine learning based methods were developed
381
and rigorously tested to screen out clouds, flag snow and sea-ice over shallow water and water bodies
382
in order to focus on land only snow free and snow filled pixels. The AVHRR BRFs from channels 1
383
and 2 were converted to 3 broadbands: VIS (0.4-0.7µm), NIR (0.7-3µm) and SW (0.4-3µm). The GEO
384
(Geostationary satellite) BRFs were converted to SW (shortwave, 0.4-3µm) as only the panchromatic
385
bands were used which straddle the red edge at 0.7µm. For each annual set of BRDF/albedo retrievals,
386
eighteen months of input LEO (Low Earth Orbit satellites) BRF (derived from AVHRR from 7
387
different NOAA spacecraft) were employed for each daily product within the central 12 months. For
388
the area within ±60º latitude, GEO top of atmosphere data were processed by EUMETSAT to SW-BRF
389
and these were included in the joint retrieval [21]. A background dataset consisting of broadband
390
daily climatology in the 3 wavelength regions derived from 16 years of MODIS BRDF was employed
391
to ensure that there were no gaps when there was persistent cloud cover or during polar night. From
392
these daily products, using energy conservation for upscaling, 0.5º daily and monthly products were
393
produced. For each and every pixel an estimate of the uncertainty produced using the processes
394
shown within the traceability chain was generated. These pixel-level uncertainties consisted of
395
standard errors called “sigma” and a cross-product covariance term called “alpha” between the VIS
396
and NIR channels which were subsequently employed for the TIP processing (see section 4.4). Output
397
products also include quality measurements such as a weighted number of samples and a relative
398
entropy related to the influence of the MODIS prior in addition to snow and water body flags. It was
399
decided to remove the sea-ice from this product as there is a separate sea-ice product (see below).
400
This QA4ECV broadband albedo product is the first ever fused product from GEO+LEO and the
401
longest time series ever produced of the Earth’s land surface albedo. It has been extensively tested by
402
our collaborators at the Ludwig Maximilian University of Munich for fitness for purpose in climate
403
models (papers in preparation). The QA4ECV Broadband Albedo Product top level traceability chain
404
is shown in figure 4.
405
406
407
408
409
410
411
Figure 4: QA4ECV Broadband Albedo Product top level Traceability Chain.
412
413
4.2 Spectral Albedo
415
In the ESA GlobAlbedo project (www.GlobAlbedo.org), surface spectral BRFs were calculated
416
from MERIS and VEGETATION sensors. These spectral BRFs were then converted into visible, NIR
417
and shortwave broadbands using narrow-to-broadband coefficients calculated at Freie Universität
418
Berlin (http://www.globalbedo.org/docs/GlobAlbedo_Albedo_ATBD_V4.12.pdf). In QA4ECV, we
419
extended the time series of MODIS spectral albedos (specifically daily MCD43C at 0.05º) back in time
420
using VEGETATION as the primary sensor. This process started by generating a set of spectral
421
coefficients which allowed VEGETATION spectral BRFs to be converted into their equivalent for
422
MODIS. This was performed by matching-up millions of MODIS spectral BRFs from MOD09 with
423
the closest possible matchups in view and solar angles from MERIS and VEGETATION spectral band
424
BRFs to determine the sensor-to-MODIS spectral band mapping. For VEGETATION with a 1.6µm
425
band, this mapping works very well for the first 6 spectral bands of MODIS but it does not function
426
correctly for MODIS band 7 (≈2.13µm). This matchup also works surprisingly well for all the MERIS
427
bands even though there are no bands above 1µm. The GlobAlbedo processing chain was modified
428
to process all the input VEGETATION only for 1998-2000 daily data and to test this for future use
429
with Sentinel-3 we also tested this for 2005 with MERIS+VEGETATION as we employed in
430
GlobAlbedo. We then compared these synthesized MODIS spectral albedos with the actual MODIS
431
albedos and found extremely high correlations. A spectral version of the aforementioned MODIS
432
BRDF climatology was employed in the optimal estimation retrieval scheme. The same technique
433
could also be applied to generate a long time series of MERIS-like or OLCI-like spectral channels
434
going back to 1998. Uncertainties were calculated per band and not between bands as this was too
435
computationally challenging. Only data for 16 tiles over Europe were processed for the same reason.
436
The QA4ECV Spectral Albedo Product top level traceability chain is shown in figure 5.
437
438
439
440
441
442
443
Figure 5: QA4ECV Spectral Albedo Product top level Traceability Chain.
444
4.3. Sea-Ice Albedo
445
Sea-ice albedo is a key climate change indicator as there is strong feedback between sea-ice
446
albedo and direct radiative forcing. Up until now, models have been employed for sea-ice albedo
447
retrieval using instruments such as AVHRR [22] for shortwave only and at low resolution (25km) on
448
weekly time-steps. Sea-ice packs many kilometres in size move at up to 15km/day so any method
449
such as time -composting smears out each individual albedo record rendering it unfit for retrieval of
450
sea-ice albedo. What was needed was an instantaneous measurement of spectral BRF to allow an
451
instantaneous retrieval of spectral albedo. The NASA MISR instrument is the only such instrument
452
in orbit which records information at sufficiently high spatial resolution (1.1km in all 4 spectral bands
453
of blue, green, red and NIR) albeit with a narrow 380km swath. Surface spectral BRFs were specially
454
processed at NASA Langley over the Arctic and Antarctic regions from ±60º of latitude to the
455
northernmost point at 83º due to the inclination of the NASA Terra orbit. The cloud mask derived
456
from MISR is not yet sufficiently robust to be able to differentiate cloud from sea-ice so a separate
457
(https://nsidc.org/sites/nsidc.org/files/files/modis-sea-ice-user-guide-C6%5B1%5D.pdf) was
459
employed to mask out the clouds and sea-only areas from the MISR derived BRF and albedos. This
460
land surface BRF and MISR albedo product is described in [23] and the special product is described
461
in Kharbouche & Muller (in review). The 1km, 5km and 25km product is processed every orbit, and
462
then integrated over ±24 hours, ±3, ±7days and monthly on a daily time-step. Although each retrieved
463
spectral BRF and albedo has an uncertainty, this is not employed to generate the global product.
464
Instead for the time-composited products, a standard deviation of albedo is employed. This product
465
has been used to generate a 16 year time series (2000-2016) for April-to-September each year when
466
the solar zenith angle ≤70º (loc.cit.). This time series has been validated using data from a
tower-467
mounted albedometer when converted to shortwave BHR (Bi-Hemispherical diffuse Reflectance, aka
468
BHR sometimes called “white sky” albedo) as well as data from the NASA CAR (Cloud Absorption
469
Radiometer) instrument using the methods described in [24]. There is huge interest in this product
470
across the climate-cryosphere community. The QA4ECV Sea-Ice Albedo Product top level traceability
471
chain is shown in figure 6.
472
473
474
475
476
477
478
Figure 6: QA4ECV Sea-Ice Albedo Product top level Traceability Chain.
479
4.4 TIP LAI / FAPAR
480
Leaf Area Index (LAI) and Fraction of Absorbed Photosynthetically Active Radiation (FAPAR)
481
ECVs along with their per pixel uncertainty were consistently retrieved using the Two Stream
482
Inversion Package (TIP) [25, 26] applied to visible (VIS) and near infrared (NIR) Broadband Albedos
483
from the QA4ECV project. The TIP is the inversion of the Two-stream Model developed by [27],
484
which implements the two-stream approximation of radiative transfer for a homogeneous canopy
485
(“1D-canopy”). The 1D radiative transfer model is potentially consistent with large-scale climate and
486
Earth system models and does not require assumptions about other factors (e.g. biome type) to be
487
made. Owing to the 1-D approach, TIP-LAI is an effective quantity, describing the optical effects of
488
the leaves. The implementation used in QA4ECV (TIP5D) uses the full variance-covariance matrix of
489
the BHRs, which is an enhancement beyond previous applications of the TIP [28],[29], [30], while
490
maintaining reproducibility of the results.
491
In QA4ECV, TIP LAI and FAPAR were produced globally for 0.5 degree and 0.05 degree regular
492
grids, for each day of 1982 to 2016. Full per pixel processing information and extra quality information
493
is available through the provided retrieval flags. This product is best suited for use in soft constraint
494
data assimilation into dynamical models which use a similar radiative transfer scheme, yielding
495
maximum gain from the consistency of LAI, FAPAR and the albedos and their uncertainties (e.g.
496
[31]). As the uncertainties can be quite large, they should always be taken into account. Depending
497
on the application it may be advisable to mask out some data according to the retrieval flag (see
498
Product User Guide for details, http://www.qa4ecv-land.eu/document.php), for instance, trend
499
analysis should not use data which were filled with the albedo prior (most notably in late 1994, where
500
no AVHRR-data is available). However, version 1.0.1 suffers from artifacts introduced by problems
501
(http://www.qa4ecv.eu/sites/default/files/D5.4_v1.0.pdf). The QA4ECV Spectral Albedo Product top
503
level traceability chain is shown in figure 5. The QA4ECV TIP LAI/FAPAR Product top level
504
traceability chain is shown in figure 7.
505
506
507
508
509
510
511
512
513
514
515
516
517
518
519
520
521
522
523
Figure 7: QA4ECV TIP LAI/FAPAR Product top level Traceability Chain.
524
4.5 AVHRR FAPAR
525
Joint Research Centre (JRC) methodology was used to compute daily Fraction of Absorbed
526
Photosynthetically Active Radiation (FAPAR) from daily spectral measurements acquired by
527
Advanced Very High Resolution Radiometer (AVHRR) onboard a series of National Oceanic and
528
Atmospheric Administration (NOAA) platforms, namely 07, 09, 11, 14 and 16. The methodology itself
529
is based on previous JRC-FAPAR algorithms such as the ones developed for the Medium Resolution
530
Instrument Sensor (MERIS) and the Ocean Land Colour Instrument (OLCI) [32, 33], except surface
531
reflectances in Band 1 and Band 2 instead of top of atmosphere ones were used as inputs data [18].
532
The retrieval method assumes that the leaves are alive and photosynthesizing, hence the `green’
533
FAPAR is assumed. Also contrary to the TIP FAPAR (previous paragraph), the values correspond to
534
instantaneous definition, i.e. under direct illumination. The QA4ECV products span from 1982 to
535
2006 at 0.05°x0.05°. In addition to daily products, 10-day and monthly products were provided as
536
well as over coarser resolution for biosphere changes studies (e.g. 0.5°x0.5°). The products contain
537
several uncertainty metrics such as error propagation derived from inputs uncertainties and both
538
temporal and spatial standard deviation for regridded products. These products are unique as they
539
are the only ones containing three types of uncertainties and can be used together with SeaWiFS,
540
MERIS and Sentinel-3 FAPAR products using the same retrieval algorithm and definition. However,
541
despite the recent calibration and atmospheric correction performances made by [18], the products
542
still contain, at the end of few NOAA satellites, some artifacts that must be corrected for global
543
changes studies [34]. This will be done on the new version. The QA4ECV AVHRR FAPAR Product
544
top level traceability chain is shown in figure 8.
545
550
Figure 8: QA4ECV AVHRR FAPAR Product top level Traceability Chain.
551
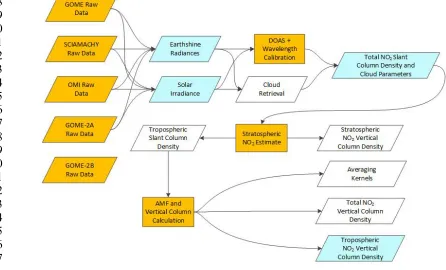
4.6 NO2
552
The QA4ECV NO₂ ECV precursor product contains harmonized vertical NO₂ columns from the
553
ERS-2 GOME, Envisat SCIAMACHY, Aura OMI, and MetOp-A GOME-2(A) sensors. The main
554
product is the tropospheric vertical column density. The data sets covers the period July 1995 –
555
December 2017, a 22+ year record. The spatial resolution varies from 320 × 40 km2 (GOME) to 13 × 24
556
km2 (OMI in nadir), with mid-morning (10:00 hrs local time) overpasses for GOME, SCIAMACHY,
557
and GOME-2, and early afternoon (13:40 hrs local time) for OMI. Global coverage is achieved every
558
1-6 days, depending on the instrument field-of-view and measurement conditions (e.g. presence of
559
clouds, snow, ice). The QA4ECV NO2 ECV precursor product contains detailed information on
560
retrieval uncertainty (from uncertainty propagation calculations embedded in the retrieval
561
algorithm) and quality flags. The main uncertainty metric is the uncertainty in the tropospheric NO2
562
column, but the data set also includes a breakdown of the individual contributions to the overall
563
uncertainty budget (i.e. from detector noise, fitting techniques, radiative transfer calculations, and
564
assumptions made on ancillary data). A full description of the retrieval approach, uncertainty
565
analysis and auxiliary data, and some preliminary validation is provided in [35]. The data product
566
has been registered using unique DOIs for the 4 sensor sub-sets, e.g. as in [36]. What is unique about
567
the QA4ECV NO2 data record is that it is the first cross-calibrated, multi-sensor dataset, with very
568
detailed quality information embedded, and that is spans a period of more than 20 years.
569
Tropospheric NO2 columns are being used widely especially for estimating NOx emissions (e.g. [37]),
570
for improving the estimates and attribution of ozone and aerosols (e.g. [38, 39]), for trend analyses
571
(e.g. [40]), and for reanalysis studies (e.g. [41]). Users are advised to use the tropospheric NO2
572
columns by taking into account detailed information on measurement flags, spatio-temporal
573
representativeness and vertical sensitivity. For more detail on this and practical recommendations on
574
how to use the data, we refer to [42]. The QA4ECV NO2 Product top level traceability chain is shown
575
in figure 9.
576
588
589
590
591
592
593
594
595
596
597
598
599
600
601
602
603
604
605
606
607
Figure 9: QA4ECV NO2 Product top level Traceability Chain.
608
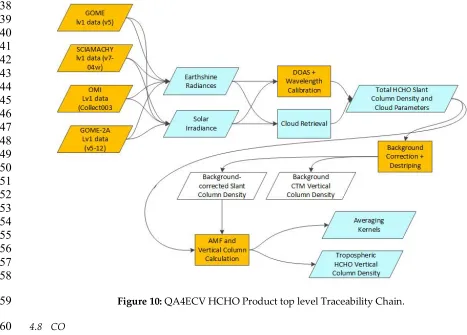
4.7 HCHO
609
The QA4ECV HCHO ECV precursor product contains harmonized HCHO tropospheric vertical
610
column densities for the period 1996-2016. The HCHO ECV data provides geophysical information
611
for every ground pixel observed by each satellite sensor (GOME, SCIAMACHY, OMI, and
GOME-612
2A). Global Earth coverage is achieved within 1 to 6 days, depending on the sensor and on the
613
observation conditions. In addition to the vertical HCHO column densities, the product contains
614
intermediate results for every ground pixel, such as the result of the spectral fit, fitting diagnostics,
615
the averaging kernel, cloud information, uncertainty estimates detailed for each retrieval step, and
616
quality flags. A full description of the retrieval algorithm, uncertainty analysis and auxiliary data is
617
provided in [43]. Satellite HCHO observations are widely used to gain knowledge on NMVOC
618
emissions, tropospheric ozone formation and biogenic aerosols [44]. Uncertainties in satellite HCHO
619
observations are dominated by their random component. Users are therefore advised to average the
620
data in space and/or in time, in order to reduce this contribution. The QA4ECV algorithm is now
621
being transferred to the TROPOMI sensor, offering a significantly improved signal to noise ratio and
622
extending the 20-years QA4ECV HCHO dataset. The QA4ECV HCHO Product top level traceability
623
chain is shown in figure 10.
624
638
639
640
641
642
643
644
645
646
647
648
649
650
651
652
653
654
655
656
657
658
Figure 10: QA4ECV HCHO Product top level Traceability Chain.
659
4.8 CO
660
The QA4ECV CO ECV precursor product consists of a 10-year archive of CO total columns from
661
the IASI sensor (2008-2017). The columns are calculated from the CO profiles, retrieved from IASI
662
day and night Level 1C radiances with the FORLI software (v20100815+v20140922), on 19 vertical
663
layers in the troposphere. The columns are provided with error estimates and quality flags at the
664
native IASI resolution, i.e. for individual elliptical pixels with sizes ranging from IASI 12 km by 12
665
km at nadir to 20 km by 39 km at the largest angles. IASI provides bi-daily coverage of the Earth,
666
with overpass times around 9:30 in the morning and 21:30 in the evening. Generally, the sensitivity
667
to the boundary layer is better for the daytime observations, as documented in [45] and the varying
668
sensitivity should therefore be carefully accounted for when analyzing the time series in the columns.
669
A general description of the retrieval software is provided in [46] and an algorithm technical basis
670
document has been generated in the context of the EUMETSAT Satellite Application Facility
671
(https://acsaf.org/products/iasi_co.html). A product description, with first analyses and consistency
672
check with the MOPITT data record is provided in [47]. The QA4ECV data record is available from
673
the French Atmosphere Infrastructure AERIS. It should be mentioned that there are remaining non
674
homogeneities in the time series, which have been traced back to changes in meteorological input
675
parameters. The data record from IASI-A is being extended since 2012 with IASI-B and there is no
676
bias between the two missions; IASI-C will continue the record from 2018. The IASI CO product is
677
supporting NRT applications (operational dissemination via EUMETCast and assimilation in
678
CAMS), emission inventories and tropospheric chemistry models [48]. The QA4ECV CO Product top
679
level traceability chain is shown in figure 11.
680
681
682
683
Figure 11: QA4ECV CO Product top level Traceability Chain.
684
5. QA4ECV Product Quality Reports
686
687
The Summary QA4ECV Product QA reports are hosted on a public-facing area of the QA
688
System. Log-in information is not required for general users to view the completed product QA
689
reports. At the time of product evaluation the QA4ECV products were still under development and
690
not scheduled for completion until the end of the project (early 2018). Therefore, key quality
691
indicators such as validation and product inter-comparison studies have not been conducted and
692
therefore evaluation of this QI could not be done. The maturity matrix assessment has been repeated
693
at the end of the project and resulted in some distinct improvements for individual data records, in
694
particular for increased completeness of validation activities and documentation. The QA evaluations
695
for each of the 8 QA4ECV products are shown below. Each product had achieved varying levels of
696
quality based on the defined criteria [7] (note Grey = Basic; Blue = Intermediate and Green = Advanced
697
Quality Information). This process highlights the need for an iterative and flexible QA evaluation
698
approach which gets vital product QA information to the user community but allows the product
699
producer to improve the QA as further research is conducted.
700
701
Broadband Albedo
The QA4ECV AVHRR + GEO Broadband Albedo product produced by UCL (MSSL and Geography) and Brockmann Consult has achieved an Advanced status for the Product details, Traceability chain and Assessment against Standards; Intermediate status for Quality Flags; and Basic status for uncertainty assessment and validation.
702
Spectral Albedo
The QA4ECV Spectral Albedo product produced by UCL (MSSL and Geography) and Brockmann Consult has achieved an Advanced status for the Product details and Traceability chain; Intermediate status for Assessment against Standards; and Basic status for Quality Flags, uncertainty assessment and validation.
703
Sea-Ice Albedo
The QA4ECV Sea-Ice Albedo product produced by UCL (MSSL and Geography) and Brockmann Consult has achieved an Advanced status for the Traceability chain and Assessment against Standards; Intermediate status for Product details; and Basic status for Quality Flags, uncertainty assessment and validation.
704
TIP LAI/FAPAR
The QA4ECV fAPAR / LAI product produced by FastOpt has achieved an Advanced status for the information provided for Product details, Traceability, Quality Flags and Assessment against Standards; Intermediate status for uncertainty assessment; and Basic status for validation.
AVHRR FAPAR
The QA4ECV AVHRR FAPAR product produced by JRC has achieved an Advanced status for the Traceability chain; Intermediate status for information provided for Product details, Quality Flags and Assessment against Standards; and Basic status for uncertainty assessment and validation.
706
NO2
The QA4ECV NO2 ECV precursor product has achieved Advanced status for the information provided for Product details, Traceability, Quality Flags and Assessment against Standards; Intermediate status for uncertainty assessment; and Basic status for validation.
707
HCHO
The QA4ECV HCHO ECV precursor product has achieved Advanced status for the information provided for Product details, Traceability, Quality Flags and Assessment against Standards; Intermediate status for uncertainty assessment; and Basic status for validation.
708
CO
The IASI FORLI CO product (version 20140922 and version 20100815) has achieved Advanced status for the information provided for Traceability and Quality Flags, Intermediate status for Product Details for and Basic status for uncertainty assessment; validation and Assessment against Standards.
709
6. Conclusions
710
Here we present the service specification for a prototype, pre-operational Quality Assurance
711
(QA) System for ECV data records and services, based on the experiences within the FP7-QA4ECV
712
project. The QA system is designed to translate the complex information about data products that is
713
contained in ATBDs (Algorithm Theoretical Basis Documents), PUGs (Product User Guides), product
714
producers heads, and other documents into a standard format based on a simple set of questions for
715
each Quality Indicator. Standardization of this information between data products enables fair
716
comparison of data products and facilitates guidance on best use of the data products for climate
717
applications. It also helps identify gaps in current knowledge to drive forward scientific advancement
718
and good practice.
719
720
Feedback on the operational utility of the prototype QA4ECV QA system was sourced from: 1)
721
the QA4ECV product producers [49]; the independent QA office auditors (NPL and IASB-BIRA) [49];
722
as well as a selected number of product “champion” users that were identified during the project
723
[50].The QA4ECV product producers agreed that the QA system is streamlined and relatively easy
724
to use, and likewise, champion users were positive concerning the product QA report content,
725
traceability chains and accessibility of this standardized information. However, reviewing the quality
726
information provided by the product producers within the QA System revealed several
727
improvements that can be made to the system architecture, content and governance. While the
728
730
Product users requested a different report layout streamlining if information was not available,
731
provision of more detail in sections related to the quality flags, validation and data uncertainties as
732
well as more product usability case studies to be presented. Further, concern was raised about the
733
usability of the GCOS requirements and the maturity matrix information in the QA context. The
734
consideration of the quality of the data record generation process as estimated by the maturity matrix
735
seems new to data record producers and more work needs to be performed to explain the benefits.
736
The QA system architecture could be improved through a more robust software framework as well
737
as enhancing the evaluation “audit” functionality and communication exchanges between reviewer
738
and product producer. The “audit” functionality could become part of a review process that leads to
739
the release authorisation of a data record to the public. Such reviews are common practise with
740
operational data providers such as EUMETSAT and would lead to mandatory provision of
741
information to the QA system by the data record producers. Such a review process is important for
742
operational activities such as the Copernicus Climate Change Service to ensure that published data
743
products are good and mature enough to support the authoritative character of the C3S services that
744
make official statements about climate change on behalf of the EU. The system content may be
745
improved by tailoring content more specifically to each ECV domain (land, ocean, and atmosphere),
746
re-evaluating the audit categories and evaluation scheme, as well as integrating the traceability chains
747
with the algorithm uncertainty information.
748
749
The QA4ECV QA System provides a solid architecture for the concepts of QA for ECV data
750
products derived from EO satellites. The QA system was applied successfully to the six QA4ECV
751
data products. A summary Quality Report has been generated for each data product and made
752
available to data users via the QA system to aid in fitness-for-purpose assessments for different
753
application requirements. Throughout the project, product producers and external QA4ECV
754
“champion users” have provided positive and constructive feedback on the architecture, content and
755
governance of the prototype QA4ECV QA system presented. All product producer and champion
756
user feedback has been consolidated and will be taken into account for future iterations of the QA
757
system that will be applied in a revised form as part of the Evaluation and Quality Control
758
functionality of the European Copernicus Climate Change Service (C3S).
759
760
761
Supplementary Materials: The QA4ECV QA System, including training materials, as well as the QA4ECV Data
762
products are available online at http://www.qa4ecv.eu/
763
764
Author Contributions:
765
Joanne Nightingale is the main author and represents NPL who led the development of the QA4ECV QA system.
766
Folkert Boersma is the lead of the QA4ECV project and responsible for the development and description of the
767
NO2 climate data record.
768
Jan-Peter Muller is responsible for the development and description of the Surface Albedo products.
769
Steven Compernolle and Jean-Christopher Lambert brought atmospheric expertise in the development and
770
application of the QA4ECV QA System, and they led the development of the QA4ECV Atmosphere ECV
771
Validation Server.
772
Simon Blessing and Ralph Giering are responsible for the development and description of the TIP-LAI/fAPAR
773
climate data record.
774
Nadine Gobron, is responsible for the development and description of the AVHRR FAPAR climate data record.
775
Pierre Coheur and Maya George are responsible for the development and description of the CO climate data
777
record.
778
Jörg Schulz is responsible for the contribution of geostationary data to the surface albedo products and was
779
assessing QA4ECV data products using the maturity matrix.
780
Alex Wood is responsible for the software programming the QA4ECV QA system.
781
782
Funding: This research was funded by the EU FP7 Project Quality Assurance for Essential Climate Variables
783
(QA4ECV), grant no. 607405. The European Commission is further acknowledged for having supported
cross-784
fertilization meetings among FP7 (CLIP-C, ERACLIM-2, EUCLEIA, EUPORIAS, UERRA) and H2020
(GAIA-785
CLIM, FIDUCEO) climate service related projects.
786
787
Acknowledgments: Though not authors of this paper we would like to acknowledge the work of our QA4ECV
788
colleagues across 17 individual EU institutions who contributed to the development of the QA system. We
789
would also like to acknowledge the champion data users who took time to review and provide valuable feedback
790
on the QA system Quality Reports.
791
Conflicts of Interest: The authors declare no conflict of interest.
792
References
793
1. Stocker, T.F., D. Qin, G.K. Plattner, M. Tignor, S.K. Allen, J. Boschung, A. Nauels, Y. Xia, V. Bex, and
794
P.M. Midgley, IPCC Summary for Policymakers, in Climate Change 2013: The Physical Science Basis.
795
Contribution of Working Group I to the Fifth Assessment Report of the Intergovernmental Panel on Climate
796
Change2013: Cambridge, United Kingdom and New York, NY, USA.
797
2. UNFCCC, The Paris Agreement - 2015, 2017: http://unfccc.int/paris_agreement/items/9485.php p. 27.
798
3. GCOS-200, The Global Observing System for Climate: Implementation Needs, 2016: World Meteorological
799
Organisation.
800
4. Bojinski, S., M. Verstraete, T. Peterson, C. Richter, A. Simmons, and M. Zemp, The Concept of
801
Essential Climate Variables in Support of Climate Research, Applications, and Policy. American
802
Meteorological Society, 2014: p. 1431-1443,10.1175/BAMS-D-13-00047.1.
803
5. Cooke, R., A. Golub, B. Wielicki, D. Young, M. Mlynczak, and R. Baize, Using the social cost of carbon
804
to value earth observing systems. Climate Policy, 2016: p. 17,10.1080/14693062.2015.1110109.
805
6. Widlowski, J.-L., Conformity testing of satellite-derived quantitative surface variables. Environmental
806
Science and Policy, 2015. 51: p. 149-169,10.1016/j.envsci.2015.03.018.
807
7. Nightingale, J., S. Compernolle, J.-C. Lambert, F. Boersma, J.-P. Muller, T. Scanlon, S. Douglas, and N.
808
Fox, Framework for a Prototype QA Service in Support of C3S (Version 3.0), 2018, National Physical
809
Laboratory: http://www.qa4ecv.eu/.
810
8. Nightingale, J., A. De Rudder, F. Boersma, T. Scanlon, C. Farquhar, J.-P. Muller, and N. Fox, Results
811
from the QA4ECV User Requirements Survey on Quality Assurance in Satellite Data Products, C.a.O.G.
812
Earth Observation, Editor 2015, National Physical Laboratory: London, UK.
813
9. IPCC, Chapter 8: Quality Assurance and Quality Control, in IPCC Good Practice Guidance and Uncertainty
814
Management in National Greenhouse Gas Inventories2001: Montreal, Canada.
815
10. Scanlon, T., S. Douglas, J. Nightingale, S. Compernolle, and J.-C. Lambert, Linkages between the QA
816
Service of QA4ECV and Other Projects and Initiatives, 2017, National Physical Laboratory:
817
http://www.qa4ecv.eu/.
818
11. Justice, C., A. Belward, J. Morisette, P. Lewis, J. Privette, and F. Baret, Developments in the validation
819
of satellite sensor products for the study of the land surface. Internationa Journal of Remote Sensing,
820
2000. 21(17): p. 3383-3390.
821
12. Nightingale, J., G. Schaepman-Strub, and J. Nickeson. Assessing Satellite Derived Land Product
822
Quality for Earth System Science Applications: Overview of the CEOS LPV Sub-Group. in
823
International Symposium on Remote Sensing of Envrionment. 2011. Sydney, Australia.
824
13. Compernolle, S., J.-C. Lambert, and S. Niemeijer, Prototype QA/Validation Service for Atmospheric ECV