Article
1
Assessing Legacy Effects of Wildfires on the Crown
2
Structure of Fire-Tolerant Eucalypt Trees Using
3
Airborne Lidar Data
4
Yogendra K. Karna1*, Trent D. Penman1, Cristina Aponte2, Lauren T. Bennett1
5
1 School of Ecosystem and Forest Sciences, The University of Melbourne, 4 Water Street, Creswick, VIC 3363,
6
Australia; [email protected] (Y.K.Karna), [email protected] (L.T.Bennett),
7
[email protected] (T. D. Penman)
8
2 School of Ecosystem and Forest Sciences, The University of Melbourne, 500 Yarra Boulevard, Richmond, VIC
9
3121, Australia; [email protected] (C. Aponte)
10
* Correspondence: [email protected]; Tel.: +61353214257
11
12
Abstract: Fire-tolerant eucalypt forests of south eastern Australia are assumed to fully recover from
13
even the most intense fires but surprisingly very few studies have quantitatively assessed that
14
recovery. Accurate assessment of horizontal and vertical attributes of tree crowns after fire is
15
essential to understand the fire’s legacy effects on tree growth and on forest structure. In this study,
16
we quantitatively assessed individual tree crowns 8.5 years after a 2009 wildfire that burnt extensive
17
areas of eucalypt forest in temperate Australia. We used airborne lidar data validated with field
18
measurements to estimate multiple metrics that quantified the cover, density, and vertical
19
distribution of individual-tree crowns in 51 plots of 0.05 ha in fire-tolerant eucalypt forest across
20
four wildfire severity types (unburnt, low, moderate, high). Significant differences in the
field-21
assessed mean height of fire scarring as a proportion of tree height, and in the proportions of trees
22
with epicormic (stem) resprouts were consistent with the gradation in fire severity. Linear
mixed-23
effects models indicated persistent effects of both moderate- and high-severity wildfire on tree
24
crown architecture. Trees at high-severity sites had significantly less crown projection area and live
25
crown width as a proportion of total crown width than those at unburnt and low-severity sites.
26
Significant differences in lidar-based metrics (crown cover, evenness, leaf area density profiles)
27
indicated that tree crowns at moderate- and high-severity sites were comparatively narrow and
28
more evenly distributed down the tree stem. These conical-shaped crowns contrasted sharply with
29
the rounded crowns of trees at unburnt and low-severity sites, and likely influenced both tree
30
productivity and the accuracy of biomass allometric equations for nearly a decade after the fire. Our
31
data provide a clear example of the utility of airborne lidar data for quantifying the impacts of
32
disturbances at the scale of individual trees. Quantified effects of contrasting fire severities on the
33
structure of resprouter tree crowns provide a strong basis for interpreting post-fire patterns in forest
34
canopies and vegetation profiles in lidar and other remotely-sensed data at larger scales.
35
Keywords: Clumping index, crown architecture, crown projection area, lidar-based crown metrics,
36
discrete-return lidar, fire severity, leaf area density, post-fire effects
37
38
1. Introduction
39
Wildfire impacts on forest ecosystems worldwide are predicted to change under fire and climate
40
regimes [1-3]. The incidence of uncontrolled large wildfires has increased in temperate regions in
41
particular, resulting in changing effects on forest structure and sustainability [4]. Emerging evidence
42
suggests that the frequency of wildfires in temperate south-eastern Australia has increased in recent
43
years [5-7]. For example, during 2003-2014, more than 4.3 million ha of eucalypt forest in the
south-44
including 350,000 ha that was burnt twice in those 11 years [7].
46
Impacts of fire at forest-stand level can range from partial consumption of surface fuels and
47
understorey vegetation (low severity) to burning of all vegetation strata including the crowns of the
48
overstorey trees i.e. high-severity fires, also known as ‘crown fires’ [8,9]. Fires of high severity, by
49
definition, impact tree crowns. Crown damage and loss associated with high-severity fires will
50
impact on tree carbon uptake, influencing stand productivity at least until the functional leaf area is
51
recovered [10]. In addition to productivity, the impacts of high-severity fires on the height and
52
architecture of tree can have practical implications [11], including the accurate estimation of canopy
53
biomass and carbon stores based on tree allometry. Tree-based allometric equations assume a
54
constant relationship of tree biomass or volume with measurable attributes like diameter and height,
55
and do not account for either short-term decreases in tree foliage and branches after fire, or more
56
persistent effects on stem or branch architecture after severe fire [12]. Fire impacts on tree crowns will
57
likely vary depending on the pre-fire architecture, the evenness of fire severity as well as the evenness
58
of resprouting in fire-tolerant crowns, leading to variable changes in both the horizontal and vertical
59
distribution of foliage and branches. Despite the many potential effects of fire on forest canopy
60
structure, recent small-scale studies in Western Australia and Tasmania [12,13], have highlighted
61
how little is known about the lasting effects of fires on eucalypt crowns. While broad-scale studies of
62
landscapes dominated by eucalypt forests indicate recovery of remotely-sensed spectral responses
63
within about six years of wildfire [14], the contribution of eucalypt crowns versus understorey to
64
these spectral data and, in particular, the time taken for fire-tolerant eucalypts to re-establish a full
65
crown after severe fire remain under-examined.
66
Understanding fire impacts on tree crown structure and recovery requires accurate assessment
67
of both horizontal (x and y dimension) and vertical (z dimension) crown attributes. Crown attributes
68
include the structure of foliage, stem, twigs and branches of the individual tree, which can be
69
characterised and assessed either directly from field-based measurements or indirectly from passive
70
or active remote sensing techniques [15] such as Lidar (‘Light Detection and Ranging’). Forest crown
71
fires can influence key attributes like crown base height, crown depth, crown width and crown
72
projection area [CPA; 16,17]. Estimating these and more-complex crown attributes (e.g. canopy
73
volume, foliage density profiles) in the field is labor intensive, time consuming and can be error prone
74
[18]. In comparison, airborne lidar data can provide estimates of canopy structural parameters i.e.
75
canopy height and canopy cover [19,20] at a range of scales from the individual tree [21,22], to the
76
plot or stand [23,24] to entire landscapes [25-27]. Discrete return small-footprint lidar has been
77
successfully used for estimating tree heights [21,28], characterising the canopy structure of several
78
forest types [29-31], measuring and mapping canopy gaps [18,32] and assessing canopy height
79
changes over time [33].
80
Various studies indicate the potential of precise estimates of horizontal and vertical canopy
81
structure using airborne lidar data with a 10- to 30-cm footprint [23,34,35], however there are few
82
studies that have used these data to assess spatial and temporal dynamics of forest canopy structure
83
and its recovery after natural disturbances [14,18,32]. Most lidar-based studies have examined the
84
dominant tree species either in northern-hemisphere boreal forests [36,37] or in rainforests [38]. In
85
addition, several studies have examined the impacts of fire severity on fire-tolerant and fire-sensitive
86
forests in the northern hemisphere specifically addressing canopy structural attributes [39-41] and
87
dynamics at landscape scales. However, while a handful of studies have used airborne lidar data to
88
describe the horizontal [42,43] and vertical structure [25,27,44] of Australian forest canopies at stand-
89
and landscape-scales, no studies to our knowledge have examined the effects of high-fire severity
90
wildfires on the individual tree crowns of temperate eucalypts, which dominate the fire-prone forests
91
of southern Australia.
92
Fire-tolerant eucalypts are assumed to fully recover from even the most intense fires through
93
epicormic (stem and crown) and/or basal resprouting [45], but surprisingly very few studies have
94
quantitatively assessed that recovery. This has implications for understanding post-fire recovery of
forest productivity, particularly because the fire-tolerant eucalypt forests of temperate Australia are
96
often assumed to be resilient stores of carbon under changing fire regimes [46]. In this paper, we
97
assess the tree-crown architecture of fire-tolerant eucalypts 7 to 8.5 years after they were burnt by
98
high-severity wildfire that started under extreme weather conditions on ‘Black Saturday’ 7 February,
99
2009 [47]. We assess individual trees in the field across replicated sites of four fire severities (unburnt,
100
low, moderate, high), and also use high-density airborne lidar data to develop tree-based metrics that
101
quantitatively describe crown architecture (e.g. cover, density, leaf area density, evenness, clumping)
102
as it is influenced by fire. Based on knowledge of fire crown scorch and epicormic recovery, and
103
including the development of unique tree-based lidar crown metrics, our specific objectives were to:
104
1) examine the persistence of changes in crown horizontal structure related to the consumption of
105
small branches; and 2) quantitatively describe changes in the crown vertical structure associated with
106
epicormic growth down the stem. Overall, we aimed to quantitatively assess any legacy effects of
107
wildfires on fire-tolerant tree crowns so that we can better understand the longevity of wildfire
108
impacts and the post-fire patterns in forest canopies and vegetation profiles at larger scales.
109
110
2. Materials and Methods
111
2.1. Study area
112
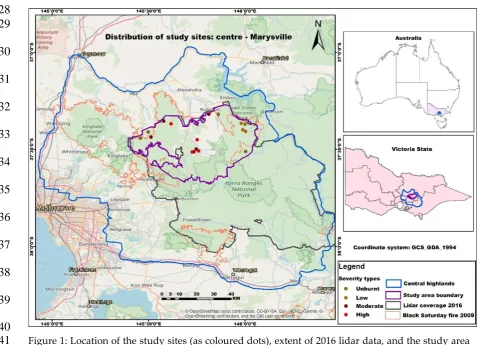
Our study area is in the Central Highlands region of south-eastern Victoria, Australia,
113
approximately 100 km north-east of Melbourne (centre the township of Marysville: 37.510 S, 145.750
114
E; Figure 1). The long-term mean annual rainfall is 1343 mm, with the majority (464 mm) falling in
115
winter (compared with 209 mm in summer). The climate of the study area is temperate with mean
116
daily minimum temperatures ranging from 8 C in July (winter) to 23 C in February (summer), and
117
mean daily maximum temperatures from 11 C (July) to 28 C [February; Marysville weather station;
118
48]. The landscapes of the study area have a variable topography and complex terrain (elevation: 352
119
- 762 m; slope: 2 - 30 ), with many of the study’s sites in remote locations. We focused on Herb-rich
120
Foothill Forest’ [49,50] which are ‘open forests’ [height of a tree 10 to 30 m and projective foliage cover
121
30 to 70%; 51]. This forest is typically dominated by a mix of ‘fire-tolerant’ eucalypt species that
122
survive wildfires through both epicormic and basal resprouting such as: Eucalyptus obliqua L'Hér
123
(messmate stringybark), E. radiata Sieber ex DC. (narrow-leaf peppermint), E. dives Schauer
(broad-124
leaved peppermint), E. viminalis Labil. (manna gum), and E. cypellocarpa L.A.S. Johnson (mountain
125
grey gum).
129
130
131
132
133
134
135
136
137
138
139
140
Figure 1: Location of the study sites (as coloured dots), extent of 2016 lidar data, and the study area
141
(defined by the overlap of the 2009-wildfire, the lidar data, and the distribution of the Herb-rich
142
Foothill Forest).
143
2.2. Study Design
144
We assessed trees at 17 field sites, which were four replicates each of four wildfire severity types
145
i.e., ‘Unburnt’ (UB), ‘Low severity’ (LS), ‘Moderate severity’ (MS), and ‘High severity’ (HS), plus an
146
additional MS site to ensure more comprehensive coverage of the study area. All sites were within or
147
around the boundaries of the Kilmore East-Murrindindi fire complex, which burnt over 400,000 ha
148
in a three-week period starting on ‘Black Saturday’, 7 February 2009 (Figure 1). Wildfire severity was
149
classified at 1:25,000 scale in 2009 by the state government environmental department using optical
150
pre- and post-fire remote sensing data, and extensive ground-truthing in the two months after the
151
wildfire [8]. Study sites were all located within Herb-rich Foothill Forest, and were carefully selected
152
to ensure they fully occurred within one fire severity type as described in DSE [8], which was verified
153
either from field data from a previous study [50], or by remote-sensing estimates of the ‘Composite
154
Burn Index’ [CBI; 52]. Selected Unburnt sites had no signs of wildfire in the 2009 assessment, had not
155
been burnt by any fire for more than 30 years prior to 2009 fire, and were as close in distance as
156
possible to the other severity sites around the wildfire boundary. ‘Low severity’ sites were burnt by
157
low-intensity surface fire as a mosaic of mostly unscorched crowns or light crown scorch (<35%,
158
severity class 4 & 5a). ‘Moderate severity’ was a mixed mosaic of crown burning and scorching
159
ranging from 30 to 65% (severity class 3); and ‘High severity’ was an intense fire that consumed the
160
entire understorey, and burnt or scorched 60–100% (severity class 1 & 2) of the canopy [8]. Our overall
161
study design including the links between field and lidar data is summarised in Supplementary Figure
162
S1.
2.3. Field assessments
165
We assessed our study sites in the field from September to November 2017. Each of our 17 sites
166
consisted of a cluster of three circular plots (12.5 m nominal radius, 0.05 ha; 51 plots in total), which
167
were located 50 m apart (centre to centre) to reduce within-site spatial correlations (Supplementary
168
Figure S2). The locations of our plot centres (as well as the within-plot location of selected trees, see
169
below), were recorded using a Trimble Geo 7x (Sunnyvale, California, United States) with post
170
corrections by the GPS provider (Ultimate Positioning Group, Melbourne, Australia) based on
171
receiver data from a base station located in Marysville [Marysville, Victoria; 53]. We left the
172
differential GPS in place at the plot centre for at least 20 minutes to maximise the potential for an
173
accurate reading [54]; for logistical reasons, this time was reduced to 2 minutes when recording the
174
location of selected trees. Given that the accuracy of a differential GPS can be reduced by continuous
175
tree cover [54], we also recorded tree locations relative to the plot centre using a TruPulse360B Laser
176
Rangefinder (Measurably Superior, Colorado, USA).
177
We selected six to eight live trees per plot for detailed characterisation, hereafter known as
178
candidate trees (total of 342; Supplementary Table S1). We divided each plot into four quadrants to
179
minimise the potential for overlap of the candidate-tree crowns, and then selected one to two live
180
trees per quadrant using the following criteria (in order of importance): 1) dominant crown position
181
(not obviously over-topped by neighbouring trees); 2) largest available diameter in that quadrant
182
(nominally >20 cm DBHOB, overbark diameter at breast height, 1.3 m); and 3) within 12.5 m of the
183
plot centre (or up to 15.8 m dependent on the closest suitable tree per quadrant). We assessed the
184
following attributes of the live trees (as illustrated in Figure 2): 1) species; 2) DBHOB; 3) top live height
185
(to highest live leaf); 4) total height (to highest live leaf or dead branch); 5) crown base height (to the
186
origin of the lowest substantial branch or fork); 6) crown width (north-south and east-west for both
187
the bulk of the live crown and the total crown if it included dead protruding branches); 7) presence
188
or absence of stem epicormic resprouts; 8) presence or absence of basal resprouts; and 9) height of
189
fire scarring as a proportion of total tree height. All tree heights were measured using a Haglöf Vertex
190
IV Ultrasonic Hypsometer (Haglöf, Sweden), and crown widths were measured with the
191
TruPulse360B Laser Rangefinder. We also photographed all candidate trees from the base (panoramic
192
and simple portrait, Samsung S8+ smart phone, Samsung Electronics, China) as a visual record for
193
checking field data and comparing with lidar data as required.
194
To assist with the interpretation of lidar data, we also measured all trees greater than 20 cm
195
DBHOB in each plot for: 1) status (live, dead); 2) DBHOB; and 3) location (relative to the plot centre,
196
using a TruPulse360B Laser Rangefinder). In addition, we measured the heights of a selection of trees
197
representing the full range of diameters (typically an additional 5 tree heights per plot).
201
202
203
204
205
206
207
208
209
210
211
212
213
214
215
216
217
218
219
220
221
222
223
224
225
226
Figure 2: Field measurements of unburnt and severely burnt trees, including tree height metrics,
227
crown-width metrics (bulk crown width of the live crown, total crown width to outermost extremities,
228
which could be dead), and the presence/absence of epicormic (stem) and basal resprouts.
229
2.4. Lidar data acquisition and processing
230
Our study used small-footprint airborne lidar datasets acquired from 09 January to 06 August
231
2016 (about one to two years before field data were collected), which encompassed our 17 field sites
232
(Figure 1). The datasets were acquired from fixed-wing aircraft and were characterised by a high
233
point density (average 24.34 m-2), and horizontal and vertical accuracies of ≤20 cm (additional details,
234
Supplementary Table S2). The lidar point cloud data were provided by the state environment
235
department (Department of Environment, Land, Water and Planning, DELWP) in the form of
236
classified lidar returns containing ground, vegetation, and other classes. Data were quality checked
237
using visual inspection of preliminary vertical profiles within our 17 field plots in ‘3D viewer’ using
238
ArcMap 10.5.1 software [55] to verify that the point cloud corresponded with the field-assessed forest
239
structure. We also confirmed that the point cloud data were in the required projection system and
240
included the expected number of returns, proportion of returns by classes, and the data header
241
(‘lasinfo’ function; ‘Lastools’ software [rapidlasso GmbH, Germany; 56], and that there were no
242
height displacements within flight overlap areas [57].
243
Prior to the calculation of individual tree-crown metrics, point cloud data were height
244
normalised using the Lastools ‘lasheight’ function, after the development of an accurate Digital
245
Terrain Model (DTM) based on the ground-class points. After normalization, a Z-value histogram for
246
each field plot was used to filter out data noise above the maximum tree height (45 m, from field
247
measurements) and near-ground points below 0.6 m, which is recommended as a minimum terrain
248
value for optimising a DTM [58]. A pit-free Canopy Height Model (CHM) was generated from the
normalized point cloud data using the default settings of the algorithm developed by Khosravipour,
250
et al. [59] included in the Lastools software. A range of grid resolutions (0.25, 0.5. 0.75, 1.0, and 2.0 m)
251
were used to initially generate the CHM, and a final resolution of 0.5 m chosen for subsequent steps
252
because, based on visual comparisons with known locations of trees in the field, it provided sufficient
253
detail to delineate the individual-tree crown boundaries and to identify tree positions.
254
2.5. Individual tree detection and manual crown delineation
255
We used several manual (rather than automated) steps involving multiple lines of evidence to
256
identify individual tree crowns in the normalised point cloud and pit-free CHM, which then formed
257
the basis for identifying tree locations. Automatic identification of field-assessed individual trees in
258
the lidar point clouds was not possible because crowns frequently overlap in these natural forests of
259
complex structure (see Figure 3), and because the differential GPS is less reliable under continuous
260
tree canopies and in remote and topographically variable terrain [54].
261
We used ArcMap 10.5.1 [55; Redlands, CA, USA] to define individual-tree locations, which were
262
based on both the post-processed (differentially corrected) tree coordinates as well as the field-based
263
measurements of distance and azimuth from the plot centre; we then overlaid the lidar point cloud
264
and drew an indicative crown boundary based on the field-measured tree live-crown width. We used
265
these indicative crown boundaries to identify the local height maxima within the pit-free CHM and
266
lidar point cloud. The local height maxima were evaluated as the potential top height of an individual
267
tree using four fix-sized windows and one variable-size window. The fixed-sized methods were
268
based on i) ArcMap’s Focal Statistics tool; ii) the Tree Identification and Delineation Algorithm [TIDA;
269
60]; iii) the tree_detection function in the lidR package [61] using the CHM; and iv) the tree_detection
270
function in the lidR package using the point cloud data. For the variable-size method we used the
271
CHM and the CanopyMaxima function in the Fusion software [62], which indicated tree-top
272
coordinates based on the coefficients of the polynomial relationship between height and crown width
273
of the trees as they were measured in the field. We then finalised a tree’s most likely location (as an
274
adjusted shapefile) based on the following steps: i) a provisional tree top based on close agreement
275
(within 1 m) of at least three of the five height maxima; ii) adjusted tree top based on the lidar profile
276
view indicating highest point of the tree closest to the provisional tree top; iii) the provisional tree top
277
was verified by cross-checking the tree height with the field-measured height; iv) the tree form was
278
also verified by cross-checking the lidar profile with additional field measures (e.g. crown base height
279
and crown width) and the panoramic photo of the tree taken during field measurements. This process
280
led to the confident identification of 90 candidate trees (i.e. those assessed in the field) that had
281
negligible canopy overlap in the lidar data. In addition, a further 106 ‘non-candidate’ trees with
282
minimal crown overlap were confidently identified in the lidar data either based on their
field-283
mapped TruPulse locations (i.e. without supporting field-based tree height and photographic
284
information), or from the lidar profile view just beyond the plot boundaries (and still clearly within
285
the same forest type and wildfire severity class; Supplementary Table S1). The full process led to the
286
final delineation of 196 individual tree crown boundaries in the CHM and lidar point cloud data.
290
291
292
293
294
295
296
297
298
299
300
301
302
303
304
305
306
307
308
309
310
311
312
313
314
315
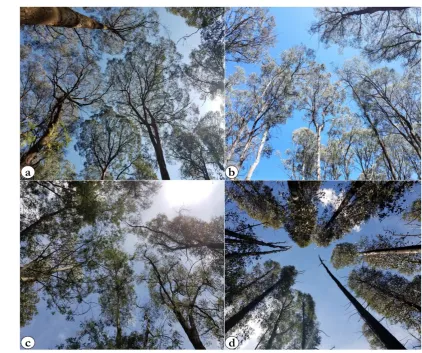
Figure 3: Fish-eye lens views of tree crowns representing each fire-severity class nearly nine years
316
after the 2009 wildfire: a) Unburnt, b) Low, c) Moderate, d) High fire severity.
317
2.6. Individual-tree crown metrics (field and lidar data)
318
Field-based horizontal and vertical crown metrics were calculated for the 342 field-measured
319
candidate trees (Table 1). Field metrics were analysed separately for two tree-size classes based on
320
DBHOB: 20 to 50 cm (representing mature trees), and >50 cm [representing the largest, potentially
321
over-mature trees; 50].
322
Horizontal and vertical lidar metrics (Table 1) were calculated for the 196 trees with
non-323
overlapping crown boundaries (90 candidate trees plus 106 non-field-assessed trees). The
individual-324
tree metrics were calculated using lidar data that were clipped to the manually delineated crown
325
boundaries (CPA; Table 1). The lidar metrics were mostly quantified from the vertical profile of lidar
326
returns classified as canopy hits per height bin [63-65] between the tree’s top height and 7.5 m, which
327
was the maximum height of understorey plants measured in the field (Figure 4). Lidar metrics were
328
calculated using the lidR package in R, or the Lastools software, while ArcMap 10.5.1, and the Fusion
329
software [62] were also used to prepare data for metric calculation.
Table 1. Horizontal and vertical crown metrics assessed for: A) field-assessed trees (n=342); and for
336
B) trees delineated in lidar data (n=196) across four fire-severity classes (Unburnt, Low, Moderate,
337
High)
338
Name Acronym &
units Description
A. Field metrics
Crown
projection area
CPA (m2) Vertical projection of a tree’s crown live area on the horizontal plane estimated from east-west and north-south bulk crown widths using a 𝐴 = 𝜋𝑎𝑏, where a and b are half the widths (Figure 2)
Live crown width
LCW (%) Bulk crown width as a proportion of total crown width (Figure 2), both as the mean of east-west and north-south measurements.
Top live height TLH (m) Measured height to the uppermost live leaf of a tree (Figure 2); top live height and total tree height might not be equal if the tree’s uppermost point is dead
B. Lidar metrics
Crown cover CC (%) Estimated as the number of first returns above 7.5 m height (i.e. top height of the understorey) divided by the number of all first returns (Figure 4); higher CC indicates higher cover projected within the crown boundary on the horizontal plane [66-68] Crown density CD Estimated from the number of all lidar points above 7.5 m
height divided by the number of all returns (Figure 4); a higher CD represents a higher density of plant material within the crown boundary above 7.5 m; crown density can be used as a measure of the amount of leaf material available for maintaining tree productivity and vigour [67-69]
Evenness index EI (0 - 1) A modification of the Shannon–Weiner diversity index (H'), which is estimated from H = −SUM[(pi) * ln(pi)], where, in this case, pi is the proportion of total LiDAR returns that fall within a given 1-m height bin; values close to 1 indicate completely even distribution of crown returns down the profile to 7.5 m height [70-72]
Clumping Index CI (0-1) Calculated as effective Leaf Area Index [LAIeff; 69] over Leaf Area Index [LAI; 73]; unity represents completely random distribution of crown returns down the profile to 7.5 m height, whereas values closer to zero indicate more aggregated leaf distribution [74-76]
Mean leaf area density
LAD_mean (0 -1)
Mean leaf-area density (LAD) of the vertical profile of each 1-m bin between 7.5 1-m and the total tree height; values close to 1 indicate denser crown biomass. Leaf area density profile is calculated by dividing LAI from dz where LAI is estimated from gap fractions at each height interval with a given thickness value of dz [26,61]
Maximum leaf area density
LAD_max (0 -1)
Maximum LAD of the vertical profile (as above); a higher value could indicate a fuller crown [26,61]
Coefficient of variation of LAD
LAD_cv (index)
Percentile height of maximum LAD
HtMaxLAD (%)
Height of LAD_max as a proportion of total tree height; higher value indicates more foliage concentrated near the top of the crown [26,61]
Percentile height of minimum LAD
HtMinLAD
Height of the minimum LAD as a proportion of total tree height; lower value indicates the minimum leaf density occurs towards the bottom of the crown [26,61]
339
340
341
342
343
344
345
346
347
348
349
350
351
352
353
354
355
Figure 4: Illustration of the crown cover and crown density lidar metrics for individual unburnt and
356
burnt trees as estimated from the lidar point cloud.
357
358
We also calculated all lidar metrics using a fixed (unburnt) CPA per tree diameter as tree CPA
359
was visibly influenced by severe wildfire. Fixed CPAs were estimated from a regression of
field-360
measured DBHOB, top live height and crown width for 79 unburnt candidate trees (r = 0.75; P value
361
<0.001; R2 adjusted = 0.60), to provide a representation of pre-fire crown area by tree size. These
fixed-362
CPA lidar metrics were only calculated for those lidar-delineated trees that had also been measured
363
for DBHOB in the field (90 trees in total).
2.7. Statistical analyses
366
We tested the effects of wildfire severity class (unburnt, low, medium, high) on individual tree
367
field- and lidar-based crown metrics using generalised linear mixed effects models (LMEM) in the
368
Lme4 package [77] in R version 3.5.0 [78] with plot nested within site as a random effect. Prior to the
369
analysis, assumptions of normality and variance homogeneity were checked, and transformed
370
dependent variables used as necessary [natural logarithm for height and width variables, arcsine for
371
percentages; 79]. Crown structure can vary with DBHOB and height, therefore we tested those
372
variables as covariates in our LME models of field-assessed trees.
373
Models were run for 342 field-assessed trees, and for the 196 lidar-assessed trees defining all the
374
crown metrics as a response variable, and fire severity types and plot ID as predictor variable. We
375
used ‘lmerTest’ [80] to estimate LMEM parameters; and the ‘car’ package [81] for Wald chi-square
376
tests, which provided the p-value for the model. Where LMEM models indicated significant
377
differences among fire-severity types, post hoc pair-wise comparisons were made and adjusted for
378
multiple comparisons using Fisher's LSD test in the ‘emmeans’ R package [82].
379
3. Results
380
3.1. Field-based metrics
381
Our field assessment included 49 tree species, dominated by three fire-tolerant eucalypts:
382
Eucalyptus radiata (42% of individuals, n=136), E. obliqua (30%, n=100), and E. dives (21%, n=70).
383
Consistent with the definition of the fire-severity classes, there was no evidence of fire scarring on
384
trees at unburnt sites, whereas all trees at high-severity sites were burnt to their total tree height
385
compared with means of 64% of tree height at moderate-severity sites and 25% at low-severity sites
386
(Table 2). Mean percentage of trees with stem epicormic and/or basal resprouts increased in the order
387
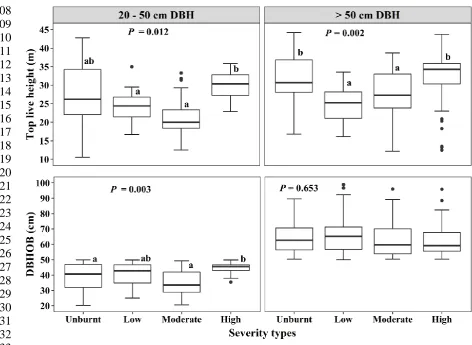
unburnt < low severity < moderate severity < high severity (Table 2). DBHOB means by diameter class
388
of field-measured trees were similar among the fire-severity classes, with the exception of
389
significantly smaller tree diameters at moderate- than high-severity sites in the 20 - 50 cm DBHOB
390
class (Figure 5). In addition, mean top live heights of trees in both the 20 - 50 cm and > 50 cm DBH
391
classes were significantly greater at high- than both low- and moderate-severity sites. Nonetheless,
392
effects of DBHOB and top live height as covariates in LMEM models were consistently
non-393
significant and were subsequently excluded.
394
The live (bulk) crown width of field-measured trees at both moderate- and high-severity sites
395
was significantly less than that at unburnt and low-severity sites (Figure 6). This resulted in
396
significantly lower crown projection area (CPA) and percent live crown width for both mature and
397
larger trees at high-severity sites (Figure 6). In contrast to the horizontal metrics, vertical metrics of
398
field-measured trees were not clearly associated with fire-severity class, as noted above for top live
399
height.
400
401
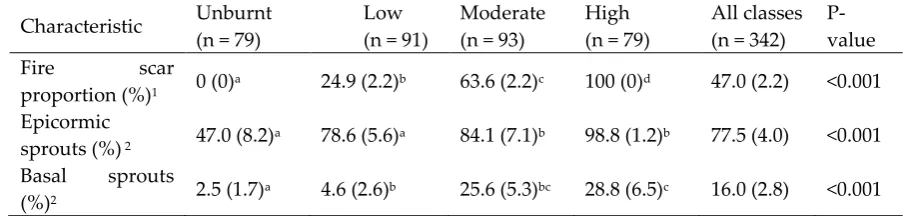
Table 2: Characterization of 342 field-measured trees by fire-severity class (means + SE). P-values
402
indicate the significance of the fire-severity effect in a linear mixed effects model, and different
403
superscript letters indicate significant differences among fire-severity classes (Fisher’s LSD Test).
404
Characteristic Unburnt (n = 79)
Low (n = 91)
Moderate (n = 93)
High (n = 79)
All classes (n = 342)
P-value
Fire scar
proportion (%)1 0 (0)
a 24.9 (2.2)b 63.6 (2.2)c 100 (0)d 47.0 (2.2) <0.001
Epicormic
sprouts (%) 2 47.0 (8.2)
a 78.6 (5.6)a 84.1 (7.1)b 98.8 (1.2)b 77.5 (4.0) <0.001
Basal sprouts
(%)2 2.5 (1.7)
a 4.6 (2.6)b 25.6 (5.3)bc 28.8 (6.5)c 16.0 (2.8) <0.001
1 mean height of fire scarring as a proportion of total tree height
405
2 mean percentage of live trees with stem epicormic resprouts present and with basal resprouts
406
present
409
410
411
412
413
414
415
416
417
418
419
420
421
422
423
424
425
426
427
428
429
430
431
432
433
Figure 5: Comparison of top live height, and diameter at breast height over bark (DBHOB) of
field-434
measured trees among fire-severity classes for both mature (20-50 cm DBHOB) and over-mature trees
435
(>50 cm DBHOB). Graphs are standard boxplots (median as centre line), based on 20 to 59 trees per
436
diameter class for each severity (20 – 50 cm: UB – 34, L - 51, M – 49, H – 20; > 50 cm: UB – 45, L - 40,
437
M – 44, H – 59). P-values are calculated from LME models, and different letters indicate significant
438
differences between fire-severity classes as indicated by posthoc tests (Fisher’s LSD test).
441
442
443
444
445
446
447
448
449
450
451
452
453
454
455
456
457
458
459
460
461
462
463
464
465
466
Figure 6: Comparison of field-measured horizontal crown metrics – crown projection area, and live
467
crown width – among fire-severity types for both mature (left panels) and larger trees. Graphs are
468
standard boxplots (median as centre line), based on 20 to 59 trees per diameter class for each of the
469
severity classes (20 – 50 cm: UB – 34, L - 51, M – 49, H – 20; > 50 cm: UB – 45, L - 40, M – 44, H – 59).
470
P-values are calculated from LME models, and different letters indicate significant differences
471
between fire-severity classes as indicated by posthoc tests (Fisher’s LSD test).
472
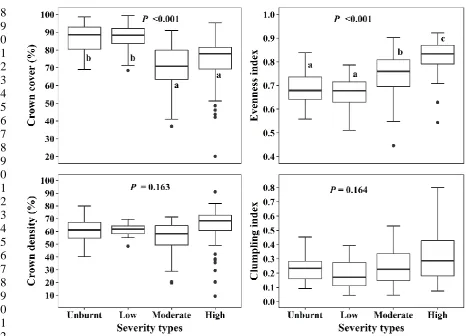
3.2. Lidar-based metrics
473
Lidar-derived estimates of crown projection area (CPA) and total tree height were highly
474
correlated with field-based measurements (r2 = 0.72 and 0.77 respectively), although lidar-derived
475
CPA was consistently lower than field-measured CPA for 10 trees above 100 m2 (Supplementary
476
Figure S3).
477
Mean crown cover (CC) of trees delineated in the lidar data was significantly lower at moderate-
478
and high-severity sites than unburnt and low-severity sites (Figure 7). In contrast, mean density
479
within individually delineated CPAs was not clearly influenced by fire severity, while (vertical)
480
crown evenness significantly increased from unburnt and low-severity sites to moderate-severity
481
sites, and again to high-severity sites (Figure 7). Trends in these lidar-derived metrics among
fire-482
severity classes were similar when calculated within fixed-area CPAs that estimated the size of
483
unburnt crowns, with the exception of the clumping index, which was not clearly influenced by fire
484
severity when calculated for individually-delineated CPAs (Figure 7) but significantly increased with
485
fire severity when estimated for fixed-area CPAs (Supplementary Figure S4).
489
490
491
492
493
494
495
496
497
498
499
500
501
502
503
504
505
506
507
508
509
510
511
512
Figure 7: Comparison of lidar-derived crown metrics – crown cover, crown density, evenness index
513
and clumping index – among fire-severity types for trees delineated in the lidar data. Graphs are
514
standard boxplots (median as centre line), based on 41 to 60 trees per severity type (UB - 41, L - 43, M
515
- 52, H - 60). P-values are from LME models, and different letters indicate significant differences
516
between fire-severity types as indicated by posthoc tests (Fisher’s LSD test).
517
518
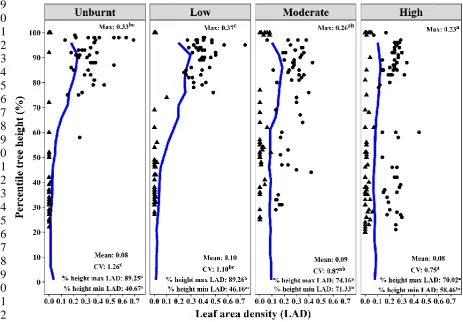
Mean LAD profiles indicated a more even distribution of tree crowns down the stems at high-
519
and moderate-severity sites than at low-severity and unburnt sites (Figure 8). This change in crown
520
structure from full crowns at the top of the stem in the unburnt condition to a vertically elongated
521
crown after moderate- and particularly high-severity fire was reflected in the LAD metrics. For
522
example, mean maximum LAD and the coefficient of variation of LAD were significantly decreased
523
at high-severity sites, and, to a lesser degree at moderate-severity sites (Figure 8). In addition, the
524
percentile height of maximum LAD at high- and moderate-severity sites was consistently lower than
525
low-severity and unburnt sites, whereas the percentile height of minimum LAD tended to be higher
526
(Figure 8). Similar trends and significant effects in LAD metrics were also evident when calculated
527
for CPAs that were standardized by DHBOB to estimate the pre-fire crown area (Supplementary
528
Figure S5).
539
540
541
542
543
544
545
546
547
548
549
550
551
552
553
554
555
556
557
558
559
560
561
562
563
Figure 8: Comparison of lidar-derived metrics extracted from Leaf area density (LAD) profiles –
564
maximum LAD (LADmax), mean LAD (LADmean), coefficient of variation of LAD (LADcv),
565
percentile height of maximum LAD (HtmaxLAD) and percentile height of minimum LAD
566
(HtminLAD) – among fire-severity types. Mean LAD profile (blue line), percentile height of the
567
minimum LAD (triangles), and percentile height of the maximum LAD (circles) are based on 41 to 60
568
trees per severity class (UB - 41, L - 43, M - 52, H – 60; as individual filled circles and triangles).
In-569
figure blue line represents mean LAD profile, triangles and circles are minimum and maximum LAD,
570
values are the mean metrics and superscript letters indicate pairwise comparison at p < 0.001
571
(LADmax), p < 0.001 (LADcv), p = 0.461 (LADmean), p = 0.003 (HtmaxLAD), and p < 0.001
572
(HtminLAD). P-values are calculated from LME models, and different letters indicate significant
573
differences between fire-severity types as indicated by posthoc tests (Fisher’s LSD test).
574
4. Discussion
575
Studies of the effects of fire on forest canopy structure have mainly focused on stand and
576
landscape scales with few exceptions [e.g. 83]. Our study provides lidar-derived metrics uniquely
577
applied at the individual-tree level to quantitatively describe fire-affected tree crowns that were
578
supported by field measurements. Our data provide clear evidence of the legacy effects of a
579
landscape-scale wildfire on the horizontal and vertical architecture of individual eucalypt crowns in
580
a fire-tolerant forest that have persisted for nearly a decade.
581
Persistent changes were apparent in the horizontal crown structure of the fire-tolerant eucalypts
582
8.5 years post wildfire. Consumption of small branches in burnt crowns led to significant decreases
583
in crown width and projected area of both medium- and large-sized trees at moderate- and
high-584
severity sites. There is a lack of comparative tree-scale studies; however, our results are consistent
585
with high-severity wildfire leading to persistently more open forest canopies at stand- and
landscape-586
scales at, for example, 5 to 7 years post-fire in mixed-conifer forests of the Sierra Nevada [84]; 26 years
rainforest of British Columbia, Canada [38].
589
The vertical crown structure of fire-tolerant eucalypts was also influenced by severe wildfire.
590
Crowns of trees burnt by high-severity wildfire remained cylindrical in shape due to post-fire
591
epicormic resprouting down the main stem, and had not recovered the full, rounded crowns that
592
characterized unburnt trees. These post-fire elongated crowns were evident in our tree-based LAD
593
profiles [86], and in our evenness index (EI), which averaged 0.75 in moderate-severity plots, and 0.85
594
in high-severity plots, comparatively higher than an EI of 0.71 in mixed loblolly pine forest three years
595
after fire in Florida, USA [72]. Despite changes in the vertical crown structure, top live height of our
596
field-assessed trees was not clearly influenced by fire severity, which is in contrast to significantly
597
lower heights of fire-tolerant eucalypt trees in Western Australia 78 years after high-intensity fire [12].
598
This difference could be due to many factors including variation in the pre-fire top heights among
599
fire-severity sites in our study (data not available), and/or the much greater diameter of the surviving
600
eucalypts in the Western Australian study (>1 m cf. ~ 40 cm in this study), particularly since stem
601
breakages are common in large eucalypts [e.g. 87].
602
Crowns of severely burnt trees held a similar amount of foliage to low severity and unburnt trees
603
despite the change in shape. This is consistent with rapid recovery of LAI after 3 to 6 years of fire at
604
landscape scales in Australian eucalypt forests [14], although noting that our finer-scale data provide
605
more information about how canopy leaves are arranged in the post-fire period. Since eucalypt leaves
606
have a lifespan of between 1.5 and 4 years [88-90], our data at nearly 10 years post-fire indicate that
607
epicormic recovery can leave a persistent impression on the crown architecture of fire-tolerant
608
eucalypts – that is, a similar amount of foliage but concentrated closely around the main branches
609
and down the stem. The reasons for this persistent ‘epicormic structure’ remain unclear but could be
610
related to the severity and extent of the Black Saturday fire, and its occurrence at the end of a
611
prolonged drought. That is, high fire severity combined with prevailing dry conditions increased tree
612
mortality [50], which coupled with contraction of surviving crowns, led to increased light infiltration
613
to the lower strata, fostering the persistence of lower leaves that might otherwise be shaded out by
614
full canopy recovery. What these changed crown shapes mean for forest productivity remains unclear.
615
Leaves lower down the stem might have less access to direct sunlight [91] and thereby have lower
616
photosynthetic efficiency than leaves higher up in the canopy. This could mean that high-severity
617
sites are less productive for many years after fire, although noting that little is known about how net
618
ecosystem productivity varies with time since fire in these fire-tolerant forests [92]. Other potential
619
changes associated with an opening up of the canopy in fire-tolerant forests could influence the
620
likelihood of subsequent fires; that is, a more open canopy would presumably increase heat and light
621
exposure of the understory, changing the moisture environment of fine fuels and influencing
622
flammability [93].
623
Persistent changes in post-fire eucalypt crowns could also have implications for the accuracy of
624
tree carbon stock estimations, which are often based on allometric equations that assume a scaled
625
relationship with tree diameter [94]. Eucalypt allometric equations have traditionally been based on
626
unburnt trees, whereas the persistent effects in our study suggest that new allometric relationships,
627
at least for the crown component of tree biomass, might be needed for severely burnt trees that are
628
yet to fully recover. This, in turn, will improve estimation and validation of tree carbon stocks at
629
larger scales, which are often based on plot-level aggregates of individual tree estimates.
630
Our lidar-based crown metrics proved effective in describing the complex crown architecture of
631
evergreen eucalypt trees, and in quantifying the long-lasting effects of severe fire at the
individual-632
tree level. Our horizontal and vertical crown lidar crown metrics will inform interpretation of canopy
633
patterns in lidar data at landscape scales; for example, we anticipate that the lower cover of trees
634
burned by moderate- and high-severity fire will contribute to greater canopy gaps and more openness
635
at stand- and landscape-scales. In addition, our tree-level characterization can inform the
636
interpretation of remotely sensed optical data since stronger characterization of the tree layer will
637
assist with separating the canopy from the understory in remote sensing analyses of post-fire
recovery [e.g. 14]. In turn, this will assist with stronger characterization of forest recovery, and
639
associated services like carbon sequestration and water provision, at larger scales.
640
5. Conclusions
641
Changes in tree crown structure after severe wildfire is crucial to understanding the potentially
642
persistent effects of fire on tree productivity and associated processes like water use and carbon
643
sequestration. This study confirmed that severely burnt trees had not recovered their full, rounded
644
crown structure 8.5 years after the fire, and instead were characterized by elongated, cylindrical
645
crowns reflecting persistence of prolific epicormic resprouting down the stem in the post-fire
646
environment. Our detailed tree characterization, based on unique tree-based lidar metrics, provides
647
a robust assessment for comparisons with future lidar data to characterize recovery in the coming
648
years. Full recovery of tree crowns to 8.5 years in our study could have been slowed by the severity
649
of the Black Saturday fire coupled with prevailing dry conditions. Nonetheless, climate projections
650
for south-eastern Australia indicate drier, hotter conditions and more frequent severe fire weather
651
[95]. Our study could thus portend an increase in the incidence of persistent legacy effects on tree
652
crowns, leading to more open canopies, and flow-on effects to the fuel structure, microclimate, and
653
function of these fire-tolerant eucalypt forests. Finally, this research demonstrated the utility of
654
airborne lidar data for assessing post-fire severity effects on structurally complex tree crowns.
655
Quantified effects of contrasting fire severities using this approach fully utilizes the ability of lidar
656
data to provide a strong basis for interpreting post-fire patterns in forest canopies and vegetation
657
profiles and other remotely-sensed data at larger scales.
658
659
Supplementary Materials: The following are available online, Figure S1: Overarching schematic of study design,
660
Figure S1: Sample plot layout for field-based assessments illustrating the arrangement of three plots per site
661
(minimum distance of 50 m between the plot centres, orientated at 30 and 90 degrees from the centre of plot ‘A’),
662
Figure S3: Comparison of lidar-derived and field-measured crown projection areas (CPA, left) and total tree
663
height of candidate trees (n = 90) by fire-severity class. Dashed line is the 1 to 1 line. Figure S4: Comparison of
664
lidar-derived crown metrics – crown cover, crown density, evenness index and clumping index – among
fire-665
severity classes for field-based trees that were also delineated in the lidar data. Metrics were calculated within
666
standardised CPAs that were estimated from relationships with DBHOB of unburnt trees, and are based on 11
667
to 24 trees per severity types (UB – 21, L - 22, M – 24, H – 23), Figure S5: Comparison of lidar-derived metrics
668
extracted from Leaf area density (LAD) profiles – maximum LAD (LADmax), mean LAD (LADmean), coefficient
669
of variation of LAD (LADcv), percentile height of maximum LAD (HtmaxLAD) and percentile height of
670
minimum LAD (HtminLAD) – among fire-severity classes for field-based trees that were also delineated in the
671
lidar data. Metrics were calculated within standardised CPAs that were estimated from relationships with
672
DBHOB of unburnt trees. Mean LAD profile (blue line), percentile height of the minimum LAD (triangles), and
673
percentile height of the maximum LAD are based on 41 to 60 trees per severity class (UB - 41, L - 43, M - 52, H -
674
60). In-figure values are the mean metrics and superscript letters indicate pairwise comparison at p < 0.027
675
(LADmax), p = 0.01 (LADcv), p = 0.557 (LADmean), p = 0.137 (HtmaxLAD), and p < 0.001 (HtminLAD). P-values
676
are calculated from LME models, and different letters indicate significant differences between fire-severity
677
classes as indicated by posthoc tests (Fisher’s LSD test), Table S1: Numbers of individual trees assessed in the
678
field (‘candidate trees) and delineated in the lidar data by wildfire severity class, Table S2: Summary of lidar
679
acquisition and sensor specifications
680
Author Contributions: Y.K.K carried out all the reference study design and field work, dataset design, the lidar
681
data processing, analyzed the data and drafted the manuscript original text. L.T.B. contributed guidance on
682
research methodologies and forest fire, study design and assisted in the field work. She also supervised in the
683
steps of reference plot design, result interpretation and discussion and conclusion as well as reviewing the
684
manuscript. T.D.P assisted in the fire regime understandings, conceptualization and supervised in modelling as
685
well as supporting in R software. C.A. contributed in minor revision, feedback and supervising the ecological
686
application as well as supporting in R. All co-authors provided comments and revised the manuscript.
Acknowledgments: The authors would like to acknowledge the financial support of a Melbourne Research
690
Scholarship to Yogendra Karna. This research was supported by the Victorian Department of Environment, Land,
691
Water and Planning through the Integrated Forest Ecosystem Research program. We would like to thank Julio
692
Cesar Najera-Umana, Ben Smith and Cordula Gutekunst for their diligent fieldwork. Similarly, we would also
693
like to thank Paul Donald Bentley for his support in lidar data analysis using R software. Advice on statistical
694
analyses was provided by Cameron Patrick from the Statistical Consulting Centre at The University of
695
Melbourne, and GPS post-correction support was provided by Ultimate Positioning Group.
696
Conflicts of Interest: The authors declare no conflict of interest.
697
698
References
699
1. Bowman, D.M.J.S.; Balch, J.; Artaxo, P.; Bond, W.J.; Cochrane, M.A.; D’Antonio, C.M.; DeFries, R.;
700
Johnston, F.H.; Keeley, J.E.; Krawchuk, M.A., et al. The human dimension of fire regimes on Earth.
701
Journal of Biogeography 2011, 38, 2223-2236, doi:doi:10.1111/j.1365-2699.2011.02595.x.
702
2. IPCC. Climate Change 2014–Impacts, Adaptation and Vulnerability: Regional Aspects; Cambridge University
703
Press: 2014.
704
3. Enright, N.J.; Fontaine, J.B.; Bowman, D.M.J.S.; Bradstock, R.A.; Williams, R.J. Interval squeeze: altered
705
fire regimes and demographic responses interact to threaten woody species persistence as climate
706
changes. Frontiers in Ecology and the Environment 2015, 13, 265-272, doi:10.1890/140231.
707
4. Millar, C.I.; Stephenson, N.L. Temperate forest health in an era of emerging megadisturbance. Science
708
2015, 349, 823-826, doi:10.1126/science.aaa9933.
709
5. Attiwill, P.M.; Adams, M.A. Mega-fires, inquiries and politics in the eucalypt forests of Victoria,
south-710
eastern Australia. Forest Ecology and Management 2013, 294, 45-53,
711
doi:http://dx.doi.org/10.1016/j.foreco.2012.09.015.
712
6. Bradstock, R.; Penman, T.; Boer, M.; Price, O.; Clarke, H. Divergent responses of fire to recent warming
713
and drying across south-eastern Australia. Global Change Biol. 2014, 20, 1412-1428, doi:10.1111/gcb.12449.
714
7. Fairman, T.A.; Nitschke, C.R.; Bennett, L.T. Too much, too soon? A review of the effects of increasing
715
wildfire frequency on tree mortality and regeneration in temperate eucalypt forests. International Journal
716
of Wildland Fire 2015, 10.1071/wf15010, doi:10.1071/wf15010.
717
8. DSE. Remote Sensing Guideline for Assessing Landscape Scale Fire Severity in Victoria’s Forest Estate;
718
Department of Sustainability and Environment: Melbourne, Victoria, Australia, 2009.
719
9. Keeley, J.E. Fire intensity, fire severity and burn severity: a brief review and suggested usage. Int J
720
Wildland Fire 2009, 18, 116-126, doi:http://dx.doi.org/10.1071/WF07049.
721
10. Beringer, J.; Hutley, L.B.; Tapper, N.J.; Coutts, A.; Kerley, A.; O'Grady, A.P. Fire impacts on surface heat,
722
moisture and carbon fluxes from a tropical savanna in northern Australia. International Journal of
723
Wildland Fire 2003, 12, 333-340, doi:10.1071/wf03023.
724
11. Palace, M.; Keller, M.; Asner, G.P.; Hagen, S.; Braswell, B. Amazon forest structure from IKONOS
725
satellite data and the automated characterization of forest canopy properties. Biotropica 2008, 40,
141-726
150.
727
12. Wardell-Johnson, G.; Crellin, L.; Napier, C.; Meigs, G.; Stevenson, A.; Wong, S.I. Has canopy height and
728
biomass recovered 78 years after an intense fire in south-western Australia's red tingle (Eucalyptus
729
jacksonii) forests? International Journal of Wildland Fire 2017, 10.1071/wf16143, doi:10.1071/wf16143.
730
13. Prior, L.D.; Williamson, G.J.; Bowman, D.M. Impact of high-severity fire in a Tasmanian dry eucalypt
731
forest. Australian Journal of Botany 2016, 64, 193-205.
732
14. Caccamo, G.; Bradstock, R.; Collins, L.; Penman, T.; Watson, P. Using MODIS data to analyse post-fire
733
vegetation recovery in Australian eucalypt forests. J. Spat. Sci. 2015, 60, 341-352,
734
doi:10.1080/14498596.2015.974227.
735
15. Norman, J.M.; Campbell, G.S. Canopy structure. In Plant Physiological Ecology: Field methods and
736
instrumentation, Pearcy, R.W., Ehleringer, J.R., Mooney, H.A., Rundel, P.W., Eds. Springer Netherlands:
737
Dordrecht, 2000; 10.1007/978-94-010-9013-1_14pp. 301-325.
738
16. Latham, P.A.; Zuuring, H.R.; Coble, D.W. A method for quantifying vertical forest structure. Forest
739
Ecology and Management 1998, 104, 157-170, doi:http://dx.doi.org/10.1016/S0378-1127(97)00254-5.
740
17. Yao, W.; Krzystek, P.; Heurich, M. Tree species classification and estimation of stem volume and DBH
741
based on single tree extraction by exploiting airborne full-waveform LiDAR data. Remote Sensing of
742
Environment 2012, 123, 368-380, doi:http://dx.doi.org/10.1016/j.rse.2012.03.027.