Fusion of D ata from Visual and
Low-Spatial-Resolution Therm al
Cameras for Surveillance
Gwynfor Jones
This thesis is subm itted in partial fulfilment of the
requirements for the degree of Master of
Philosophy
Centre for Advanced Instrumentation Systems
University College London
ProQuest Number: U644126
All rights reserved
INFORMATION TO ALL USERS
The quality of this reproduction is dependent upon the quality of the copy submitted.
In the unlikely event that the author did not send a complete manuscript
and there are missing pages, these will be noted. Also, if material had to be removed,
a note will indicate the deletion.
uest.
ProQuest U644126
Published by ProQuest LLC(2016). Copyright of the Dissertation is held by the Author.
All rights reserved.
This work is protected against unauthorized copying under Title 17, United States Code.
Microform Edition © ProQuest LLC.
ProQuest LLC
789 East Eisenhower Parkway
P.O. Box 1346
This research was undertaken within the P ostgraduate T raining P artnership established
between Sira L td and University College London. P ostgraduate Training P artnerships are a
joint initiative of the D epartm ent of Trade and Industry and the Engineering and Physical
Sciences Research Council. They are aimed a t providing research training relevant to a career
in industry, and fostering closer links between th e science base, industrial research, and
A bstract
This thesis investigates w hether the segm entation of surveillance images can be improved by
fusing low-spatial resolution therm al d a ta w ith high-spatial resolution visual information. The
context of this investigation is the surveillance of sterile zones where an alarm is required
should a person enter the zone and at no other time. T he aim is to reduce false alarm s due to
wildlife movement or changes in environm ental conditions.
C urrent work on the fusion of visual and therm al d a ta employs expensive high-spatial
resolution cameras which preclude m any applications; however the advent of low-cost, low-
spatial resolution therm al cameras is providing new opportunities. This thesis explores the
design issues and advantages in using such an array in conjunction with a visual camera.
A calibration methodology has been designed to allow the mapping of a point in one
image onto the equivalent point in the other despite th e operational constraints of different
imaging modalities, resolutions and lens systems.
Once they are calibrated it is possible to extract areas of interest from the visual
cam era using the information from the therm al. Therefore only the relevant p art of the visual
image is processed allowing a more sophisticated segm entation algorithm to be used.
Processing in the visual domain is initiated by a m ethod of background representation or
change detection.
Segmentation of the highlighted object is achieved using Markov Random Fields. An
im plementation has been developed which extends previous research by fusing d a ta from the
visual and therm al cameras both for static and tem poral image sequences.
A Hidden Markov Model has been developed to classify pixels in the therm al image
for superior extraction of objects of interest over a wide range of operating conditions. This
improves the isolation of the object in th e therm al image compared w ith using a threshold
Acknowledgements
I would like to take this opportunity to th an k my supervisors Prof. Richard Allsop (C entre for
Transport Studies (GTS) at University College London) , D r John Gilby (Sira L td.), Dr
M ark Hodgetts (formerly of Sira Ltd. now at Cambridge Research Sciences) and Dr Maria-
Alicia Vicencio-Silva (CTS). I would also like to thank Dr Neil Sum pter a t Irisys. Their
support and guidance has been invaluable.
Then to t h e rolling Heav'n itself I cried,
Asking, "What Lamp had Destiny to guide
Her little Children stumbling in t h e Dark?"
And - "A blind Understanding!" Heav'n replied.
Publications
Papers
JO N ES, G.D., H OD GETTS, M.A., ALLSOP, R.E., SUM PTER, N. and VICENCIO-SILVA,
M.A., (2001). A Novel Approach fo r Surveillance Using Visual and Thermal Images. Proc. D E R A /IE E W orkshop on Intelligent Sensor Processing. Birm ingham, UK . 14‘^ F ebruary
2001.
Conference Presentations
A Novel Approach fo r Surveillance Using Visual and Thermal Images. Proc. D E R A /IE E W orkshop on Intelligent Sensor Processing. Birmingham, UK . 14“^ February 2001.
Bayesian Analysis fo r Data Fusion o f Disparate Imaging System s fo r Surveillance. Joint BM VA/RSS Symposium on Probabilistic Models in Vision and Signal Processing, London,
Contents
ABSTR ACT ... 3
ACKNOWLEDGEMENTS...4
PUBLICATIONS... 5
Pa p e r s... 5
Co n f e r e n c e Pr e s e n t a t io n s... 5
CONTENTS... 6
TABLE OF FIGURES...10
CHAPTER 1 - INTRODUCTION...13
1.1 THIS T H E S IS ... 15
1.1.1 Research...15
1.1.2 Development o f the Thesis...15
1.2 Mo t iv a t io n...17
1.3 Pr e v io u s Wo r k...22
1.3.1 Background Representation...25
1.3.2 Image Analysis Using In fra re d...27
1.3.2.1 E x istin g IR S y s t e m s ... 30
1.4 Co n c l u s io n s... 30
CHAPTER 2 - SENSOR FUSIO N...33
2.1 In t r o d u c t i o n... 33
2.1.1 Sensor Fusion Strategies...37
2.2 Ap p r o a c h e st o s e n s o rf u s i o n... 39
2.2.1 A Probabilistic A pproach...39
2.2.1.1 B ayesian P r o b a b ilitie s ... 40
2 .2 .1 .2 .M arkov R andom F ie ld s...42
2.2.1.3 B ayesian B e lie f N e tw o r k s ...44
2.2.2 D em pster-Shafer...4 ^
2.2.3 Fuzzy L o g ic...4 ^
2.2.4 Neural Networks...4 ^
2.3 Fu s io n o f In f r a r e da n d Visib l e Im a g e s... 52
2.4 Co n c l u s io n s... 55
CHAPTER 3 - CALIBRATION TECHNIQUES...56
3.1 In t r o d u c t i o n... 56
3.2 Ca m e r a Sp e c if ic a t io n s...57
3.2.1 F O V and Resolution Issu es...58
3.3 Ca m e r a Ca l ib r a t io n a n d Ge o m e t r ic a l Co n s id e r a t io n s... 59
3.3.1 Lens Distortion M odels...61
3.3.2 Geometry...62
3.3.3 Calculation o f the Geometrical M apping...63
3.4 Ta r g e t Co n s id e r a t io n s... 67
3.4-1 Interpolation - Calculating the Centre o f the Saturation A rea s...69
3.5 Me t h o d o l o g y o f t h e Ca l ib r a t io n Pr o c e s s... 75
3.6 Co n c l u s io n s... 76
CHAPTER 4 - CALIBRATION RESULTS... 78
4.1 Eq u ip m e n t... 79
4.2 Ca l c u l a t in g t h e Ca m e r a Va r i a b l e s...77
4.3 Re s u l t s... 81
4 .4 Te s t in g t h e Co d e... 83
4.5 Co n c l u s io n s... 90
CHAPTER 5 - THE PROCESSING OF STATIC IMAGES...95
5.1 Pr o b l e m Do m a i n...95
5.2 Pr e-p r o c e s s in g t h e Im a g e...98
5.3 Th e Ma r k o v Pr o c e s s...100
5.3.1 R e su lts...101
5.4 Ex t e n d in g t h e Ma r k o v Ra n d o m Fi e l d...106
5.4-1 R e su lts...108
5.4-2 Improving the Accuracy o f the Extended Markovian F usion...I l l 5.5 Co n c l u s io n s...120
CHAPTER 6 - ANALYSIS OF MOTION SEQUENCES... 121
6.1 In t r o d u c t i o n... 121
6.2 In c o r p o r a t in g Tim ein t o t h e Ma r k o v ia n Fr a m e w o r k... 123
6.4 C o n c l u s i o n s ...133
CHAPTER 7 - IMPROVING THE DETECTION OF OBJECTS WITHIN THE THERMAL DOM AIN...134
7.1 Pr e v io u s Wo r k...136
7.2 Th e Th r e e St a t e Mo d e l...137
'7.2.1 Initial R e s u lts...139
7.3 Tr a in in g t h eE M M ... 141
1.3.1 Results after Training ...145
7.4 The Advantag eof UsingtheE M M ... 147
7.5 Co n c l u s io n s...148
CHAPTER 8 - CONCLUSIONS AND FUTURE WORK...150
8.1 Co n c l u s io n s... 150
8.2 Dis c u s s io n... 154
8.2.1 Camera Calibration...154
8.2.2 The Markovian Fusion P ro ce ss...155
8.2.3 The Independence A ssu m p tio n...156
8.3 Fu t u r e Wo r k... 156
8.3.1 The Camera Calibration ...156
8.3.2 Investigation o f the Independence Assumption...157
8.3.3 Speeding up the Markovian Fusion P ro ce ss...157
8.3.4 The Segm entation and Classification o f Objects in the Visual D om ain...158
8.3.5 The HMM Procedure...159
8.3.6 Summary o f Future Research...160
BIBLIOGRAPHY...161
APPENDIX A - INFRARED IMAGING...181
A .l In f r a r e d De t e c t o r s...184
A .1.1 Detector Characteristics...188
A .1.2 Optics...190
APPENDIX B - CALIBRATION GEOMETRY...191
B .l Th e Pin h o l e Ca m e r a Mo d e la n d Pe r s p e c t iv e Ge o m e t r y...191
B.3 S t e r e o S y s t e m s ...196
APPENDIX C - MARKOV RANDOM FIELDS... 199
C .l Ba y e s ia n Pr o b a b il it ie s... 199
0 .2 Im a g e Se g m e n t a t io nu s in g M R F ...202
APPENDIX D - THE INDEPENDENCE ASSUM PTIO N... 205
D .l In t r o d u c t i o n...205
D.2 An alysisof Object Distributions...207
D.3 Analysisof Backg ro und Dist r ib u t io n s...212
D.4 Co n c l u s io n s...217
APPENDIX E - HIDDEN MARKOV MODELS...218
Table of Figures
Fi g u r e 2-1 Fu z z y Se t s v s. Cr i s p Se t s...4 7 Fi g u r e 3-1 Ge o m e t r i c a l Re p r e s e n t a t i o n o ft h e Ca m e r a Co n f i g u r a t i o n... 6 4 Fi g u r e 3 -2 Th e Ro t a t i o n a l a n d Tr a n s l a t i o n a l Co m p o n e n t s o f t h e Vis u a l a n d Th e r m a l Ca m e r a
Sy s t e m... 6 4 Fi g u r e 3 -3 Ta r g e t int h e Th e r m a l Im a g e... 6 8 Fi g u r e 3 -4 Ta r g e t int h e Vis u a l Im a g e... 6 9
Fi g u r e 4 -1 Im a g e s Us e dt o Ca l c u l a t e t h e Ca l i b r a t i o n Pa r a m e t e r s...81
Fi g u r e 4 -2 Im a g e su s e d t o Te s t t h e Ca l i b r a t i o n Pa r a m e t e r s... 8 3 Fi g u r e 4 -3 Re l a t i v e Pl a c e m e n t o f Ac t u a l Po s i t i o n s a g a i n s t Pr e d i c t e d Po s i t i o n s in t h e Vis u a l Im a g e... 8 5 Fi g u r e 4 -4 Re l a t i v e Pl a c e m e n t o f Ac t u a l Po s i t i o n s a g a i n s t Pr e d i c t e d Po s i t i o n si nt h e Th e r m a l Im a g e... 8 5 Fi g u r e 4 -5 Th e Pr a c t i c a l Co n s e q u e n c eo ft h e Ca l i b r a t i o n Pr o c e d u r e... 91
Fi g u r e 4 -6 Ex t r a c t i n g t h e Ob j e c t o f In t e r e s ta s Is o l a t e d i n Fi g u r e 4 . 5 ... 9 2 Fi g u r e 4 -7 Is o l a t e d Vis u a l Ob j e c t Ma p p e d f r o m t h e Th e r m a l Im a g e u s in g a n An g l e o f Ro t a t i o n OF 0 R a d i a n s ... 9 3 Fi g u r e 4 -8 Is o l a t e d Vis u a l Ob j e c t Ma p p e df r o m t h e Th e r m a l Im a g eu s in g a n An g l eo f Ro t a t i o n OF 0 .4 R a d i a n s ...9 3 Fi g u r e 5-1 a) Sc e n ew i t h a n o b j e c t o f i n t e r s t, a n d b) t h es a m es c e n e b u tw i t h o u t t h e o b j e c t o f IN TE R E ST ... 9 8 Fi g u r e 5 -2 Di f f e r e n c e Im a g eb e t w e e nf i g u r e s 5 -1aa n d 5 -1b... 9 9 Fi g u r e 5 -3 Ex t r a c t e d Se c t i o n so ft h e Th e r m a la n d Vi s u a l Im a g e s Re s p e c t i v e l y...9 9 Fi g u r e 5 -4 Se g m e n t a t i o n Re s u l t sf r o m t h e Ma r k o v i a n Pr o c e s s...102
Fi g u r e 5 -5 Th e Tr u e Se g m e n t e d Im a g e sf o r Da t a Se t s 1 t o 4 ...103
Fi g u r e 5 -6 Se g m e n t a t i o n Re s u l t sf o r Dat a Se t 2 ...104
Fi g u r e 5 -7 Se g m e n t a t i o n Re s u l t sf o r Da t a Se t 3 ... 105
Fi g u r e 5 -8 Se g m e n t a t i o n Re s u l t sf o r Da t a Se t 4 ... 105
Fi g u r e 5 -9 Se g m e n t a t i o n Re s u l t sf o r Da t a Se t 1 u s in gt h e Ex t e n d e d M R F ... 108
Fi g u r e 5 -1 0 Se g m e n t a t i o n Re s u l t sf o r Da t a Se t 2 u s in gt h e Ex t e n d e d M R F ... 109
Fi g u r e 5 -1 1 Se g m e n t a t i o n Re s u l t sf o r Da t a Se t 3 u s in gt h e Ex t e n d e d M R F ... 109
Fi g u r e 5 -1 2 Se g m e n t a t i o n Re s u l t sf o r Da t a Se t 4 u s in gt h e Ex t e n d e d M R F ... 110
Fi g u r e 5 -1 3 Se g m e n t a t i o n Re s u l t s f o r Da t a Se t 1 u s in g t h e Ex t e n d e d M R F u s in g Co n f i d e n c e Li m i t s... 113
Fi g u r e 5 -1 4 Se g m e n t a t i o n Re s u l t s f o r Da t a Se t 2 u s in g t h e Ex t e n d e d M R F u s in g Co n f i d e n c e Li m i t s... 113
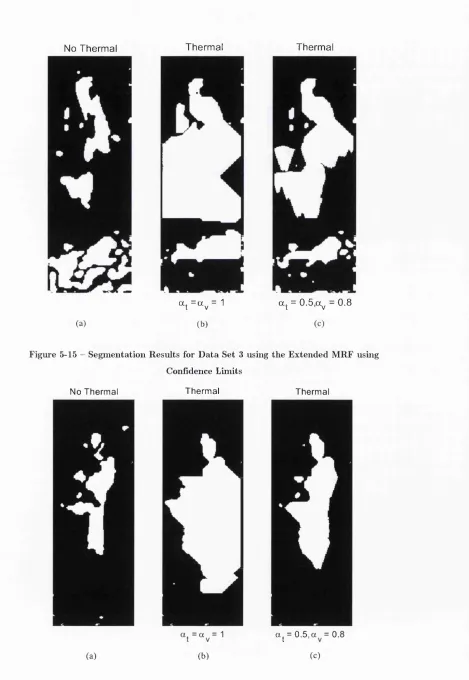
Fi g u r e 5 -1 5 Se g m e n t a t i o n Re u s l t s f o r Da t a Se t 3 u s in g t h e Ex t e n d e d M R F u s in g Co n f i d e n c e Li m i t s...114
Fi g u r e 5 -1 6 Se g m e n t a t i o n r e u s l t s f o r Da t a Se t 4 u s in g t h e Ex t e n d e d M R F u s in g Co n f i d e n c e Li m i t s...114
Fi g u r e 5 -1 8 Se g m e n t a t i o n Re s u l t s f o r Da t a Se t 1 u s in g t h e Ex t e n d e d M R F u s in g Co n f i d e n c e
Li m i t sa n dt h e In t e r p o a t e d Th e r m a l Im a g e...116
Fi g u r e 5 -1 9 Ex t r a c t e d Se c t i o n o f t h e Th e r m a l Im a g e f o r Da t a Se t 2 a n d t h e Eq u i v a l e n t Se c t i o n In t e r p o l a t e d...1 1 7 Fi g u r e 5 -2 0 Se g m e n t a t i o n Re s u l t s f o r d a t a Se t 2 u s in g t h e Ex t e n d e d M R F u s in g Co n f i d e n c e Li m i t s a n dt h e In t e r p o l a t e d Th e r m a l Im a g e... 1 1 7 Fi g u r e 5 -2 1 Ex t r a c t e d Se c t i o n o f t h e Th e r m a l Im a g e f o r Da t a Se t 3 a n d t h e Eq u i v a l e n t Se c t i o n In t e r p o l a t e d... 118
Fi g u r e 5 -2 2 Se g m e n t a t i o n Re s u l t s f o r Da t a Se t 3 u s in g t h e Ex t e n d e d M R F u s in g Co n f i d e n c e Li m i t sa n dt h e In t e r p o l a t e d Th e r m a l Im a g e... 118
Fig u r e 5 -2 3 Ex t r a c t e d Se c t i o n o f t h e Th e r m a l Im a g e f o r Da t a Se t 4 a n d t h e Eq u i v a l e n t Se c t i o n In t e r p o l a t e d...119
Fig u r e 5 -2 4 Se g m e n t a t i o n Re s u l t s f o r d a t a Se t 4 u s in g t h e Ex t e n d e d M R F u s in g Co n f i d e n c e Li m i t sa n dt h e In t e r p o l a t e d Th e r m a l Im a g e...119
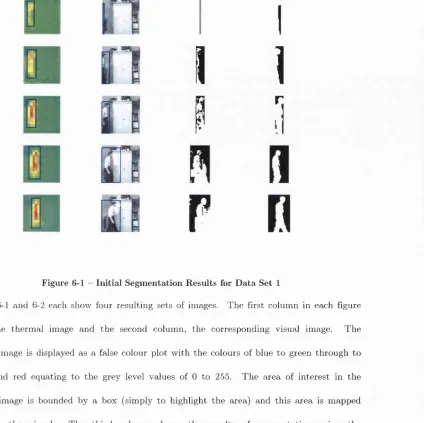
Fig u r e 6 -1 In i t i a l Se g m e n t a t i o n Re s u l t s f o r Da t a Se t 1 ... 12 7 Fig u r e 6 -2 In i t i a l Se g m e n t a t i o n Re s u l t s f o r Da t a Se t 2 ...128
Fig u r e 6 -3 In i t i a l Se g m e n t a t i o n Re s u l t s f o r Da t a Se t 3 ...128
Fig u r e 6 -4 Se g m e n t a t i o n o f Da t a Se t 1 w i t h o u t u s in g t h e Th e r m a l In f o r m a t i o n int h e M R F ... 129
Fig u r e 6 -5 Se g m e n t a t i o n o f Da t a Se t 2 w i t h o u tu s in g t h e Th e r m a l In f o r m a t i o n int h e M R F ... 129
Fig u r e 6 -6 Se g m e n t a t i o n o f Da t a Se t 3 Wit h o u tu s in g t h eTh e r m a l In f o r m a t i o ni nt h e M R F ... 130
Fig u r e 6 -7 Se g m e n t a t i o n o f Da t a Se t 1 u s in gt h e Op t i m a l Pa r a m e t e r s...131
Fig u r e 6 -8 Se g m e n t a t i o n o f Da t a Se t 2 u s in gt h e Op t i m a l Pa r a m e t e r s...131
Fi g u r e 6 -9 Se g m e n t a t i o n o f Da t a Se t 3 u s in g t h e Op t i m a l Pa r a m e t e r s...132
Fi g u r e 7-1 Re s p o n s eo fa Th e r m a l Pix e la sa n Ob j e c t Pa s s e si n Fr o n t o fi t...135
Fi g u r e 7 -2 Tr a n s i t i o n St a t e Di a g r a m s h o w i n g t h e Lin k sb e t w e e n St a t e s... 13 7 Fi g u r e 7 -3 Se q u e n c eo f Im a g e s Sh o w i n g t h e Re s u l t so ft h e H M M An a l y s i s... 13 9 Fig u r e 7 -4 Se q u e n c eo f Im a g e s Sh o w i n g t h e Re s u l t so ft h e H M M An a l y s i s...140
Fi g u r e 7 -5 Se q u e n c e Sh o w i n g t h e Se g m e n t a t i o n d u et o t h e H M M a n dt h e Tr a i n e d H M M 145 Fi g u r e 7 -6 Se q u e n c e Sh o w i n gt h e Se g m e n t a t i o n d u et ot h e H M M a n dt h e Tr a i n e d H M M 146 Fi g u r e 7 -7 Se q u e n c e Sh o w i n gt h e Tr a i n e d H M M Se g m e n t i n ga Co l d Ob j e c tw i t h a Wa r m Sh a d o w... 148
Fig u r e 8 -1 Se g m e n t a t i o n o ft h e Ar e a o f In t e r e s t a s De t e c t e db y t h e Th e r m a l Ca m e r a...152
Fi g u r e 8 -2 Se g m e n t a t i o n o ft h e En t i r e Im a g e...153
Fi g u r e A -1 Bl a c k b o d y Ra d i a t i o n Cu r v e sf o r Di f f e r e n t Te m p e r a t u r e s... 18 3 Fi g u r e A - 2 Ab s o r p t i o n Ba n d s o ft h e In f r a r e d Sp e c t r u m... 184
Fi g u r e A - 3 A Ph o t o n De t e c t o r...186
Fi g u r e A - 4 Th e Py r o e l e c t r i c Ef f e c t...1 8 7 Fi g u r e B -1 Ge o m e t r i c a l Co n s i d e r a t i o n so ft h e Pi n h o l e Ca m e r a Mo d e l in 2 Di m e n s i o n s ( Y = 0 ) . . 191
Fi g u r e B - 2 Pa r a l l e l Ca m e r a Ge o m e t r y... 196
Fi g u r eD-6 Th e r m a l a n d Vis u a l Im a g e so ft h e Ba c k g r o u n d...213
Fi g u r e D-7 Hi s t o g r a m so ft h e Th e r m a la n d Vis u a l Ba c k g r o u n d Im a g e s...214
Fi g u r e D-8 Jo i n t Gr e y Le v e l Hi s t o g r a m (n ot a r g e t) ...214
Fi g u r e D-9 Po o l e d Jo i n t Gr e y Le v e l Hi s t o g r a m (n ot a r g e t) ...215
C hapter 1
Introduction
“We shall know that we have solved the problem o f computer vision, if our system can come up with answers like 'This is a green cow with 5 legs’. ” [Petrou 99]
Security surveillance is an ever-expanding industry as more organisations feel th e need to
protect their interests. U nfortunately, despite th e num ber of research groups working on or
w ith image processing techniques and algorithm s, the same problems keep occurring. These
are associated w ith the need for any surveillance system to be tolerant to environm ental
changes as well as being able to intelligently interpret a scene and distinguish between those
activities which are illegal, or potentially so, and those which are not. F urther, intelligent
surveillance systems all have the same problems of needing to create an alarm at th e right
point. If th e false alarm rate is high, then th e system becomes redundant. Similarly, if the
system is not sensitive enough then th e system is again m ade redundant. Currently, the
m ajority of surveillance systems have a false alarm rate th a t is too high. T h at is, th e num ber
of false alarm s typically generated by current surveillance systems is sufficient to give rise to a
tendency for the system user to ignore all alarm states w hether tru e or false. It should be
noted however, th a t there will always be a trade-off between th e num ber of false positives and
the num ber of false negatives with the resulting danger of reducing th e num ber of false alarms
This thesis is based around the theory th a t the detection rates of security surveillance systems
can be improved by incorporating low-spatial resolution therm al data. W hilst th e visual
camera will be an off-the-shelf cam era w ith, initially a t least, a focal length of 25mm and an
array size of 756x574 pixels, the therm al array is of new uncooled infrared technology. The
therm al camera is based around a pyroelectric array: in its natu ral form this only detects
change, typically through m otion and tem perature. The array has a spatial resolution of
16x16 pixels and when using a 20mm focal length lens, has a depth of field of about 20
metres. The visual cam era has no such limitations. However, the effects th a t so often inhibit
the performance of visual only surveillance systems - namely environm ental changes - do not
affect the therm al array. F urth er, the cost of this array is at a fraction of th a t typically
associated w ith therm al cameras.
Unfortunately, using two cameras introduces problems. These involve developing an
approach to calibrating the cameras; the result of which is the ability to m ap points from one
image to the other. Then a means of fusing the d a ta needs to be explored. This thesis
develops a novel calibration methodology th a t allows for the disparity in spatial resolutions,
lens systems, and th e difference in modalities. A fusion algorithm is implemented based
around Markov R andom Fields which have been extended to incorporate th e therm al d a ta as
well as the visual for static images and extended further for use in motion. Finally a Hidden
Markov Model has been developed which classifies therm al pixels for improved extraction of
1.1
This Thesis
1.1.1 Research
This research is prim arily dealing w ith the use of two types of imaging equipm ent - a
conventional high-résolut ion visual cam era and a low resolution uncooled therm al detector.
The combination of the two imaging modalities will aim to improve current surveillance
technology by better locating and tracking people as well as categorising their behaviour. The
results of the research will be the proof-of-concept dem onstrations of the algorithm s and
components of the intelligent surveillance system. T he resultant system will be designed for
an outdoor environm ent, typically, a sterile zone w ith few subjects in th e image plane.
The promise of the two cameras in com bination is such th a t many of the environm ental
problems associated with cameras using th e visible spectrum in an outdoor scenario will be
significantly diminished. F urther, this will be achieved at a lower cost th a n would be
obtained with a higher spatial resolution therm al cam era and w ith, ideally, very little
difference in performance.
1.1.2 Developm ent of the Thesis
The structure of th e thesis is as follows.C hapter 1 - Introduction
Describes the m otivation for this project as well as previous and existing applications and
products. A project definition and synopsis of th e chapters is also given.
C hapter 2 - Sensor Fusion
Discusses sensor fusion and also introduces some of the concepts and algorithm s th a t have
C hapter 3 - C alibration Techniques
Explores current calibration techniques and their relative merits. It also explains why they
cannot be directly applied to this problem. A new methodology suitable for this application is
thus derived.
C hapter 4 - C alibration Results
Introduces the experim ental procedure and tests used in th e calibration process and the
results obtained. Conclusions are draw n as to the accuracy of the results and th e validity of
the calibration algorithm.
C hapter 5 - The Processing of Static Images
Develops the fusion algorithm involved w ith this work. Explores the results from this process
and draws conclusions about the effectiveness of the algorithm
C hapter 6 - Analvsis of M otion Sequences
Extends th e fusion algorithm developed in the previous chapter to motion sequences.
C hapter 7 - Im proving th e Detection of Objects within the Therm al Domain
Describes th e im plem entation of a Hidden M arkov Model to classify pixels in the therm al
image more accurately th an by using a simple thresholding strategy.
C hapter 8 -Conclusions and F u tu re W ork
Draws conclusions from the research and experim ental work carried out. Also suggests
1.2 M o tiv a tio n
In his review paper on surveillance issues, Massios [Massios 98] states th at;
There are at least two distinct difficulties involved in detecting relevant events;
1)
The relevant events have to be in sensor range2)
Once detected, the events have to he recognised as relevantMoreover, as D raper [Draper 96] states, the vision problem - being able to identify objects in a scene - is ill defined, requires immense com putation, and m ust operate robustly in widely
varying contexts and under varying illumination. This is an ability as natural to Man as
breathing. However, this inherent a ttrib u te has not, as yet, translated to com puter imaging.
T here has been no construction of a robust autonom ous com puter vision system other th an
th a t for constrained operating conditions. D raper further states th a t as an image is a record
of spatially sampled discrete approxim ations to the scene luminance - which varies as a
function of the incident illumination and viewpoint - it will be further corrupted or degraded
by occlusions, specular reflections, inter-reflections, atm ospheric conditions, lens distortions,
the norm al foreshortening effects of perspective projection and digitisation. He goes on to
suggest th a t in unconstrained domains it is impossible to develop an effective analytical model
th a t inverts or compensates for all of these effects [Draper 96].
Aggarwal [Aggarwal 99] also points out th e problems in designing an object recognition system th a t is functional for a wide variety of scenes and environm ents and is still as efficient as a
situation-specific device. However, both he and Isard [Isard 98b] recognise th a t this (the design of a generic object recognition system) is due to the complexity of the problem and the
fact th a t it (object recognition) involves processing at all levels of machine vision: low-level
processing (edge detection, image segm entation); mid-level processing (representation and
description of p attern shape, feature extraction) ; high-level processing (p attern category
functionality of a com puter vision system. Isard does in fact use this fusion of tw o levels of
d a ta successfully for th e ICONDENSATION algorithm. There he uses colour segm entation to
pick out skin coloured blobs from an image and then uses a contour tracker to follow th a t
object. However although this is application specific, the claim is made th a t this approach is
applicable to a more generalised sensor fusion problem of tracking an object in one m odality
using inform ation from another m easurem ent source.
In fact, D raper proposes th a t before a general-purpose vision system can be produced, there
m ust already be available the means to autom atically construct task specific control strategies
for image processing.
Security surveillance is becoming an integral p art of our lives. Closed circuit television
cameras (CCTV) are visible on the corners of most shopping centres and car parks, in fact
wherever it is deemed appropriate for security and safety reasons.
The main problem w ith CCTV is th a t of monitoring. T h a t is, the problem of employing staff
to m onitor several screens a t once - or worse still, one screen flickering between different
camera views - in th e hope of catching some pre-defined activity be this criminal or simply
one relevant to personal safety. W ith th e average concentration span of less th a n 15 minutes,
even the most diligent of workers would be hard pressed to process all th e information in
front of him continuously over the period of their shift.
T here is, therefore, a need for th e better m anagem ent of CCTV systems and hence, to
improve crime detection and prevention. Section 5(2) of T he Crime and Disorder Act 1998
[Card 98] states th a t there is a requirem ent for the com bination of forces (typically th e police
and local authority) to combat crime. A lthough observation through th e medium of CCTVs
proposition to com bat crime and reduce the workload on an already over-stretched police
force.
As indicated by th e Sira Conference “Collaborations for Success in Sensors and Sensory
Information Processing” held in 1998 (with unpublished proceedings), the present position is
th a t the current deployed systems are relatively "dumb" as they are price driven and not
performance driven. However, C CTV is relatively popular w ith th e public, and th e UK is
strong in the development and application of surveillance systems.
At the same conference it was stated th a t th e typical CCTV images created by current
systems are such th a t the categorisation of even basic objects (e.g. hum an or model,
male/fem ale etc.) can be difficult. Hence developments are required in the:
1) Quality of images,
2) Cueing and event filtering,
3) D ata fusion and image processing, and
4) Inform ation storage and management.
There is also a need to build up a "best practice" approach to cam era positions and lighting.
However, there are other issues th a t need to be addressed. These include affordability of a
system; the intelligence of a system in th a t if an event has been flagged as being of interest is
it clear to the operator why this has been flagged. T here are also issues involved w ith the
storage of information and th e related issue of retrieval for incident accountability. Not least
there are hum an rights issues involving the d a ta protection act.
An interesting side point is th a t due to th e spatial resolution of the therm al cam era it is a
non-intrusive detection mechanism. T h a t is, there is no way of identifying the person or
object in the image by the therm al image alone. There is m ounting concern over the number
watching. Not only in the sense th a t the operators should be ever vigilant but also th a t they
are not watching th a t which they shouldn’t (such as w atching for indiscreet behaviour being
carried out by members of th e public who are known to the operators). There are also
feelings am ongst sections of th e public of a loss of privacy due to th e proliferation of cameras
as well as concerns th a t there is no means of watching th e w atchers [Brin 98]. These topics
are merely noted here but the interested reader is pointed to David B rin’s book The Transparent Society [Brin 98] for an exposition on how society could adapt to technological advances such as surveillance systems.
T he Police Scientific Development B ranch (PSDB) has investigated one of the theoretically
easiest applications of security cameras: looking at sterile zones. These are areas between two
perimeter fences. Nobody is allowed between the fences, so it should be easy to detect
intruders. Yet the m ajority of the systems tested by the PSDB give unacceptably high false
alarm rates. These are generally caused by environm ental changes.
So, any surveillance system th a t is being produced m ust be useable. In the age where
financial resources available for crime fighting are declining, a lot of money is being spent on
lower paid staff using high-technology equipm ent which can and will create problems. One
solution is to use “more intelligent” equipm ent. It is, however, im portant not to sell
technology for technology’s sake. A low-cost solution m ight not be as "good" in the
technology stakes as another im plem entation, bu t it might be b etter in th e reduction of crime.
Similar work has been carried out by Verlinde et al [Verlinde 2000]. Here they attem p t to solve the problem of autom atic verification of a person. Applications include control access to
restricted (physical and virtual) environm ents [Verlinde 2000]. Typical examples include secure
tele-shopping, withdraw ing cash from A T M ’s (A utom atic Teller Machines) etc. C urrent
approaches typically only verify possession and knowledge (e.g. having the correct personal
biometrics for identification purposes is emerging. Biometrics characterise or measure
personal attrib u tes such as voice, face, gait analysis, eye (iris-pattern, retina-scan), finger
prints, etc. These are popular because they ca n ’t be forgotten and are really personal which
makes it harder for fraudulent use. However, more th an one biometric measure is typically
required due to th e tem poral variation in each of the characteristics and measurements.
Verlinde uses d different experts in a parallel fusion scheme. An expert provides a decision based on one particular biometric. A m ulti-dimensional classifier then combines all the
decisions.
In this application, as w ith surveillance, there is a requirem ent for th e m inim isation of errors.
Verlinde recognises th a t there are two types of error [Verlinde 2000];
False Rejection (FR) - when a client is rejected as being an im postor, and
False Acceptance (FA) - when an im postor is accepted as a client.
They further define the overall error rates as
False Rejection R ate (FR R) = num ber of F R s/num ber of client accesses
False Acceptance R ate (FAR) = num ber of F A s/num ber of im postor accesses
And an overall error rate as
T otal E rror R ate (TER) = (num ber of FA 4- num ber of F R ) /to ta l num ber of
accesses
T otal Success R ate (TSR) = 1 - T E R
However, they do recognise th a t care should be taken when using either T E R or T SR as they
will be biased if the FA or F R are high. F urth er, th a t the T E R will always be closer to the
rate for th a t type of error (FA or FR ) which has been obtained using th e larger num ber of
accesses [Verlinde 2000].
to cope w ith the numerous challenges th a t this would bring. The approach to A utom atic
Target Recognition (ATR) th a t is outlined in this paper involves th e construction of a
statistical background model using a set of tex tu re filters [Messer 99]. These filters are
designed using Principal Component and Independent Component Analysis on randomly
sampled sections of training data.
Oliver [Oliver 98] also recognises the im portance of a low false alarm ra te in his paper, which
describes the development of a system to detect and classify interactions between individuals.
He also states th a t it is possible to achieve a very low false alarm rate whilst still m aintaining
good classification accuracy on all targeted behaviours.
1.3 P r e v io u s Work
Previous work in this area carried out at the C entre for T ransport Studies at UCL has been
aimed mainly a t quantifying the use of confined spaces by people on foot and detecting
unusual features of such use. Research has also been carried out on the estim ation of speed
and direction of traffic flow using image processing techniques [Zhang 95]. It is now being
directed tow ards improving the safety of railway stations in out-of-the-way areas and late at
night, but using only visual imaging. The use of other modalities is not discounted though.
So far very little work has been carried out in th e field of the fusion of infrared and visible
images. However, w ith the reduction in cost of therm al imagers and a large interest in the
academic and commercial sectors in d a ta fusion, more work is being carried out in this area.
There is, though, a plethora of visual image processing packages available on th e m arket, from
optical character recognition to sophisticated surveillance software. Some of the surveillance
software available is described by Young [Young 97a]. F u rth er to these products are the
Passwords [Passwords] was developed by a European consortium of companies and academics in response to vandalism and crime in m etro stations. The direct expense caused by
vandalism typically runs into tens of thousand of pounds each year. The indirect costs are
th e loss of passengers due to th e feeling of insecurity brought on by the vandalism. The
processing system was designed to run on a Pentium II platform w ith a processing speed of 5
seconds for each frame. The later version of Passwords, R T P W , the speed was to increase to
between 1 and 3 images per second.
CROM ATICA ([Deparis 96], [Cromatica]) was designed to view, and hence control, pedestrian flow in large enclosed spaces such as interchange stations. In this respect, it was designed to
detect crowd incidents and reduce delays, collect and analyse crowd densities and flows, to
reduce the am ount of tim e spent on public transport journeys as well to increase the level of
security by autom atic incident detection.
Video Tracker [Primary] is a video m otion tracker which has had good reports on i t ’s functionality. The tracker, unlike m any of its com petitors, has good discrim ination between
hum an movement and environm ental changes th u s reducing the false alarm rate. T he success
of this product is shown in the clients who have now installed Video T racker on their
premises, this includes an installation a t the infamous Klong Phem Prison in Thailand.
ASSET-2 [Smith 95] is designed to detect and track vehicles. A slightly different application to th a t which is being proposed, but th e end product has been used successfully on infrared
images. It can also successfully find and track m ultiple objects in an image field with little or
no cam era calibration.
The Profile system created by Zeda-abm ([BBC], [Zeda]) is a face recognition system th a t uses the size and location of facial features (i.e. eyes, nose, m outh etc.). Due to the uniqueness of
using such a relationship is th a t th e cranial structure changes very little after physical
m aturity is reached in the teens. Zeda-abm claims th a t disguises are of little use as they
rarely disguise th e salient features. F urther, th e face does not need to be frontal or even of a
good pictorial quality. Six-month trials have been carried out by Tham es Valley Police with
some success. However, before the system can be used, a facial m ap needs to be created of
every person in the existing photographic database. Zeda-abm already has a strong world
wide police customer base w ith its m any security related products which also include a photo-
fit system th a t can used w ithin the Profile set-up.
These software packages are, however, not th e limit of technological advancem ent in the area
of visual surveillance. Numerous research groups throughout the W orld are looking at ways
of detecting people in unconstrained environm ents, tracking them and analysing their
behaviour.
Model-based tracking systems are popular. Leeds University uses active shape models in two
dimensions and 3-D geometric models are used by Reading. These two universities have
combined their respective systems to create A n Integrated Traffic and Pedestrian Vision System [Remagnino 97]. The system has been able to autom atically analyse and describe simple image sequences such as those obtained from CCTV coverage of car parks etc.
However, initialisation of the system and detection of new objects entering th e scene is
through m otion - i.e. change firom an established background image. T he background image
- against which each new image is com pared - is updated using a tem poral m edian filter
[Remagnino 97].
Active Shape Models and Active Contour Models have been applied successfully as tracking
algorithm s by numerous research groups [Blake 95, Cootes 94, 95, Fenster 00, Ivins93]. These
[Ivins93]. However, some means of selecting th e general area w ithin the image to apply the model is required.
1.3.1 Background Representation
A n algorithmic analysis o f digital image sequences attempts to interpret changes between consecutive image frames. A n im portant starting point fo r such interpretation attempts is the hypothesis that observable interfram e differences should be attributed to relative m otion between the image sensor and objects in the scene [Hsu 82].
T here are a num ber of approaches to constructing th e background representation of an image
scene. The simplest is to subtract a reference image from th e current image - i.e. Change
D etection [Bichsel 94, Hsu 82, Rosenfeld 81, Rosin 95, 97, Sshoo 87, Stringa 00, Young 97, 98]. Only those things th a t have changed will be highlighted. However, in unconstrained environm ents
once th e lighting changes due to, perhaps a change in cloud cover, the m ajority of the image
will be highlighted. A simple approach to remove this problem is to continuously update the
reference image. Bichsel has created an illum inant invariant operator th a t essentially uses a
low-pass filter to remove the high-frequency com ponent of th e original image. These high-
frequency com ponents are then isolated from the image and form the illum inant invariant
image [Bichsel 94]. A lternatively (or perhaps in com bination) a thresholding strategy can be applied. This can be a single value applied to the entire image in much the same way as the
M axim um Likelihood E stim ate is applied in a M arkovian segm entation technique. Or a more
adaptive process can be used such as Thresholding using Relaxation [Rosenfeld 81]. Sahoo
binarised image will depend heavily on the threshold set. Care is required in applying any
threshold on w hat is deemed to be significant grey level difference between two consecutive
frames. If this is set too high th en significant features m ay be removed; too low a threshold
and significant features are lost am ongst the noise [Hsu 82].
More complex approaches to change detection are tim e averages of images, adaptive Gaussian
estim ation or K alm an filtering to derive the background to be subtracted. W hile these
algorithms have been implemented for real-time applications they tend not to be robust and
often detect the leading and trailing edges of large objects as well as being subject to noise
effects and susceptible to small motion effects [Crimson 98]. There is, however, a danger of over pre-processing th e image. Bearing in mind th a t each stage will potentially discard
im portant information. Moreover, for this research segmenting the object is not a
requirement - there is already an algorithm developed for th at. So, for example, the work by
Stringa [Stringa 00], which uses statistical soft morphology before binarising the image, is outside the rem it of this work.
For the “Forest of Sensors” project at M IT, Crimson [Crimson 98] and Stauffer [Stauffer 1998]
report the creation of a robust detector th a t adapts to th e observed scene. By making each
pixel an independent statistical process, the observed intensity at each pixel can be recorded
over the previous n firames. This can then be optimally fitted w ith a m ixture of K Gaussians, thus reflecting th e expectation th a t samples of the same scene point are likely to display
normal noise distributions and th e expectation th a t more th a n one process may be observed
over tim e [Crimson 98]. The results are impressive, it does track objects in real-tim e in an unconstrained environm ent and appears to be tolerant to lighting changes, long-term scene
changes etc. F urther, different types of images have been used - not ju st grey scale - such as
RGB and HSV. However these are achieved using a Silicon Graphics m achine which is out
Using a SG 02 machine, com putational speeds of 11 to 13 frames (of 160 by 120 pixels) per
second were achieved.
McKenna and others a t Queen M ary College have also used m ixture models to track groups
of people in colour and have extended this work to model simple interactions between
individuals/ groups of people and objects [McKenna 00, McKenna 99, Raja 98].
W ork carried out by th e Vision and Robotics L aboratory in Kings College London for the
CROM ATICA project has produced an application th a t can accurately construct the
background of an indoor scene (Liverpool Street Tube Station, London) [Davies 95, Departs 96].
By using a statistical estim ation approach, foreground objects can be removed from the scene.
An accurate representation of the (static) background is then achieved. This, however, has
only been used in semi-controlled lighting conditions (i.e. indoors).
Meanwhile Young [Young 97b, Young 98] has compared various techniques used for change detection in image sequences. Change occurs when corresponding pixels in the two images
have sufficiently different intensities [Rosin 95]. It is, however, difficult to quantify w hat is significant. Low-level change techniques need to discrim inate between those changes which
are significant and those which are not. Hence, th e techniques need to differentiate between
illum ination change and changes in the scene. F urth er, there is also the need to consider the
spatial neighbourhood of a pixel since tem poral differences alone contain no information
regarding the causes of change [Young 97b].
1.3.2 Image Analysis using Infrared
Image analysis in th e infrared seems to have been limited to astronom ical research and
defence purposes w ith the emphasis on high-spatial resolution imagers rather th a n more
(typically infrared and visual), past research seems to have been more intent on th e analysis
of individual pixel values within the therm al image as opposed to th e image itself. Even with
th e ever-decreasing cost of therm al imaging equipm ent, the work in this area (therm al image
analysis) is alm ost non-existent.
Like visual images, therm al images are represented as an intensity m ap typically in 8-bit or
16-bit grey-scale or colour (RGB) representation. To th a t extent th e image processing th a t
can be carried out on the visual image can also be carried out on th e therm al. This project
will typically be dealing with 8-bit grey-scale images.
The pixel intensity in an image is proportional to the q uantity of therm al energy lying in the
infrared spectrum and coming from the corresponding point in the 3D scene [Caillas 94]. This energy is generally the sum of two components; (1) radiant energy due to the self
emission of objects - Eraj, and (2) radiant energy reflected or transm itted by objects due to
external radiation sources - T he radiant energy received by an optical system allows the
recovery of the physical properties of th e surface of th e object. U nfortunately, the
determ ination of th e origin of is not possible if we only know th e pixel intensity. This
essentially means th a t w ithout knowing th e tem perature of objects w ithin a scene â priori,
there is no way of knowing th e effect each object has on the overall pixel intensity. In
particular, is directly related to the tem perature of th e surface by th e well-known
Stephan-B oltzm an law [Caillas 94].
The objects being observed by the optical system can be categorised as either th e target or
the background. The target is the object to be detected by th e sensor: it m ust be
distinguished from the background sources. The background consists of all radiation sources
received by the detector, excluding the object of interest. Hence, th e background can be
There has been an extensive am ount of work on th e calculation of background radiation and
how to account for its effects on therm al images [Kruse 97, Nand 87, Nand 88, Pau 83, Seyrafi 93].
This has led to the creation of algorithm s and tables approxim ating the am ount of
background radiation inherent in different m aterials such as concrete, grass, etc.. There are,
however, lim itations to some of the algorithm s created. For example, th e approach
undertaken by N andhakum ar and Aggarwal [Nand 88] is limited to outdoor scenes th a t are illum inated by bright sunlight. F urther, Black [Black 94] uses the same algorithm bu t w ith the assum ptions th a t it is daytim e, cloudless and imaged using a parallel projection (from
above) and there is no illum ination from reflected or scattered light. This typifies the
attitu d e taken by similar research in this field.
P au [Pau 83] takes a more helpful attitude. It suggests th a t when there is no available d a ta for the background radiance, two m ethods can be used to model it. One m ethod in particular
is of interest. This is a statistical background representation which can be used for
exemplifying simple scenes. It uses P lanck’s equations to calculate th e background radiance
from th e probability distributions of the position and tem perature of the point of interest.
One application of therm al image processing th a t has been found involves low-resolution
photo-sensing units to calculate pedestrian flow w ithin corridors [Mudalay 79]. It was found th a t the device could provide a pedestrian count to at least 95% accuracy cheaply, reliably
and inconspicuously. This latter property is quite im portant, as hum ans tend to object to
being controlled or observed and also display enormous curiosity tow ards unfamiliar objects
1.3.2.1
Existing IR Systems
The m ajority of products are either cooled therm al cameras, typically for m ilitary
applications, or uncooled therm al imagers which were developed for the m ilitary m arket but
have now moved into the commercial sector. B oth have reasonable spatial resolutions
(typically 320x240 pixels). Due to the reduction of m ilitary m arkets, other applications for
therm al imaging are being exploited. These include, fire detection, industry specific
applications - such as detecting hot spots on electricity pylons - and security applications.
The m ajority of the uncooled systems are similar in size to a video cam era and as such -
especially w ith the therm al resolution currently available - extremely useful. However, it
seems th a t the image processing techniques prevalent in th e visible imaging systems currently
available, are not being transferred across to therm al systems. In one case, the instance of a
hot spot appearing on the screen was enough to cause an alarm state. Moreover, th e cost of
these systems is still quite high, about £10,000 for a hand held therm al camera. The
emphasis at th e m om ent is to sell high resolution (both therm ally and spatially) cameras a t a
significantly lower cost th an th e cooled cameras. This thesis will not involve the use of these
high resolution cameras, instead a low resolution cam era will be used. As has already been
mentioned in the earlier p arts of this chapter, very little work has been conducted in the
fusion of the two imaging modalities. W hat little work has been done is concerned with
m ilitary applications rather th an commercial.
1.4
Conclusions
There is a wide variety of therm al imaging equipm ent currently available. This varies from
expensive, cryogenically cooled, high resolution to cheap (relatively) uncooled lower resolution
detectors. Typically the therm al equipm ent used for image processing has had high spatial
resolution and the images have all been taken in near perfect conditions. This is not a luxury
conditions and under the constraint of low spatial resolution in th e therm al camera. The fact
th a t w hat work has been carried out has been accomplished w ith cooled therm al arrays is
interesting, but doesn’t detract from th e validity of the work carried out in this study.
R ather, it enhances th e potential novelty.
The literature surveyed within this chapter is not intended to do justice to th e whole range of
publications available on therm al imaging, bu t rath er to focus on papers th a t deal w ith the
fusion of visual and therm al. However the review is sufficient to indicate th a t the processing
th a t is typically carried out seems intent on th e categorisation of objects through the
calculation of radiance models th a t are calculated from the pixel intensity. Due to th e spatial
resolution of the therm al cam era considered here, this is not an available approach for this
study. It is also indicated th a t th e fusion of infrared and visible images is an untapped
resource and a valuable method of scene analysis. Therm al imaging for surveillance purposes
is still in an embryonic stage w ith the new uncooled cameras being used, typically, to detect
heat sources for industrial applications. These include finding hot spots on wiring, friction
points etc.. T he security applications are equally limited, more for the detection of fires
within buildings th a n illegal hum an activity. Thus, no products have been found th a t use the
two modalities in com bination, although interest is being generated in this area w ith the onset
of cheap uncooled infrared detectors.
Similarly there is far more published research on surveillance techniques using image
processing th an has been cited in this chapter. There is a vast am ount of ongoing research on
the inter-related topics of autom atic targ e t recognition, behaviour modelling and
classification, and background representation. Again th e fact th a t no one system has been
adopted is an indication of the difficulty of the problem and perhaps th a t a new approach is
W hilst the algorithm s developed w ithin this thesis do not provide a panacea for all difficulties
w ith surveillance systems, this study encourages th e view th a t inform ation content is far more
im portant th a n the am ount of data. F urth er, th a t by combining two imaging sensors of
vastly disparate spatial resolutions th e analysis of unconstrained environm ents can be
achieved. To th a t end, this thesis investigates w hether th e segm entation of surveillance
images can be improved by fusing low-spatial resolution therm al d a ta w ith high-spatial
resolution visual information. The context of th e investigation is the surveillance of sterile
zones where an alarm is required should a person enter th e zone and at no other time. The
aim is to reduce false alarms due to changes in environm ental conditions and wildlife
Chapter 2
Sensor Fusion
Sensor Fusion - th e process of combination of autonomously gathered observations from
numerous sensors into a single coherent source of information.
Sensors are devices th a t collect d a ta from the world around us; w ithout sensors there would
be no data. Thus throughout this chapter the term s Data Fusion and Sensor Fusion are used synonymously.
2,1
In tro d u ctio n
Sensor fusion is the joining of d a ta from m ultiple sources of information. At a practical level,
sensor fusion is the technology th a t allows us to collect d a ta through m ultiple sensors, thereby
enabling us to increase our knowledge, its accuracy and th e confidence w ith which it may be
applied [Oakley 96]. For this application some sense of merging inform ation will be required to
combine the disparate images th a t will be obtained of a scene.
Thus far, fusion techniques for therm al and visual sensors seem to have revolved around the
to provide inform ation about absorptivity and relative orientation of the viewed surface which
is required for the correct estim ation of th e surface heat fluxes. T o this end the therm al
equipm ent has had high spatial resolution and th e images have all been taken in near perfect
conditions. This is not a luxury available to this project. The fusion process will need to be
able to work in all w eather conditions and under th e constraint of low spatial resolution in the
therm al camera.
Sensor fusion is not th e only approach th a t has been advocated for improving current object
recognition/ image processing systems. O ther work th a t has occurred due to the realisation of
the inadequacy of the single-pass strategy of the hypothesis-veri^ paradigm , is the
development of feedback control strategies [Mirmehdi 88]. Again, th e aim of this approach is
to com bat the difficulties of poor d a ta and th e link between weak features and weak
hypotheses. To meet this aim, feedback strategies for more robust hypothesis generation are
proposed [Mirmehdi 88]. However, although this technique could be adapted for multi-sensor
purposes, any system so devised would not be fully utilising the inform ation available and
therefore, although being superior to a single cam era system, would not be advantageous to
use in this instance.
For an in-depth analysis of not only sensor fusion techniques and applications bu t also fusion
strategies, the books by Brooks [Brooks 97] and Abidi [Abidi 92] are highly recommended. This chapter is not designed to replicate th e work described w ithin these books and a condensed
form would not do this vast subject area justice. For th e interested reader th e papers by Pohl
[Pohl 98] and W ang [Wang 00] describe the basic concepts, potential applications, approaches and performance evaluation techniques of m ultisensor fusion for purposes of image analysis.
Sensors are devices th a t collect d a ta from th e world around us. There are numerous kinds of
devices and ways of recording sensor observations. These range from inexpensive cameras to
inevitably, are inherently unreliable as they each have a limited accuracy, are subject to noise
(to some degree) and will - under certain circum stances - either function incorrectly or fail
entirely.
T he disadvantages of using a single sensor system lie w ith uncertainty ra th e r th an
imprecision. This uncertainty can be due to missing features (for example, occlusions), un
explicit observations and sensor restrictions (e.g. you can ’t use a video cam era for radar
purposes). Moreover, as M urphy [Murphy 96] states, while missing observations can be compensated for by active perception techniques, a different view may not make up for
incomplete or ambiguous observations. These problems can be removed by using a sensor
fusion strategy.
Using multiple sensors has the advantages of;
Redundancy => by using m ultiple sensors a system can cope w ith individual sensor failure.
Combination => m ultiple m odality observations can be used to infer features in an
environm ent th a t would be unobtainable using a single sensor. Moreover, by using
m ultiple sensors a system can often become less sensitive to noise and tem porary
“glitches” [Brooks 97].
Cost => several cheaper sensors integrated into a system can often provide a superior system
th an th a t of a single more expensive sensor.
U ltim ately, sensor fusion should combine inputs from m any independent sources of limited
accuracy and reliability to give inform ation of known accuracy and proven reliability [Brooks 97]. Also, as Abidi [Abidi 92] comments, the fusion process could involve a single sensor over an extended tim e period as opposed to m ultiple devices taking simultaneous readings.
However, ju st because a single sensor system isn’t working to requirem ents, m ultiple sensors
w hether th a t sensor is stand-alone or p art of a network. Im portantly, no m atter w hat system
is being implemented it m ust produce a correct decision on a sufficiently large num ber of
occasions. To make this decision, regardless of anything else, th e system m ust be well
informed and react in a tim ely manner. The larger th e quantity of information, th e longer
th e com putational time.
K adota [Kadota 94] also recognises the potential problems of using m ultiple sensors as a
universal remedy for all system difficulties. He recommends th e development of some rational
m ethod of calculating performance im provem ent th a t will occur (or not) as a result of d a ta
fusion. As he points out, even if the im provem ent in performance is substantial, th e cost of
th e integration may not justify it. However, in his conclusions he points out th a t for a pair of
com plem entary systems, integration is w arranted if neither system meets th e minimum
requirem ent of detection performance and resolution bu t the combined system is able to do
so.
In M urphy’s paper on the biological and cognitive foundations of sensor fusion [Murphy 96],
she discusses the requirem ent for a sensor fusion system to be able to adapt to, or at worst
case, degrade gracefully under given typical sensor problems (for example continuous sensor
errors or complete sensor failure), as well as unexpected environm ental changes. Hence, the
functionality of a sensor fusion system should include th e context of th e intended task and the
influence of the environment on th e sensing.
W hile research on d a ta fusion algorithm s has m atured into a field of its own [Ng 00], there is
increasing interest in Sensor M anagement (SM) [Bossé 00, Kokar 01, Ng 00]. This has evolved out of th e need for multi-sensor systems to be entirely autonom ous and therefore be able to,
where required, prioritise and schedule tasks, make effective use of often limited resources and
perhaps most im portantly be able to reconfigure and support system degradation due to
outlined by M urphy , K adota and others. Sensor m anagem ent is, however, beyond the scope
of this research.
There are a num ber of different levels of abstraction th a t fusion can take place in. Luo (in
Abidi [Abidi 92]), has tabulated the more relevant differences between each of th e levels. Simply, symbol-level fusion merges locally m ade decisions (i.e. those m ade a t each individual
sensor); feature-level fusion merges th e param eters concerning features obtained from the
sensors; and pixel or signal level fusion is concerned w ith th e com bination of raw d a ta signals.
As is discussed in Brooks [Brooks 97] the higher the level of fusion th e smaller the am ount of information transm itted throughout the system. However, this also means th a t less
information is available to the decision making process. Thus, a t a lower fusion level more
informed decisions are possible due to th e increased level of detail available about an
environment.
2.1.1 Sensor Fusion Strategies
There are a num ber of fusion strategies th a t can be adopted for a given system. The more
common approaches are given below. O ther approaches th a t are not discussed are concerned
w ith decentralised and distributed detection fusion strategies. As their names imply, these
approaches involve sensors in different geographical locations often w ith some processing
occurring at each sensor. This is in the form of either compression of th e d a ta as is often the