Tornadoes in South Africa: An overview with a Case Study
Offoro N Kimambo1&2
1Department of Geography and Environmental Studies, College of Science and Education, Sokoine
University of Agriculture, Morogoro, Tanzania.
2School of Environmental Sciences, University of Venda, Thohoyandou, Limpopo, South Africa.
Corresponding email: Offoro@gmail.com
Abstract
This paper contributes to the understating of tornadoes in South Africa using case study analysis. In South Africa tornadoes are the recurring phenomenon (the climatology) but so far they have received less attention. Damages from storms itself (tornadoes inclusive) are significant in South Africa relative to other weather-related disasters for example floods, heat waves, and droughts. For their understanding, a case study approach was adopted in the current study. Data were in courtesy of the following, National Oceanic and Atmospheric Administration (NOAA), National Centers for Environmental Predictions (NCEP), Eumetsat Germany, and South African Weather Service (SAWS). The aim of the study was to provide an overview of the occurrence of tornadoes in South Africa using a Klerksdorp tornado, which occurred on March 4, 2007, Northwest Province in South Africa. From the case study analysis, the tornado was associated with the cold front and cut-off low (both are extratropical circulation) which were the dominant weather systems of the day. Therefore we conclude that, a case study approach may be the best way to study events of these nature for a more informed decision, for example, issuing an early warning system. In future, case studies, for example, involving interaction between extratropical and tropical circulation will also be an interesting study.
Keywords: Tornadoes; CAPE; Overview; Case Study; Klerksdorp; South Africa
1.0 Introduction
Tornadoes are rapidly rotating column of air that make contact with the ground (Bluestein, 2013). Recently, the American Meteorological Society (AMS) updated the definition of Tornadoes1 meaning
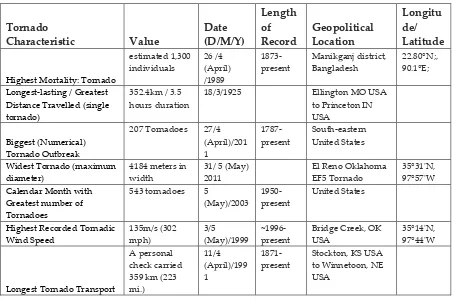
that still there is more development regarding understating of tornadoes and that also lead to the amendment of its taxonomy (Agee, 2014). The global perception of tornadoes events is that it occurs around (20-60) degree latitude in the southern and northern hemisphere (Figure 1). To further indicate the potentials for understanding the dynamics of tornadoes, a recent study (ASU, n.d.) highlighted and documented the word records for tornado characteristics (Table 1), much of damages happening in the northern hemisphere.
Principally, there are several ingredients for tornadoes such as, a deep layer of mid-atmospheric dry air above the moist surface, steep moisture and temperature gradient, high surface temperatures and vertical wind shear & atmospheric instability (Dean & Schneider, n.d.). In order for the tornado to occur, the first thing you need is a thunderstorm. With thunderstorm, you need a mass of unstable air (warm air mass below the cold air mass), the external force which mixes the air causing updraft and moisture. In the process of thunderstorm development, there is upward and sinking motions which causes lighting and thundery activities. In that process, thunderstorms are classified in to four (4) types including single cell, multicell cluster, multicell line and supercell storm (Blamey, Middleton, Lennard, & Reason, 2017). The multicell line is stronger than the first two in that series and can lead to hail as
1 http://glossary.ametsoc.org/wiki/Tornado
well as small tornadoes. The most violent is the supercell which is most likely to produce tornados. Several parameters can be used to measure thunderstorm development including convective available potential energy (CAPE), wind shear, above normal in surface and dew point temperatures (Simpson & Dyson, 2018).
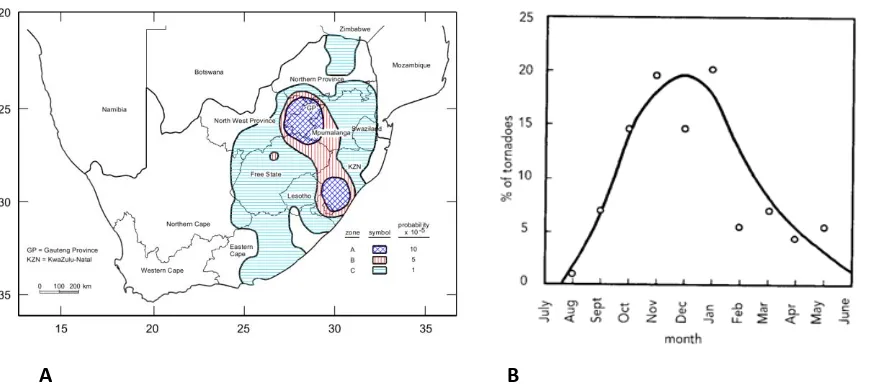
In South Africa, tornadoes are the recurring phenomena (Blamey et al., 2017; Fauchereau, Trzaska, Rouault, & Richard, 2003; Goliger & Milford, 1998; Kantamaneni, Alrashed, & Phillips, 2017) with an average of three tornadoes per year (Goliger & Milford, 1998). Mostly, tornadoes occur over eastern South Africa and they have a potential to severe damages and even loss of lives (Reason, 2017). The available history (Dotzek, Grieser, & Brooks, 2003) indicates that most of the tornadoes range from light to severe on the Fujita scale (F Scale)(Bluestein, 2013; NOAA, n.d.). This conclusion of tornadoes climatology in South Africa (Figure 2) was made by investigating tornadoes that had happened from 1905 to 2002.
It is estimated that the damages from storms (i.e. cut-off low, fronts, tropical cyclones, and tornadoes) amount to 800 million USD for a period of 1990 to 2014 (DEA, 2016) leave apart those related to floods, wild fires, and drought.
The study which investigated tornadoes in South Africa (Grobler, n.d.) argue that tornadoes are given less attention by media because of the localities (rural areas) but also nature of the loss (mainly crops and occasionally buildings). Therefore the use of a case study can amplify the perception but also prompt more scientific discussions aiming to increase awareness and even a better understanding of tornadoes impacts.
Tornadoes are associated with thunderstorm and lightning (Blamey et al., 2017). For example a study contributions of (Gijben, 2012)whichupdated the climatology of lighting in South Africa. The study demonstrated that much of lighting occurs over the interior to the northern interior of South Africa. The same study categorized the risk involved as extreme. (Gijben, 2012) also reported that South African Weather Service (SAWS) prior 2006 was unable to measure lighting activities over South Africa. This general conclusion can justify that level of awareness of synergies between weather systems. The same was observed by (Dyson & Van Heerden, 2002) who went for the development of a model for identification of weather systems over South Africa. In the process of development, somebody would wonder why work of (Gijben, 2012) could not recognize some previous studies (Goliger & Milford, 1998) which produced a map indicating areas of high chances of tornadoes, which are directly associated with lighting and thunderstorms.
In its annual report 2016/2017(SAWS, 2017)under public weather forecasting, for example, the years 2016 the South African Weather service issued a media release following the Tembisa tornado which occurred on the 27th July 2016 which left damages to Phumulani mall and a tertiary hospital in
Tembisa. Sympathetic with the effects associated with tornadoes the SAWS is intending to use the lighting detection network (LDN) in conjunction with tornadoes to develop a nowcasting tool.
Figure 1. Tornadoes around the world (Goliger & Milford, 1998 as cited from Fujita, 1973)
In South Africa, most tornadoes typically occur in the late afternoon or early evening (South African Weather Service, n.d.)
Table 1. Some of the world latest records on tornado characteristics (ASU, n.d.)
Tornado
Characteristic Value
Date (D/M/Y) Length of Record Geopolitical Location Longitu de/ Latitude
Highest Mortality: Tornado
estimated 1,300 individuals 26 /4 (April) /1989 1873-present Manikganj district, Bangladesh 22.80°N;, 90.1°E;
Longest-lasting / Greatest Distance Travelled (single tornado)
352.4km / 3.5 hours duration
18/3/1925 Ellington MO USA to Princeton IN USA
Biggest (Numerical) Tornado Outbreak
207 Tornadoes 27/4 (April)/201 1 1787- present South-eastern United States
Widest Tornado (maximum diameter)
4184 meters in width
31/ 5 (May) 2011
El Reno Oklahoma EF5 Tornado
35°31'N, 97°57'W
Calendar Month with Greatest number of Tornadoes
543 tornadoes 5
(May)/2003 1950- present
United States
Highest Recorded Tornadic Wind Speed 135m/s (302 mph) 3/5 (May)/1999 ~1996- present
Bridge Creek, OK USA
35°14'N, 97°44'W
Longest Tornado Transport
A personal check carried 359 km (223 mi.) 11/4 (April)/199 1 1871- present
Stockton, KS USA to Winnetoon, NE USA
Figure 2. Mean annual rate of occurrence of tornadoes excluding light ones (A) (Goliger & Milford, 1998; Goliger & Retief, 2007) and timing on the occurrences (B) in South Africa (South African Weather Service, n.d.)
The aim of the study was to provide an overview of the occurrence of tornadoes in South Africa using a case study. The choice of the case study was due to data availability and hands on practises during a professional course on weather forecasting.Specifically, the study wanted to answer the following questions (1) What is the properties of tornadic events in South Africa in terms of their impacts with reference to Klerksdorp tornado which occurred on March 4, 2007, and (2) How was it linked to other weather systems.
2.0 Data and Methods
Meteosat Second Generation (MSG) satellite data were ordered from Eumetsat, German, and processed using Software for the Utilization of Meteosat Outlook (SUMO) activities (Simpson & Dyson, 2018), for getting water vapor image (WV6.2 µm), the convective red, green and blue (RGB) and natural day color imagery (NIR1.6, VIS0.8 and VIS0.6). The use of MSG has demonstrated their potential to study thunderstorms activities (Reason, 2017) in tun possible as well to give an insight on tornadoes development. Radar Image, the observation was in the courtesy of South African Weather Service. For visualizations of weather systems we used geopotential height (m) , vertical velocity (i.e. omega in pascal/s) during the day of event (4 March 2007, 1200Z) and convective available potential energy (CAPE) (from the year 2000 until recent) over Southern Africa (Data and Images were provided by the NOAA ESRL Physical Sciences Division, Boulder, Colorado, USA, from their website at
http://www.esrl.noaa.gov/psd/). The CAPE data were reprocessed using Panoply software (https://www.giss.nasa.gov/tools/panoply/). For further visualization of the atmospheric condition during the event, we also obtained upper air sound data for Irene Station in Pretoria from the University of Wyoming (http://weather.uwyo.edu/upperair/sounding.html). And finally, surface analysis and observations (Klerksdorp) were in courtesy of South African Weather Service.
3.0 Results
In this section, we present two kinds of results for a better understanding of the event. First, results for upper air observation which includes processed satellite images (Meteosat Second Generation), radar images and National Centers for Environmental Predictions (NCEP) reanalysis for both
geopotential heights, vertical motions (omega) and convective available potential energy (CAPE) reanalysis. Second, we present data for surface analysis and surface analysis and observations. 3.1 Upper air Observations
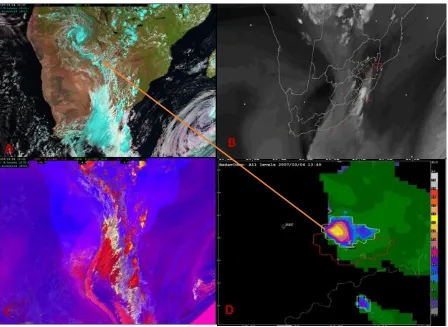
Figure 3. Day natural color ( Red Blue and Green) RGB (A); The upper-level tropospheric water vapor band (Water vapor Channel, 6.2 µm) (B); Convective RBG (C); Radar Image valid 4 March 2007 indicating echo region (ER) over Klerksdorp, South Africa (D). With exception of radar Image (courtesy of Irene radar), all other images were processed using SUMO Software and the (satellite data courtesy of EUMETSAT)
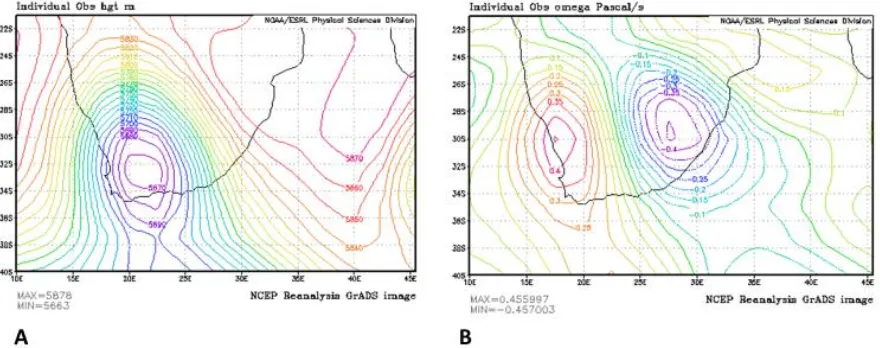
Figure 4. Geopotential heights (m) (A) and vertical velocity (omega) Pascal /s (B) both at 500 hPa level (B) (Images provided by the NOAA ESRL Physical Sciences Division, Boulder, Colorado, USA, from their website at http://www.esrl.noaa.gov/psd/ )
The findings dduring the day of the event indicate there was a cut-off low (at both 500 hPa) (Figure 4A). and to the east of the trough, there was an upward motion (omega) (Figure 4B) which is also an important feature in the formation of thunderstorm activities. The area of low geopotential height is also are matching Figure 3B which indicates the dark shades in the water vapor channel.
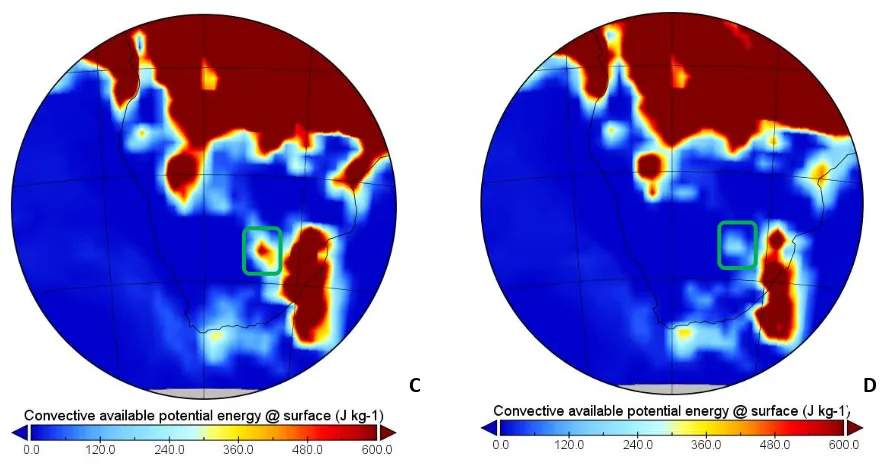
Figure 5. Convective available potential energy (CAPE) on March 42007 (area marked with green box shape) for different forecasts hours starting from 0900Z (A), 1200Z, deepening at around 1500Z (C) and clearing again in 1800Z(D) timing (Data provided by the NOAA ESRL Physical Sciences Division, Boulder, Colorado, USA, from their website at http://www.esrl.noaa.gov/psd/)
Figure 6. CAPE analysis for a period of 200 until recent overAfrica (north and south of the equator)
depicting the link between tropical and extratropical convective activities (Data provided by the NOAA ESRL Physical Sciences Division, Boulder, Colorado, USA, from their website at http://www.esrl.noaa.gov/psd/ )
Figure 6 indicates a reanalysis value of convective available potential energy (J/Kg) in over the African landmass from 2000 until recent. The link or extension of the CAPE values from the equator to the south is more pronounced than in the north, which can be explained by the interaction between extratropical and tropical weather systems (Dyson & Van Heerden, 2002). These annual variations of CAPE were also demonstrated in the study of (Blamey et al., 2017) on the climatology of potential severe convective environment in South Africa.
3.2. Surface Analysis and Observations
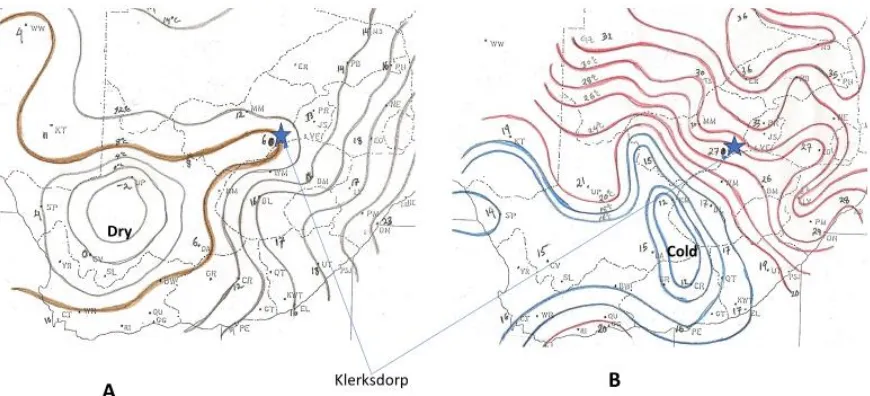
Figure 7. Author’s hand analysis of surface dewpoint temperature and air temperature (observation data and map in the courtesy of South African Weather Service)
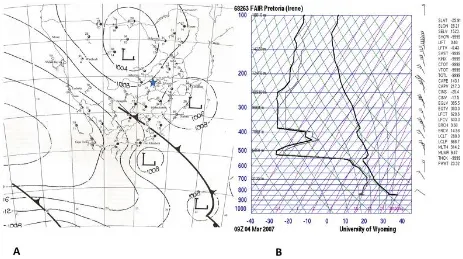
Figure 8. The synoptic chart on the 4th March 2007 (1400Z) (courtesy of the South African Weather
Service (A) and Upper Air Sounding for Pretoria-Irene station (Courtesy of the University of Wyoming)
Figure 9. Drop in temperatures, wind speed changes and rainfall at Klerksdorp (Data in the courtesy of South Africa Weather Service)
Figure 9 indicates drastic decreases in temperature, increases in wind speed from 5 knots to almost 22 knots and rainfall at around 3:55 to 4:25 PM local South Africa Time.
Temperature (˚C),
19.00
Wind Speed (Kt), 6.6
Rainfall (mm), 0.00 0.00
Figure 10. Four hours weather analysis for Temperature, wind speed, and Rainfall; at Klerksdorp. (Data courtesy of South Africa weather service)
From figure 10, at around 3:55 to 4:25 PM South Africa local time there was a change in wind direction (from southerly (S) component to North westerly (NW) and there after it maintained to south westerly (SW)) and pressure (increases).
Discussion
This section describes the results of Klerksdorp Tornado. The findings at least hints that, at the time of event there almost two weather systems dominating over the region which include the cut-off low and the cold front. This is an important observation that one would start thinking of. Another important finding was the presence of convective activities and ingredients (CAPE, vertical velocity east of the through (Figure 4B & 5) for the formation of a tornado.
Water vapor channel or sometime the upper-level tropospheric water vapour band (6.2 µm) is normally used to track upper tropospheric winds, identifying jet streams, forecasting mid-latitudes storms, monitoring severe weather potentials and estimating upper/mid-level moisture (i.e. vertical moisture profile) (Santurette & Georgiev, n.d.). From figure 3B. Over the west, it was dry (right from the surface (Figure 7A ) to the upper atmosphere) and toward the north and to the east there was enough moisture. Which is a good ingredient of the storms? The upper air observation (figure 7B) also indicate for example strong winds which can also be deduced from the water vapour channel. The demarcation of activities can also be sported in figure 3A, and the convective RGB (figure 3C). This is also supported by the updraft as can be depicted from the echo region in the radar imagery (Figure 3D).
From the Upper are sounding station (Pretoria Irene, 1200Z) (Figure 8B) the following indices were convective available potential energy (CAPE) was 142 J/ Kg which is marginally Unstable. If study by (Brooks et al., 2003) is adopted who used the logarithmic relationship (equation 1 below) between CAPE and shear for discriminating non and severe thunderstorm activities, based on CAPE the tornado event can be classified as the severe one.
-35 15 65 115 165 215 265 315 365 859 860 861 862 863 864 865 866 867
2:15:00 PM 2:25:00 PM 2:35:00 PM 2:45:00 PM 2:55:00 PM 3:05:00 PM 3:15:00 P
M
3:25:00 PM 3:35:00 PM 3:45:00 PM 3:55:00 PM 4:05:00 PM 4:15:00 PM 4:25:00 PM 4:35:00 PM 4:45:00 PM 4:55:00 PM 5:05:00 PM 5:15:00 PM 5:25:00 PM 5:35:00 PM
Pres su re (m m H g)
Time of the Day
Presure (mmHg)
𝐿𝑜𝑔(𝑆6) =(8.36−1.79𝑙𝑜𝑔(𝐶𝐴𝑃𝐸))
2.86 …….Equation (1)
Where S6 = 0-6 km shear (in m/s) and above that the phenomena is likely to be associated with severe thunderstorms. That is, from the CAPE Index above, substituting CAPE from the sounding (142 J/Kg) we end up getting S6 = 37.67 m/s which according to (Brooks et al., 2003) is a severe tornado. Mostly, South Africa weather is dominated by extratropical weather systems (i.e. cut-off lows, fronts, and ridging Atlantic high) and in the late summer an invasion of convective tropical weather systems (Dyson & Van Heerden, 2002). The connection form the tropics, for example, is well portrayed from the NCEP reanalysis data set for CAPE (timing from December 2000 to date, Figure 6) which indicates series of connection from the tropics to South Africa (more than 22°S latitude) but also as compared to some other previous studies (Blamey et al., 2017). Extracting the event (4 March 2007) as described in Figure 5, the results demonstrate the tornado was more associated with the frontal system and the cut-off low which were the persisting weather.
Understanding the principles and ingredients for the formation of tornadoes (i.e. enough moisture, instability, and the external force pushing the warm and moist air) but also a trend of tornadoes formation in the area (Goliger & Retief, 2007) is one tool that can discriminate the link between the tropical and extratropical circulations. Although studies already hypothesized and tested the argument that the synergies between extratropical systems and tropical systems (for example the tropical temperate trough (TTT)) and are mothering a severe weather system likes tornado (Reason, 2017). (Reason, 2017) indicated that the TTT can lead to a formation of deep mesoscale convective complexes.
Principally, a cold front is associates with a decrease in temperatures, increasing with speeds and showers of rain. Additionally in the southern hemisphere wind are south westerly behind the cold front and north westerly ahead of the cold front which is demonstrated on synoptic weather charts (Figure 8A). The same can be depicted from Figure 9 & 10 whichindicates changes in wind direction from southerly (S) component to north westerly (NW) component but also changes in pressure (increase) therefore the findings support the notion that it was a passage of a cold front over the station. Since most of the cold fronts are associated with thunderstorms, one can argue that the tornado over Klerksdorp on the 4th of March 2007 was the effects from the cold front.
Long term analysis of CAPE and deep-layer shear indicates that severe storms development over South Africa is during early summer (Reason, 2017). The study further highlights that late summer the circulation becomes more of tropical nature. From our case study and the facts from the analysis the remaining question that needs to be answered is that what is the nature of the destruction of tornadoes associated with extratropical and the one associated with tropical weather systems nature over south Africa.
Conclusion
although have been sparsely reported in other areas of the world. For future study, the fox can work to find out the recurrence nature of tornadoes over the northern province specifically the TTT, cold fronts, and orography nexus. Thanks that the South African Weather service has installed lightning detection systems which along with real time data such as observation, satellite, radar, and numerical modelling (forecasting) all together can assist tracking development and movement of severe thunderstorms which are responsible for tornadoes. These will provide a substantial impact on short term (now-casting) and long term (for example modelling) forecasts. The future consideration may be development or reviewing the building codes over the areas most affected by the tornadoes.
Data Availability
The data used to support the findings of this study are available from the corresponding author upon request.
Conflict of Interest
Authors declare no conflict of interest.
Acknowledgements
Thanks to South African Weather Service (SAWS) for data access and facilitation during the training. Thanks to Eumetsat (Germany) for providing Meteosat Second Generation satellite imagery data. I also appreciate efforts from Tanzania Meteorological Agency (TMA). Special thanks to Simpson L, & Coleen, R (all from SAWS) and Dyson L, (University of Pretoria) for their supports and guidance.
References
Agee, E. M. (2014). A Revised Tornado Definition and Changes in Tornado Taxonomy. Weather and Forecasting, 29, 1256–1258. https://doi.org/10.1175/WAF-D-14-00058.1
ASU. (n.d.). World Meteorological Organization’s World Weather & Climate Extremes Archive. Retrieved November 18, 2018, from https://wmo.asu.edu/content/world-meteorological-organization-global-weather-climate-extremes-archive
Blamey, R. C., Middleton, · C, Lennard, · C, & Reason, · C J C. (2017). A climatology of potential severe convective environments across South Africa. Climate Dynamics, 49, 2161–2178.
https://doi.org/10.1007/s00382-016-3434-7
Bluestein, H. B. (2013). SEVERE CONVECTIVE STORMS AND TORNADOES. Oklahoma: Springer. https://doi.org/10.1007/978-3-642-05381-8
Brooks, H. E., Lee, J. W., Craven, J. P., Brooks@noaa, H., Gov, H. E., & Brooks, ). (2003). The spartial distribution of severe thunderstom and tornado environments from global reanalysis data. Atmospheric Research, 67(68), 73–94. https://doi.org/10.1016/S0169-8095(03)00045-0 DEA. (2016). Climate information and early Warning Systems for Supporting the disaster risk
reduction and management Sector in South Africa under future Climates. Pretoria. Retrieved from
https://www.environment.gov.za/sites/default/files/reports/ltasbook2of7_climateinformation andearlywarningsystemsforsupportingtheDRR.pdf
Dotzek, N., Grieser, J., & Brooks, H. E. (2003). Statistical modeling of tornado intensity distributions. Atmospheric Research, 67(68). https://doi.org/10.1016/S0169-8095(03)00050-4
Dyson, L., & Van Heerden, J. (2002). A model for the identification of tropical weather systems over South Africa. Water SA, 28(3). https://doi.org/10.4314/wsa.v28i3.4892
Fauchereau, N., Trzaska, S., Rouault, M., & Richard, Y. (2003). Rainfall Variability and Changes in Southern Africa during the 20th Century in the Global Warming Context. Natural Hazards, 29, 139–154. Retrieved from
https://link.springer.com/content/pdf/10.1023%2FA%3A1023630924100.pdf
Gijben, M. (2012). The lightining climatology of South Africa. South African Journal of Science, 108(3/4), 10. Retrieved from
https://journals.sajs.aosis.co.za/index.php/sajs/article/view/740/1073
Goliger, A. M., & Milford, R. V. (1998). A review of worldwide occurrence of tornadoes. Journal of Wind Engineering and Industrial Aerodynamics, 74(76), 111–121. Retrieved from
http://citeseerx.ist.psu.edu/viewdoc/download?doi=10.1.1.863.2852&rep=rep1&type=pdf Goliger, A. M., & Retief, J. V. (2007). Severe wind phenomena in Southern Africa and the related
damage. Journal of Wind Engineering and Industrial Aerodynamics, 95(9–11), 1065–1078. https://doi.org/10.1016/J.JWEIA.2007.01.029
Grobler, R. (n.d.). A framework for modelling losses arising from natural catastrophes in South Africa. Pretoria. Retrieved from
https://repository.up.ac.za/bitstream/handle/2263/23749/dissertation.pdf?sequence=1 Kantamaneni, K., Alrashed, I., & Phillips, M. (2017). Cost vs. safety: A novel design for tornado proof
homes. HBRC Journal, 13(2), 223–232. https://doi.org/10.1016/J.HBRCJ.2015.05.004
NOAA. (n.d.). Appendix: Fujita Scale (or F Scale) of Tornado Damage Intensity. Retrieved November 21, 2018, from https://www.weather.gov/oun/tornadodata-okc-appendix
Reason, C. J. C. (2017, November 20). Climate of Southern Africa. https://doi.org/10.1093/acrefore/9780190228620.013.513
Santurette, P., & Georgiev, C. G. (n.d.). WATER VAPOUR IMAGERY ANALYSIS IN 7.3µ µ µ µ/6.2µ µ µ µ FOR DIAGNOSING THERMO-DYNAMIC CONTEXT OF INTENSE CONVECTION. Retrieved from http://citeseerx.ist.psu.edu/viewdoc/download?doi=10.1.1.629.6744&rep=rep1&type=pdf SAWS. (2017). South Africa Weather Service - Annual report 2016/2017. Retrieved from
https://nationalgovernment.co.za/entity_annual/1364/2017-south-african-weather-service-annual-report.pdf
Simpson, L., & Dyson, L. L. (2018). Severe weather over the Highveld of South Africa during November 2016. Water SA, 44(1), 75. https://doi.org/10.4314/wsa.v44i1.09