ISSN: 2319-8753
I
nternational
J
ournal of
I
nnovative
R
esearch in
S
cience,
E
ngineering and
T
echnology
(An ISO 3297: 2007 Certified Organization)
Vol. 2, Issue 10, October 2013
Preparation, Characterization and Mechanical
Properties of Al356.1 Aluminium Alloy Matrix
Composites Reinforced With MgO Nanoparticles
Girisha K.B
1, Dr.H.C.Chittappa
2.
Research scholar, Department of mechanical engineering, UVCE, Bangalore, India1
Associate professor, Department of mechanical engineering, UVCE, Bangalore, India2
ABSTRACT
:
In this research Aluminum alloy (Al 356.1) matrix composite reinforced with Magnesium Oxide Nano particle in the weight % of 0.5, 1.0, 1.5, and 2.0 %. Reinforcement process is carried out by stir casting method Microstructure and mechanical properties of Nano composites. The nanocomposites were characterized by scanning electron microscope (SEM) and X-ray diffraction (XRD). mechanical Test were carried out in order to identify the properties The results reveal that the composites containing 1.5 wt % reinforcement particle fabricated at 850o C have homogenous reinforcements of MgO in Al356.1 Tensile, wear properties and hardness strength also improved .Keywords: Metal matrix composites, Nano structured materials, MgO /Al356.1 composites
I. INTRODUCTION
Nowadays, demands for developing metal matrix composites for use in high performance applications, have been significantly increased [1]. Among these composites, aluminium alloy matrix composites attract much attention due to their lightness, high thermal conductivity, moderate casting temperature, etc. [2,3]. Various kinds of ceramic materials, e.g. SiC, Al2O3, MgO and B4C, are extensively used to reinforce aluminium alloy matrices. Superior properties of these materials such as refractoriness, high hardness, high compressive strength, wear resistance, etc. makes them suitable for use as reinforcement in matrix of composites [4–11]. Nevertheless, low wet ability with molten metal’s and density
differences increases their tendency toward agglomeration, which deteriorates mechanical properties. Numerous attempts have been made to overcome the mentioned weakness [12–14]. As aerospace technology continues to advance, there is a rapidly increasing demand for advanced materials with high mechanical and thermal capabilities for such ultra high applications [15]. Its application also stretched to automobile, electronic and computer industries to replace the existing materials including plastics [16].
The early 1990s are considered to be the renaissance for Al as structural material due to environmental concerns, increasing safety and comfort levels. A significant improvement in the properties of Al alloys, reduced fuel consumption because of Lightweight has made huge demand from automobile industry [17, 18]. This growing requirements of materials with high specific mechanical properties with weight savings has fuelled significant research activities in recent times targeted primarily for further development of Al based composites [19–21]. A recent industrial review revealed that there are hundreds of components from structural to engine in which aluminium alloy is being developed for variety of applications [22]. It is also predicted that for Al alloys demand increased globally at an average rate of 20% every year [23]. It is noticed that the limited mechanical properties (strength and hardness) of Al and its alloys adversely affect its applications in automobile and aerospace industries [24, 25]. This remains one of the major concerns in its fabrication to suit its application in recent days.
II.EXPERIMENTAL PROCEDURE
ISSN: 2319-8753
I
nternational
J
ournal of
I
nnovative
R
esearch in
S
cience,
E
ngineering and
T
echnology
(An ISO 3297: 2007 Certified Organization)
Vol. 2, Issue 10, October 2013
containing the solution was introduced into a preheated muffle furnace maintained at 850 ± 5º C. The solution initially boils and undergoes dehydration followed by decomposition with the evolution of large amount of gases. The solution boiled resulting in a transparent gel. The gel then formed white foam, which expanded to fill the vessel. Shortly thereafter, the reaction was initiated somewhere in the interior and a flame appeared on the surface of the foam and proceeded rapidly throughout the entire volume, leaving a white powder with an extremely porous structure. The entire combustion process for producing MgO powder takes place. The reaction for combustion synthesis in the present case can be written in equation (1)
MgO+HNO3+ C6H12O6 + H2O →MgO + N2 + 6CO + 7H2O ……….. (1)
Fig.1. Flow chart for the combustion synthesis of MgO Nano powders
Mixed ceramic crucible and stirred
Heating in preheated furnace at 850O c
Solution concentrates, ignites foams
Fine voluminous powder is formed
2.2 Preparation of Al- MgOnano composites:
Aluminium alloy (Al356.1) and Nano sized MgOwere used to fabrication of composites. The composition of Al356.1 is shown in Table1 [1]
White powder of MgO
ISSN: 2319-8753
I
nternational
J
ournal of
I
nnovative
R
esearch in
S
cience,
E
ngineering and
T
echnology
(An ISO 3297: 2007 Certified Organization)
Vol. 2, Issue 10, October 2013
Table 1
Chemical composition of Al356.1Elements Al Si Fe Cu Mg Mn Zn Ni
Mass % 91.73 7.23 0.32 0.18 0.38 0.02 0.05 0.05
The samples were prepared using a resistance furnace, equipped with a stirring system. After smelting of aluminum ingots, MgO Nano powder was added to the molten metal and stirring was carried out at constant rate of 150 rpm for 20 min. according to the results of literature and previous works [19, 20]. Nano-powder MgO (0.5, 1.0, 1.5, and 2.0wt %) added to the molten metal during stirring. The casting was performed at 8500C. Steel circular die was used for casting of specimens. Finally, specimens fabricated at five various conditions were prepared for subsequent Microstructural and mechanical analyses.
III.RESULTS AND DISCUSSION
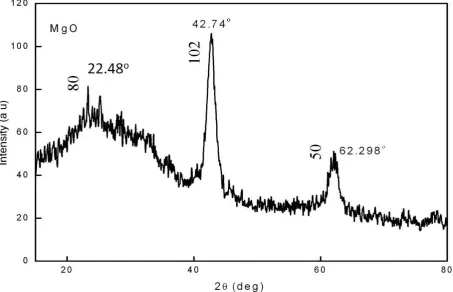
3.1 X-ray Diffractometer (XRD) Studies
ISSN: 2319-8753
I
nternational
J
ournal of
I
nnovative
R
esearch in
S
cience,
E
ngineering and
T
echnology
(An ISO 3297: 2007 Certified Organization)
Vol. 2, Issue 10, October 2013
The powder X-ray diffraction studies were carried out using Phillips X-raydiffractometer (model PW 3710) with Cu Kλ
radiation (λ = 1.5405 A˚ ) The X-ray diffraction pattern of nano-MgO powder confirms the crystalline phase and mean crystal size determined was around 40 nm. In the XRD observations three Strongest peaks shown in Fig. 2 were detected with Miller indices (223), (054), (126), and (082) corresponding to Bragg angles 30°, 36°, 51°and 59°respectively. The characteristic peaks are higher in intensity which indicates that the products are of good crystalline nature. No peaks corresponding to impurities are detected, showing that the final product is purely ZrO2 Nano powder. It is observed that intensity of the peaks increases with thermal treatment due to Agglomeration, which means that the crystalline has been improved. The full width at half maxima of major peaks decrease and confirms the grain size growth.
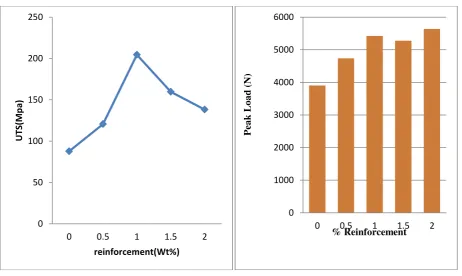
IV.TENSILE TEST
Fig 3: load v/s %variation of reinforcement Fig 4: load v/s %variation of reinforcement 0
50 100 150 200 250
0 0.5 1 1.5 2
UT
S
(M
p
a)
reinforcement(Wt%)
0 1000 2000 3000 4000 5000 6000
0 0.5 1 1.5 2
P
ea
k
L
o
a
d (
N)
ISSN: 2319-8753
I
nternational
J
ournal of
I
nnovative
R
esearch in
S
cience,
E
ngineering and
T
echnology
(An ISO 3297: 2007 Certified Organization)
Vol. 2, Issue 10, October 2013
Fig 5: Ultimate tensile strength v/s load Fig 6: UTS V/s %of reinforcement
V. WEAR TEST :
Fig 7: Wear rate v/s sliding distance Fig 8: Wear rate v/s speed (RPM) 0 50 100 150 200 250
2383.1 3216.7 5266.4 4197.4 3687.4
UT
S
M
p
a
load N
0 20 40 60 80 100 120 140 160 180
0 0.5 1 1.5 2
E n g g U T S ( N /m m 2
)
% Reinforcement 0 0.2 0.4 0.6 0.8 1 1.2 1.4 1.61.35 1.801 2.251 2.701 3.152
Wear r ate sliding distance 0 0.2 0.4 0.6 0.8 1 1.2 1.4 1.6 1.8 2
300 400 500 600 700
ISSN: 2319-8753
I
nternational
J
ournal of
I
nnovative
R
esearch in
S
cience,
E
ngineering and
T
echnology
(An ISO 3297: 2007 Certified Organization)
Vol. 2, Issue 10, October 2013
VI. HARDNESS TEST
Fig 8: hardness V/s %of reinforcement Fig 9:Bar chart of hardness V/s %of reinforcement
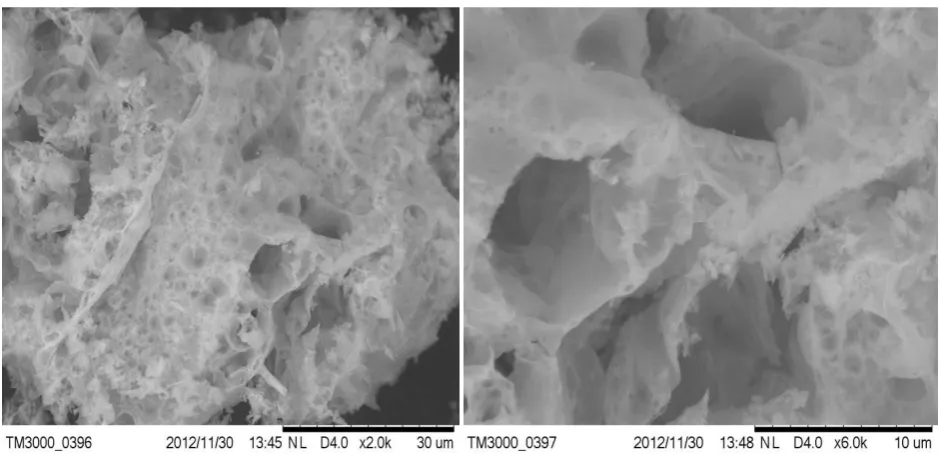
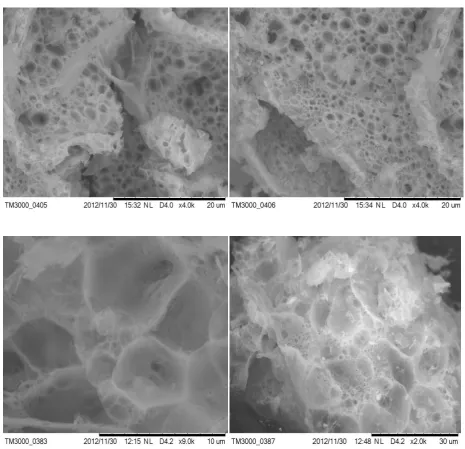
VII. SEM MICRO GRAPHS:
0 20 40 60 80 100 120
0 0.5 1 1.5 2
B
rin
ell
Hardn
ess
(
k
gf
/m
m
2)
% Reinforcement
0 20 40 60 80 100 120
0 0.5 1 1.5 2
Br
in
el
l
H
a
rdn
ess
(k
g
f/
m
m
2
ISSN: 2319-8753
I
nternational
J
ournal of
I
nnovative
R
esearch in
S
cience,
E
ngineering and
T
echnology
(An ISO 3297: 2007 Certified Organization)
Vol. 2, Issue 10, October 2013
Fig 9. SEM Micro graphs of MgO nano
VII.CONCLUSION
After conducting the hardness test for various specimens having different percentages of the Magnesium nano material (0.5%, 1.0%, 1.5%, and 2.0 %) and after calculating the BHN. we have come to conclusion that the maximum BHN for the specimen having 1.% of Magnesium nano material
ISSN: 2319-8753
I
nternational
J
ournal of
I
nnovative
R
esearch in
S
cience,
E
ngineering and
T
echnology
(An ISO 3297: 2007 Certified Organization)
Vol. 2, Issue 10, October 2013
[4] S.B. Hassan, O. Aponbiede, V.S. Aigbodion, J. Alloys Compd. 466 ,268–272 ,(2008). [5] S. Zhang, Y. Zhao, G. Chen, X. Cheng, J. Alloys Compd. 475,261–267 , (2009).
[6] W. Jianhua, Y. Danqing, S. Xuping, Y. Fucheng, L. Hongwu, Mater. Des. 30 ,78–81, ,(2009). [7] Y. Sahin, M. Kok, H. Celik, J. Mater. Process. Technol. 128, 280–291, (2002).
[8] S. Chou, J. Huang, D. Lii, H. Lu, J. Alloys Compd. 419 , 98–102, (2006).
[9] K.M. Shorowordi, T. Laoui, A.S.M.A. Haseeb, J.P. Celis, L. Froyen, J. Mater. Process. Technol. 142, 738–743, (2003). [10] E.L. Pen, D. Baptiste, G. Hug, Int. J. Fatigue 24 , 205–214, (2002).
[11] M. Khakbiz, F. Akhlaghi, J. Alloys Compd. 479 ,334–341, (2009).
[12] G.R. Li, Y.T. Zhao, H.M.Wang, G. Chen, Q.X. Dai, X.N. Cheng, J. Alloys Compd. 471,530–535, (2009) [13] J.K.M. Kwok, S.C. Lim, Compos. Sci. Technol. 59 , 55 63, (1999).
[14] J. Hashmi, L. Looney, M.S.J. Hashmi, J. Mater. Process. Technol. 92/93 , 1–7, (1999). [15] M.M. Opeka, I.G. Talmy, J.A. Zaykoki, J. Mater. Sci. 32, 5887–5894, (2004). [16] A. Luo, Metall. Mater. Trans. 26 2445–2453,(1995).
[17] R.A. Saravanan, M.K. Surappa, Mater. Sci. Eng. A 108 276–285, (2000). [18] S.F. Hassan, J. Gupta, J. Mater. Sci. 37 , 2467–2477, ( 2002)
[19] A. Singh, A.P. Tsai, Scripta Mater. 49 , 417–426, (2003)
[20] A.G. Guy, Elements of Physical Metallurgy, Addison-Wesley, USA, , 78–85, 1967 [21] M.O. Lai, D. Saravanaranganathan, J. Mater. Sci. 35 2155–2164, (2000)
[22] T. Yamamoto, Sasamoto, M. Inagaki, J. Mater. Sci. Lett. 19 1053–1064, (2000). [23] S. Awasthi, J.L.Wood, Adv. Ceram. Mater. 3449–3458, (1988).
[24] M.O. Lai, J. Mater. Sci. 35, 2155–2169, (2000).